

Abstract
Linked Articles
This article is commented on in the editorial by Holford NHG and Anderson BJ. Why standards are useful for predicting doses. Br J Clin Pharmacol 2017; 83: 685–7. doi: 10.1111/bcp.13230
Aim
When different models for weight and age are used in paediatric pharmacokinetic studies it is difficult to compare parameters between studies or perform model‐based meta‐analyses. This study aimed to compare published models with the proposed standard model (allometric weight0.75 and sigmoidal maturation function).
Methods
A systematic literature search was undertaken to identify published clearance (CL) reports for gentamicin and midazolam and all published models for scaling clearance in children. Each model was fitted to the CL values for gentamicin and midazolam, and the results compared with the standard model (allometric weight exponent of 0.75, along with a sigmoidal maturation function estimating the time in weeks of postmenstrual age to reach half the mature value and a shape parameter). For comparison, we also looked at allometric size models with no age effect, the influence of estimating the allometric exponent in the standard model and, for gentamicin, using a fixed allometric exponent of 0.632 as per a study on glomerular filtration rate maturation. Akaike information criteria (AIC) and visual predictive checks were used for evaluation.
Results
No model gave an improved AIC in all age groups, but one model for gentamicin and three models for midazolam gave slightly improved global AIC fits albeit using more parameters: AIC drop (number of parameters), –4.1 (5), –9.2 (4), –10.8 (5) and –10.1 (5), respectively. The 95% confidence interval of estimated CL for all top performing models overlapped.
Conclusion
No evidence to reject the standard model was found; given the benefits of standardised parameterisation, its use should therefore be recommended.
Keywords: allometric exponent, allometric scaling, children, gentamicin, infants, maturation function, midazolam, neonates, NONMEM, pharmacometrics
What is Already Known about this Subject
In children, clearance scales approximately with weight0.75 but in neonates and infants, maturation also affects clearance.
A standardised method for scaling size and postmenstrual age has been proposed but is not always used.
A systematic comparison of all suggested models is lacking.
What this Study Adds
Several published modelling approaches gave similar fits to the same data, but no model out‐performed the standard for all age groups.
Standardising scaling to a single method does not compromise model fitting and facilitates information sharing.
Table of Links
| LIGANDS |
|---|
| Gentamicin |
| Midazolam |
This Table lists key ligands in this article that are hyperlinked to corresponding entries in http://www.guidetopharmacology.org, the common portal for data from the IUPHAR/BPS Guide to PHARMACOLOGY 1.
Introduction
Smaller people need smaller absolute doses. Since the 1950s paediatricians have recognised that drug clearance (CL), and usually therefore dose requirements (which depend on drug exposure, i.e. area under the curve [AUC]), scales with body surface area rather than body weight 2. Body surface area can be approximated by raising weight to a power of 0.67, and the approach of relating a biological parameter with weight raised to some power is typically known as allometric scaling. The fact that CL scales in this way means that children will have higher dose requirements on a (linear) mg kg–1 basis compared to adults (see Figure 1). In 1950, Crawford et al. 2, and then almost 5 decades later, Holford 3, highlighted the parallels between weight and CL with the relationship of weight and basal metabolic rate. Basal metabolic rate and how it scales with weight has been studied for over a century and various “correct” values have been derived for the exponent with 0.75 4 and 0.67 5 being the two commonly argued “true” values. A comprehensive review summarising various mathematical descriptions of these observations, along with discussion on whether “basal”, “field”, or any other variety of metabolic rate should be used to infer drug CL scaling was recently provided by Mahmood 6.
Figure 1.
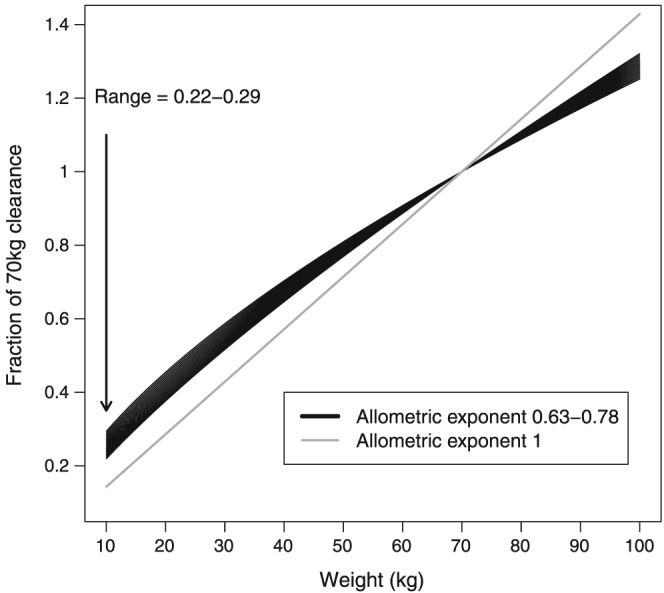
Illustration of the fractional change in clearance compared with using an allometric weight exponent of 0.63–0.78
Rather than focusing on cross‐species studies of metabolic rate however, when considering drug CL paediatric pharmacologists will be more interested in how eliminating organ function scales with size, and how drug CL scaled with size in previous studies. Rhodin et al. 7 found that in children and adults, glomerular filtration scales with weight raised to a power of 0.63, and of course paediatric nephrologists scale their reports of glomerular filtration rate by body surface area 8, 9. Concerning hepatic CL, Johnson et al. 10 found liver volume (and therefore hepatic blood flow 11) scales with weight raised to a power of 0.78. We can see from this that biological processes concerned with CL scale with weight raised to a power of 0.63–0.78 in children.
Whilst allometric scaling for size with an exponent of around 0.63–0.78 is widely accepted to be a useful approach to describe or predict CL in children 6, 12, it often does not perform as well in neonates and infants due to the maturation of drug eliminating processes. Two main approaches have been developed over recent years to account for this. The first is to use allometric weight scaling with a single fixed or estimated exponent with CL further multiplied by a maturation factor to adjust for age. This maturation factor is usually a logistic function of age which asymptotes towards 1 with increasing age. The second method is to use/estimate an allometric exponent which changes with either weight or age, for example with a sigmoidal function 13. For both of these approaches a wide variety of maturation functions or functions to vary the allometric exponent have been used.
A popular method for scaling for size and maturation is to fix the allometric weight exponent to 0.75, and to use a sigmoidal maturation function driven by postmenstrual age (PMA) (gestational plus postnatal age) such that CL scales in the following manner:
| (1) |
where CL is drug CL in an individual, CL T is the typical CL for a 70 kg adult, WT is body weight, PMA 50 is the PMA (usually in weeks) for CL to reach 50% mature, and Hill is the shape parameter. The rationale behind using PMA rather is that preterm neonates may have lower CL in early life due to immaturity of organ function and drug metabolising enzyme expression. This model has been proposed as a standard method for modelling CL in children 12, and its advantages are threefold: firstly the allometric exponent is fixed to a value within the accepted range of plausible values, thereby adding biological prior knowledge to the model without requiring the addition of a parameter. Secondly, the maturation parameters are easy to communicate: PMA50 gives the age at which CL is half‐way to being explained solely by weight, and the Hill coefficient describes the steepness of the maturation curve. Thirdly this model is flexible enough to describe slow and rapid (step‐like) maturation and anything in between.
This study aimed to seek evidence to reject the model presented in Equation (1). Our hypothesis was that no published model gives superior fit to this model across all age groups. We sought to test this by systematically reviewing the literature to identify models for maturation and/or size, and comparing their fit to the CL of two typical drugs, gentamicin (cleared almost exclusively by glomerular filtration) and midazolam (cleared almost exclusively by hepatic metabolism).
Methods
Gentamicin and midazolam CL data collection
The Medline database was searched using PubMed in (search last updated March 2016) to identify clinical pharmacokinetic (PK) studies where the CL of intravenously administered gentamicin and midazolam was reported. The keywords for the search strategy were: pharmacokinetics, midazolam, and gentamicin, and the filter “humans” was applied. The reference lists of the identified publications were also manually searched.
For each CL value the corresponding ages and weights were extracted from the reports. Since it is known that CL changes rapidly in the first weeks and months of life 7, 14, we did not include CL estimates where a wide age range of subjects (i.e. age a few days or weeks up to >10 years) were analysed together, with only a mean CL estimate provided for the whole group. Only gentamicin CL values that corresponded to age up to 50 years were kept in the dataset to avoid including adult values affected by declining renal function in older subjects. When only weight or age range was reported, the middle of the range was taken as the mean value of the demographic data. In neonatal studies, if only birth weight was reported, this was assumed as current body weight. A gestational age (GA) of 40 weeks was assigned for children and adults that did not have GA reported. Where only age was reported, typical weight for age was calculated using a published model 15. We did not include studies where a disease was known to affect the CL of midazolam or gentamicin.
Systematic search for models used to scale CL
A systematic literature review was undertaken (last updated in March 2016) using MEDLINE via PubMed, and, additionally, we emailed the NMUsers discussion group (a global discussion forum for users of NONMEM software) 16, to identify models for size and maturation. Search keywords were: allometry, allometric, scaling, pharmacokinetic, and pharmacokinetics. All models were compared to the proposed model (Equation (1)) with a fixed allometric exponent of 0.75 and a sigmoidal maturation function 12. For comparison, we also tested the parsimonious model of a single weight effect with either estimated allometric exponent or the allometric exponent fixed to 0.75 or 0.67.
Comparison of models for size and maturation
All models were normalized to 70 kg to facilitate parameter comparison. All parameters that were estimated in the original study were also estimated during the model comparison. We also tested the performance of a simple allometric model with either a single fixed (to 0.75 or 0.67) or estimated exponent. Fitting was performed using NONMEM version 7.3 17. Since CL is usually assumed to follow a log‐normal distribution, an exponential residual error model was used.
The Akaike information criteria (AIC), which was given by –2LL + 2p (where –2LL is –2 times the log likelihood reported as the objective function values in NONMEM and p the number of estimated parameters) was calculated for each model to the overall data and split by age as follows: neonates (0–28 days), infants (1–23.9 months), children (2–11.9 years), adolescents (12–18 years) and adults (>18 years). For each age group, the –2LL value for that age group only was used. The difference in AIC between the tested model and the proposed standard model was calculated, with a better performing model being defined as one in which the AIC was lower than the standard. We defined a better‐performing model as one for which the AIC was lower than the standard model in all age groups. Visual predictive checks were created using R version 3.1.0 18. For the five best models (lowest AIC values) the typical CL and 95% confidence interval were generated by simulation of 1000 parameter combinations using the standard errors from the NONMEM covariance step for a typical neonate, infant, child and adolescent.
Results
In total, 38 19, 20, 21, 22, 23, 24, 25, 26, 27, 28, 29, 30, 31, 32, 33, 34, 35, 36, 37, 38, 39, 40, 41, 42, 43, 44, 45, 46, 47, 48, 49, 50, 51, 52, 53, 54, 55, 56 and 44 57, 58, 59, 60, 61, 62, 63, 64, 65, 66, 67, 68, 69, 70, 71, 72, 73, 74, 75, 76, 77, 78, 79, 80, 81, 82, 83, 84, 85, 86, 87, 88, 89, 90, 91, 92, 93, 94, 95, 96, 97, 98, 99, 100 publications that included reported CL values were identified for gentamicin and midazolam, respectively. These papers reported a total of 66 and 57 CL values for gentamicin and midazolam, respectively. Four studies including a wide range of neonates, infants and children with only a mean CL estimate provided for the whole group were excluded 101, 102, 103, 104. Similarly, four gentamicin studies including wide adult age ranges (e.g. 16–96 years) were excluded 105, 106, 107, 108. Of the remaining data, a further 10 gentamicin CL values in subjects aged over 50 years were excluded 46, 47, 51, 52, 53, 54, 55. Eight studies 39, 41, 42, 46, 47, 72, 79, 89 did not report subjects' weights, so these were inferred from age as described above. The data used for modelling are presented in Supplementary materials Tables S1 and S2.
The models identified in the literature search that sought to account for changing age and weight relationships in neonates and infants could be split into two main categories: those that, in common with the standard model, add an age function to a fixed or estimated weight function to account for maturation in neonates/infants; and those that use an allometric weight exponent which changes by either age or weight. This change can be fixed predetermined steps or a continuous function. Model structure and estimated parameters are given in Table 1.
Table 1.
Table of model parameter estimates
| No. | Ref | Model equation | Studied population age range | Parameter | Gentamicin | Midazolam | |
|---|---|---|---|---|---|---|---|
| 1 | 12 |
|
θ1 | 5.97 (0.33) | 27.4 (0.95) | ||
| θ2 | 4.19 (0.70) | 4.04 (0.53) | |||||
| θ3 | 45.1 (2.96) | 55.4 (4.49) | |||||
| RUV | 0.075 (0.018) | 0.071 (0.012) | |||||
| 2 |
|
θ1 | 9.16 (1.42) | 24.9 (1.10) | |||
| θ2 | 1.28 (0.05) | 0.82 (0.10) | |||||
| RUV | 0.13 (0.027) | 0.20 (0.056) | |||||
| 3 |
|
θ1 | 2.90 (0.31) | 24.0 (1.39) | |||
| RUV | 0.64 (0.087) | 0.19 (0.05) | |||||
| 4 |
|
θ1 | 2.55 (0.31) | 23.1 (1.35) | |||
| RUV | 0.81 (0.122) | 0.19 (0.053) | |||||
| 5 | 119 |
|
Neonates | θ1 | 9.16 (1.42) | 24.9 (1.10) | |
| θ2 | 1.28 (0.05) | 0.82 (0.10) | |||||
| θ3 | 5.8 × 10⁻⁹ (1.52 × 10⁻⁹) | 5.8 × 10⁻⁹(4.13 × 10⁻⁹) | |||||
| RUV | 0.13 (0.027) | 0.20 (0.056) | |||||
| 6 | 28 |
|
Neonates | θ1 | 8.56 (1.29) | 24.9 (1.10), | |
| θ2 | 1.26 (0.04) | 0.82 (0.10) | |||||
| θ3 | 0.02 (0.064) | 6.6 × 10⁻⁸ (2.47 × 10⁻⁸) | |||||
| RUV | 0.13 (0.027) | 0.20 (0.056) | |||||
| 7 | 120 |
|
Neonates | θ1 | 1.51 (0.17) | 24.0 (1.39) | |
| θ2 | 0.0065 (0.0035) | 5.0 × 10⁻¹¹ (1.43 × 10⁻¹⁰) | |||||
| RUV | 0.34 (0.087) | 0.20 (0.050) | |||||
| 8 | 121 |
|
Neonates | θ1 | 2.10 (0.37), | 24.0 (1.39) | |
| θ2 | 0.00077 (0.00048) | 5.0 × 10⁻¹¹ (2.79 × 10⁻¹¹) | |||||
| RUV | 0.55 (0.069) | 0.20 (0.050) | |||||
| 9 |
|
θ1 | 5.86 (0.58) | 25.8 (0.98) | |||
| θ2 | 0.72 (0.097) | 0.57 (0.053) | |||||
| θ3 | 4.25 (0.67) | 3.9 (0.46) | |||||
| θ4 | 46.1 (4.88) | 68.3 (6.58) | |||||
| RUV | 0.075 (0.018) | 0.059 (0.0090) | |||||
| 9b | 7 |
|
Neonates–adults | θ1 | 5.59 (0.22) | – | |
| RUV | 0.086 (0.031) | ||||||
| 10 | 122 |
|
Neonates–adults | θ1 | 5.98 (0.34) | 27.0 (0.94) | |
| θ2 | 0.65 (0.037) | 0.71 (0.060) | |||||
| θ3 | 27.1 (4.90) | 28.9 (8.51) | |||||
| RUV | 0.08 (0.023) | 0.091 (0.019) | |||||
| 11 | 123 |
|
Infants | θ1 | 5.77 (0.34) | 27.1 (0.95) | |
| θ2 | 0.21 (0.018) | 0.11 (0.020) | |||||
| θ3 | 2.39 (1.53) | 2.63 (0.74) | |||||
| RUV | 0.097 (0.017) | 0.078 (0.013) | |||||
| 12 | 109 |
|
Neonates–children | θ1 | 5.91 (0.39) | 27.2 (0.96) | |
| θ2 | 1.10 (0.17) | 7.3 (0.19) | |||||
| θ3 | 0.29 (0.17) | 0.102 (0.0025) | |||||
| θ4 | 0.21 (0.019) | 0.12 (0.015) | |||||
| RUV | 0.097 (0.016) | 0.070 (0.011) | |||||
| 13 | 6 | ; b: 1.2 ≤ 3 mo; 1.0 > 3 mo–2 y; 0.9 > 2–5 y; 0.75 > 5y | Neonates–children | θ1 | 6.67 (0.25) | 27.3 (1.41) | |
| RUV | 0.08 (0.024) | 0.15 (0.039) | |||||
| 14 | 6 | ; b: 1.25 ≤ 9 kg; 0.76 > 9 kg | Neonates–children | θ1 | 7.64 (0.337) | 27.8 (1.52) | |
| RUV | 0.11 (0.032) | 0.17 (0.059) | |||||
| 15 | 124 | ; b: θ2 ≤ 16.5 kg; θ3> 16.5 kg | Neonates–adults | θ1 | 8.54 (2.08) | 24.6 (1.05) | |
| θ2 | 1.26 (0.075) | 0.85 (0.12) | |||||
| θ3 | 1.12 (0.28) | 0.67 (0.070) | |||||
| RUV | 0.13 (0.027) | 0.20 (0.055) | |||||
| 16 | 116 | , b = θ2 ⋅ WTθ3 | Neonates–adults | θ1 | 6.08 (0.57) | 25.4 (0.985) | |
| θ2 | 1.25 (0.026) | 1.38 (0.033) | |||||
| θ3 | –0.13 (0.024) | –0.27 (0.033) | |||||
| RUV | 0.08 (0.018) | 0.10 (0.022) | |||||
| 17 | 13 | , | Neonates–adults | θ1 | 5.31 (0.35) | 26.0 (0.98) | |
| θ2 | 1.09 (0.29) | 13.2 (8.22) | |||||
| θ3 | 1.23 (0.058) | 1.35 (0.023) | |||||
| θ4 | 17.8 (3.54) | 7.2 (0.39) | |||||
| θ5 | 1.26 (0.049) | 0.74 (0.044) | |||||
| RUV | 0.07 (0.022) | 0.056 (0.0083) | |||||
| 18 | 125 | , | Neonates–children | θ1 | 5.64 (0.44) | 26.1 (1.00) | |
| θ2 | 0.55 (0.26) | 19.6 (4.81) | |||||
| θ3 | 1.21 (0.032) | 1.36 (0.025) | |||||
| θ4 | 2.10 (7.84) | 0.017 (0.00046) | |||||
| θ5 | 0.95 (0.90) | 0.72 (0.046) | |||||
| RUV | 0.07 (0.014) | 0.056 (0.0080) |
CL, clearance; AIC, Akaike information criterion; θ1, typical value of clearance for a 70‐kg adult; b allometric exponent; WT, body weight in kg; PNA, postnatal age in years; PMA, postmenstrual age in weeks, mo, months; y, years. All θs represent estimated parameters, results are presented as mean (standard error). RUV is residual unexplained variability.
Change in AIC from the standard model are presented in Table 2, and a visual predictive check of observed CL values with model predictions given in Figures 2 and 3. The model comparisons showed that models with a sigmoidal‐type relationship for neonatal and infant maturation fitted best and that there was very little difference in the fit of these models to the observed CL values (Figures 2 and 3). No model gave consistently better results than model 1 in all age groups based on AIC (Table 2). In Table 3 the CL values and their uncertainty for each age group from the five best models are presented.
Table 2.
Numerical results showing the change in Akaike information criteria (AIC) between the tested models and the standard model
| No. | Gentamicin | Midazolam | ||||||||||
|---|---|---|---|---|---|---|---|---|---|---|---|---|
| AIC | AIC Neonates | AIC Infants | AIC Children | AIC Adolescents | AIC Adults | AIC | AIC Neonates | AIC Infants | AIC Children | AIC Adolescents | AIC Adults | |
| 1 | 0 | 0 | 0 | 0 | 0 | 0 | 0 | 0 | 0 | 0 | 0 | 0 |
| 2 | 31.8 | 6.9 | –6.0 | 10.2 | –3.8 | 16.5 | 73.8 | 53.2 | –3.7 | 4.4 | –1.5 | 13.4 |
| 3 | 147.1 | 111.5 | –7.3 | 18.4 | 3.5 | 5.0 | 72.9 | 57.4 | –7.1 | 0.4 | –3.2 | 9.4 |
| 4 | 170.5 | 131.9 | –6.2 | 17.2 | 4.4 | 7.2 | 76.8 | 63.4 | –7.7 | –0.8 | –3.0 | 9.0 |
| 5 | 33.8 | 8.9 | –4.0 | 12.2 | –1.8 | 18.5 | 75.8 | 55.2 | –1.7 | 6.4 | 0.5 | 15.4 |
| 6 | 33.7 | 8.6 | –3.9 | 11.6 | –1.8 | 19.3 | 75.8 | 55.2 | –1.7 | 6.4 | 0.5 | 15.4 |
| 7 | 97.9 | 36.0 | 3.4 | 18.5 | –1.4 | 33.3 | 74.9 | 59.4 | –5.1 | 2.4 | –1.2 | 11.4 |
| 8 | 129.9 | 78.5 | –5.3 | 31.0 | 0.7 | 17.0 | 74.9 | 59.4 | –5.1 | 2.4 | –1.2 | 11.4 |
| 9 | 1.9 | 2.1 | 2.3 | 1.9 | 2.3 | 1.3 | –9.2 | –1.8 | 0.2 | 1.3 | 3.0 | –3.9 |
| 9b | 3.8 | –4.4 | 4.4 | –3.3 | –3.5 | –5.4 | – | – | – | – | – | – |
| 10 | 4.1 | –0.6 | 4.2 | 0.4 | –0.2 | 0.4 | 15.6 | 9.0 | 3.3 | 1.1 | –0.1 | 2.3 |
| 11 | 16.7 | 18.2 | –3.4 | 1.5 | 0.2 | 0.2 | 6.1 | 7.6 | –2.0 | 0.0 | 0.1 | 0.3 |
| 12 | 18.7 | 19.7 | –1.5 | 3.8 | 1.9 | 2.7 | 0.6 | 5.0 | –1.7 | 1.9 | 2.3 | 1.2 |
| 13 | 0.8 | 3.2 | –11.4 | –1.7 | –5.9 | 0.6 | 43.3 | 11.9 | 7.7 | 3.1 | –4.7 | 9.3 |
| 14 | 18.2 | 3.1 | –3.2 | 1.8 | –6.1 | 6.7 | 49.3 | 5.8 | 19.9 | –1.1 | –4.8 | 13.6 |
| 15 | 33.2 | 9.2 | –3.5 | 13.9 | –1.9 | 15.5 | 73.7 | 52.1 | –0.1 | 7.4 | 0.2 | 14.1 |
| 16 | 6.7 | 8.3 | –6.3 | 4.3 | –0.6 | 1.0 | 20.6 | 23.3 | –2.9 | 1.4 | –0.3 | –1.0 |
| 17 | 0.4 | 9.4 | –1.6 | 4.5 | 3.9 | 0.1 | –10.8 | 1.5 | –1.7 | 1.9 | 5.3 | –1.8 |
| 18 | –4.1 | 3.8 | –0.4 | 3.4 | 4.1 | 1.1 | –10.1 | 0.7 | –0.3 | 1.5 | 5.4 | –1.4 |
AIC is Akaike information criterion (values are relative to AIC values for Model 1, negative values indicate a better fit than Model 1).
Figure 2.
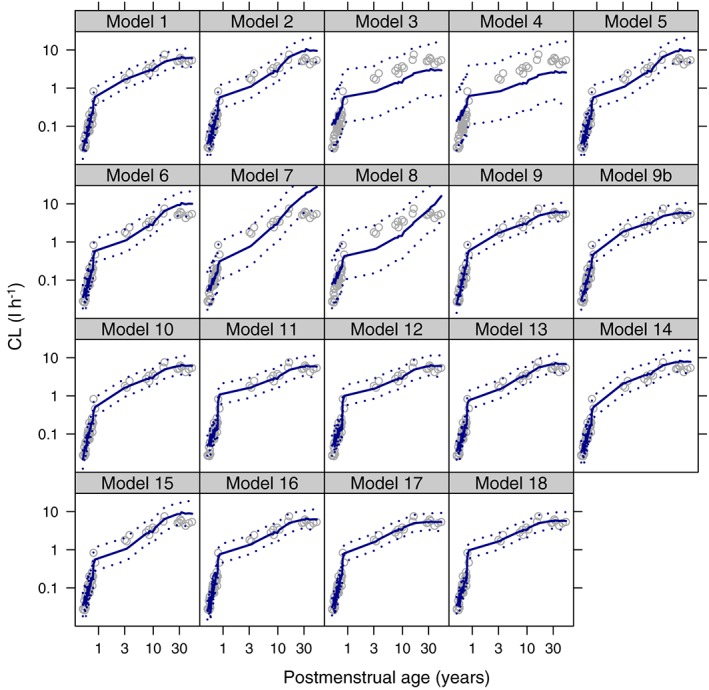
Gentamicin visual predictive checks for each model. Grey open circles are the observed clearance values, the blue solid line is the median simulated model prediction, the dotted blue lines are the 2.5th and 97.5th percentiles of the simulated model predictions. Log–log scale used to aid visualisation of the neonatal period
Figure 3.
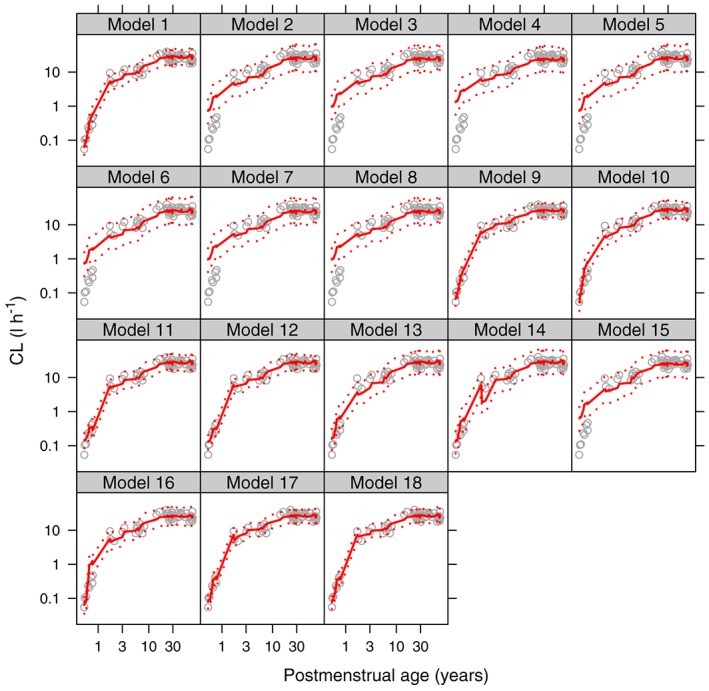
Midazolam visual predictive checks for each model. Grey open circles are the observed clearance values, the red solid line is the median simulated model prediction, the dotted red lines are the 2.5th and 97.5th percentiles of the simulated model predictions. Log–log scale used to aid visualisation of the neonatal period
Table 3.
Parameter estimates (95% confidence interval) for the four models with lowest global AIC for a 1‐day‐old term neonate weighing 3.5 kg, a 1‐year‐old infant weighing 9 kg, a 5‐year‐old child weighing 18 kg and a 12‐year old‐adolescent weighing 39 kg
| Models in order of overall AIC | Typical CL (95%CI) l h–1 | ||||
|---|---|---|---|---|---|
| Neonate | Infant | Child | Adolescent | ||
| Gentamicin | Model 18 | 0.16a | 1.03a | 2.42a | 4.15a |
| Model 1 | 0.24 (0.17,0.32) | 1.21 (0.96,1.44) | 2.15 (1.76,2.55) | 3.85 (3.13 4.59) | |
| Model 17 | 0.25 (0.05,1.52) | 1.00 (0.30,3.00) | 2.36 (1.07,4.83) | 4.25 (2.82,6.44) | |
| Model 13 | 0.18 (0.16,0.21) | 0.86 (0.73,0.98) | 1.97 (1.68,2.25) | 4.28 (3.65,4.88) | |
| Model 9 | 0.23 (0.04,1.54) | 1.27 (0.35,4.50) | 2.16 (0.93,5.03) | 3.84 (2.47,6.00) | |
| Model 9b | 0.34 (0.25,0.45) | 1.54 (1.22,1.86) | 2.53 (2.06,2.99) | 4.12 (3.38,4.92) | |
| Midazolam | Model 17 | 0.46 (0.19,1.10) | 6.48 (2.49,16.7) | 11.6 (5.56,24.1) | 18.3 (13.6,24.4) |
| Model 18 | 0.44a | 7.02a | 10.9a | 18.0a | |
| Model 9 | 0.51 (0.11,2.12) | 6.07 (2.25,16.5) | 11.9 (6.56 20.7) | 18.7 (14.4,25.0) | |
| Model 1 | 0.62 (0.38,0.92) | 5.20 (4.49,5.73) | 9.88 (9.22,10.6) | 17.6 (16.4,19.0) | |
| Model 12 | 0.35a | 5.84a | 9.82a | 17.5a | |
| Model 11 | 0.34 (−0.44,1.12) | 5.42 (3.74 5.99) | 9.78 (9.00,10.5) | 17.5 (16.2,18.7) | |
95% confidence interval cannot be constructed because uncertainty on a parameter raised to some power means possible values are less than zero
Discussion
We have compared the fit of all the major types of published models for size and age scaling of CL in children to two datasets, and have found that no model gave a superior fit in all age groups to the proposed standard model. Several recent studies have compared the performance of a single or limited range of models for predicting CL in a limited range of drugs 6, 12, 109, 110. None of these studies has systematically compared all published models, so their relative merits are not apparent, although an impressive number of drugs has been used (44 in the case of Holford et al. 12). Prediction of paediatric PK, be it with scaled adult models or physiologically based PK, is useful for study design, but ultimately paediatric PK data need to be collected in order to make dosing decisions. For data fitting, models need to be parsimonious (not estimate too many parameters) in order that parameters are estimated with a reasonable degree of precision, yet flexible enough to describe observed trends. Since weight raised to a fixed power of 0.75 with a sigmoidal PMA maturation function has been shown to give good predictions for a large range of compounds 12, we have therefore sought to challenge this model by direct comparison of its ability to fit the same data as all previous published models. No published model was able to out‐perform the standard model for fitting.
Our result has implications for both new drug development and the study of unlicensed and off‐label medicine use, which remains commonplace 111, 112, 113, 114. Patient recruitment to paediatric PK studies remains a challenge in both these settings, and if the same modelling approach was taken for scaling size and age in all studies, this would allow information to be shared across compounds with similar modes of elimination, and facilitate model‐based meta‐analyses. A body of biological prior information on values for PMA50 and Hill would be generated which would have a number of uses: (i) allowing the analysts of small datasets to fix size and maturation models based on literature from the same or similar compounds to search for other potential covariates of interest; (ii) giving journal reviewers and regulators the opportunity to compare estimated parameters with those expected from previous studies on similar compounds; (iii) facilitating the inclusion of in vitro information on maturation of drug eliminating enzymes 115; and (iv) allowing the combination of studies without requiring the sharing of raw data using model‐based meta‐analysis.
Unsurprisingly, the models that did not account for age or allow the allometric exponent to change with age or weight (Models 2, 3 and 4 in Table 1) performed poorly, confirming the need to account for both. Also, those models with linear or exponential maturation, which tended to have been developed in neonates (Models 5, 6, 7 and 8), did not fit well suggesting the need for the sigmoidal‐type shape that the Hill coefficient gives. Importantly, should the true maturation shape be exponential or linear over the entire human age range, the sigmoidal model has the flexibility to fit these by allowing the Hill coefficient to be 1 and the PMA 50 parameter to be very large. Similarly, if maturation is complete in early gestation, the model also has the possibility to account for this with a low estimate of PMA 50.
Although no single model gave a reduced AIC in all age groups, Model 18 (and in the case of midazolam only, Models 17 and 9 also) gave slightly better overall fits. Both Models 17 and 18 had five estimated parameters, whereas Model 9 had four estimated parameters, compared with the three estimated parameters of the standard model. The price of this improved fit was an increase in standard errors and indeed Table 3 shows that for Model 18 it was not possible to construct 95% confidence intervals (CIs) since the uncertainty on θ4 meant it could take negative values. We did see a trend towards models having superior fit in infants but worse fit in neonates. The main reasons for this are that either models did not account for maturation, or that postnatal age (PNA) rather than PMA was used and hence gestation was not accounted for, worsening the neonatal fit. Since no model had a globally improved AIC in addition to improved AIC in each age group, we found no evidence to reject the standard model.
Whilst the 95% CI for all the CL estimates in Table 3 overlapped each other, and hence they do not significantly differ, dosing recommendations are usually based on the typical model prediction, and so different doses would have been recommended based on these top five models. To take midazolam as an example of where CL may be used to directly infer dosing, Ince et al. 116 reported that the lower end of the target concentration for sedation with midazolam was 250 μg l–1. Multiplying this by the CL values in Table 3 we have predicted dose ranges of: 24–44, 144–195, 140–165 and 112–120 μg kg–1 h–1 for the typical neonate, infant, child and adolescent in the example (note that doses are scaled by kg as this is standard practice in paediatric intensive care). Typically for midazolam, neonatal dose rates are titrated to the nearest 25 μg kg–1 h–1, whereas in older children titrations are in 50 μg kg–1 h–1. From this it can be seen that all but the neonatal group, the models would all have predicted the same typical dose when scaled to the nearest 50 μg kg–1 h–1. Even in the neonatal group, if we exclude Models 18 and 12 because 95% CI could not be constructed, and Model 11 since the neonatal CL value could take negative values, we are left with a much tighter range of predicted doses (32–44 μg kg–1 h–1).
In the neonatal group, the models with lower AIC than Model 1 were Model 9b for gentamicin and Model 9 for midazolam (Table 2). Both these models were variations on Model 1, in that Model 9b used an allometric exponent of 0.632 (tested for gentamicin since this was the estimated exponent for GFR maturation by Rhodin et al. 7), and Model 9 estimated the allometric exponent, and so in the age group where there is potential uncertainty in the midazolam recommended dose rate (see above), the standard model fits best. A contributing factor to the standard model performing well in neonates is the use of PMA rather than weight alone, or PNA. The reason to use PMA rather than PNA ought to be apparent, in that by using PNA, a baby born prematurely would be treated in exactly the same way as a term baby despite the fact eliminating organ function and enzyme expression will be less developed. Similarly, allowing the allometric exponent to change with weight gives identical treatment to babies of the same weight regardless of their gestational age. There will almost certainly be additional increases in CL in the first few days of life in addition to those predicted by gestation, and in situations where rich neonatal data with a range of PNA and PMA are available, it may be possible to identify this effect separately 117. Despite the obvious rationale for using of PMA, several published models did not take this approach.
A possible limitation of this work is that despite systematically comparing all models, these were only tested on two datasets, and we also used some model‐based predictions of CL. To address this we would argue that the standard model has already been evaluated on data from 44 drugs 12, and so to discriminate between models required comparison on the same data. Gentamicin and midazolam were chosen as they each accounted for an example renal and hepatic CL respectively, and there were sufficient intravenous data available in the literature to cover the whole age range. Whilst we would have preferred individual noncompartmental AUC(0–∞) estimates to infer CL from, these are simply not available in all age groups, particularly neonates. Hence we did also use model based CL estimates in narrow age and weight ranges, and consider this should not unduly bias our results since all models were tested on the same data. We also did not only include data from healthy subjects, which are anyhow unavailable for paediatric subjects due to ethical reasons. However, we only included data from studies where a disease did not have a known effect on CL (for example, neonates on extracorporeal membrane oxygenation were shown to have similar midazolam CL to nonextracorporeal membrane oxygenation neonates 63), and also some data from critically ill subjects (such as neonates receiving midazolam 62, who were also shown to have similar CL (for an infant of the same weight) to noncritically ill neonates 59).
Whether to estimate an allometric exponent from PK data was recently explored by McLeay et al. 118 in an extensive meta‐analysis. They found an average allometric exponent on CL of 56 drugs to be 0.65 (precision of this estimate was not reported but a histogram of the estimated values shows a 95% CI of approximately 0.1–1.2). This highlights the fact that a size‐related allometric exponent can be difficult to identify, and indeed Model 9, which was the standard model with estimated allometric exponent, did not give a superior overall fit. Our results support the argument that fixing the allometric exponent, thereby adding biological prior information on the effect of body size a priori, will allow delineation of size from other important covariates without adding an uncertain parameter and thereby potentially destabilising parameter estimation. The importance of minimising the number of estimated parameters is highlighted by Model 18 for which 95% CI of dosing predictions could not be constructed due to the uncertainty in parameter estimates. Interestingly, Model 13, with only one estimated parameter and cut‐off ages to decrease the allometric exponent with increasing age (effectively fixing both the size and maturation parts of the model), performed well for gentamicin, but less well for midazolam, although it did give similar CL values to the standard model in older subjects. From a point of view of model parsimony, this model may be relatively attractive, but the poor fit for midazolam in neonates and infants suggests that fixed cut‐offs in the maturation applied to all drugs may not be appropriate. However, the performance of Model 9b for gentamicin, which used fixed allometric and maturation parameters from a previous study on GFR maturation 7, shows that using biological prior information based on the mechanism of CL may be a useful approach.
In conclusion, a systematic comparison was undertaken of all published models for scaling CL in children, which were tested against the proposed standard model using a fixed allometric weight exponent of 0.75 and an estimated sigmoidal maturation function based on PMA with parameters of 50% mature value and Hill coefficient. We found no evidence to suggest any significant improvement in model fit can be achieved over use of this standard parametrisation. For the two model drugs, midazolam and gentamicin, maturation clearly followed a sigmoidal‐type pattern, so linear or exponential age‐functions should not be used. Standardising model parameterisation to this single approach will benefit the paediatric PK community by facilitating parameter value interpretation and model sharing across studies of the same drug and between compounds.
Competing Interests
All authors have completed the Unified Competing Interest form at www.icmje.org/coi_disclosure.pdf (available on request from the corresponding author) and declare: The authors report no financial conflict of interest and this manuscript details work that was not specifically funded, but arose from the PhD projects of E.G. and C.B. supervised by M.S. and J.F.S. E.G. has been supported by an IMPACT PhD studentship from University College London (UCL), and has received funding from the NeoMero study, part of the European Union Seventh Framework Programme for research, technological development and demonstration (Grant Agreement number 242 146), and also from Action Medical Research (grant code SP4650, GN1834). C.I.S.B. is funded as a Clinical Research Fellow by the Global Research in Paediatrics Network of Excellence (GRiP), part of the European Union's Seventh Framework Programme for research, technological development and demonstration (FP7/2007–2013, Grant Agreement number 261 060). M.S. chairs the UK Department of Health expert Advisory Committee on Antimicrobial Resistance and Healthcare Associated Infection, is an independent scientific advisor to NICE (The National Institute for Health and Care Excellence), and also receives institutional academic research grants from the NIHR (National Institute for Health Research) and the European Union. J.F.S. has received funding from United Kingdom Medical Research Council Fellowships (grants G1002305 and M008665), and been supported by the National Institute for Health Research Biomedical Research Centre at Great Ormond Street Hospital for Children NHS Foundation Trust and University College London.
Supporting information
Table S1 Gentamicin clearance and covariate values used for modelling
Table S2 Midazolam clearance and covariate values used for modelling
Supporting info item
Germovsek, E. , Barker, C. I. S. , Sharland, M. , and Standing, J. F. (2017) Scaling clearance in paediatric pharmacokinetics: All models are wrong, which are useful?. Br J Clin Pharmacol, 83: 777–790. doi: 10.1111/bcp.13160.
References
- 1. Southan C, Sharman JL, Benson HE, Faccenda E, Pawson AJ, Alexander SP, et al. The IUPHAR/BPS Guide to PHARMACOLOGY in 2016: towards curated quantitative interactions between 1300 protein targets and 6000 ligands. Nucl Acids Res 2016; 44: D1054–D1068. [DOI] [PMC free article] [PubMed] [Google Scholar]
- 2. Crawford JD, Terry ME, Rourke GM. Simplification of drug dosage calculation by application of the surface area principle. Pediatrics 1950; 5: 783–790. [PubMed] [Google Scholar]
- 3. Holford NH. A size standard for pharmacokinetics. Clin Pharmacokinet 1996; 30: 329–332. [DOI] [PubMed] [Google Scholar]
- 4. Kleiber M. Body size and metabolism. Hilgardia 1932; 6: 315–353. [Google Scholar]
- 5. Benedict FG. Vital Energetics: A Study in Comparative Basal Metabolism: Carnegie Institution, 1938.
- 6. Mahmood I. Dosing in children: a critical review of the pharmacokinetic allometric scaling and modelling approaches in paediatric drug development and clinical settings. Clin Pharmacokinet 2014; 53: 327–346. [DOI] [PubMed] [Google Scholar]
- 7. Rhodin MM, Anderson BJ, Peters AM, Coulthard MG, Wilkins B, Cole M, et al. Human renal function maturation: a quantitative description using weight and postmenstrual age. Pediatr Nephrol 2009; 24: 67–76. [DOI] [PubMed] [Google Scholar]
- 8. Fadrowski JJ, Neu AM, Schwartz GJ, Furth SL. Pediatric GFR estimating equations applied to adolescents in the general population. Clin J Am Soc Nephrol 2011; 6: 1427–1435. [DOI] [PMC free article] [PubMed] [Google Scholar]
- 9. Schwartz GJ, Schneider MF, Maier PS, Moxey‐Mims M, Dharnidharka VR, Warady BA, et al. Improved equations estimating GFR in children with chronic kidney disease using an immunonephelometric determination of cystatin C. Kidney Int 2012; 82: 445–453. [DOI] [PMC free article] [PubMed] [Google Scholar]
- 10. Johnson TN, Tucker GT, Tanner MS, Rostami‐Hodjegan A. Changes in liver volume from birth to adulthood: a meta‐analysis. Liver Transpl 2005; 11: 1481–1493. [DOI] [PubMed] [Google Scholar]
- 11. Price PS, Conolly RB, Chaisson CF, Gross EA, Young JS, Mathis ET, et al. Modeling interindividual variation in physiological factors used in PBPK models of humans. Crit Rev Toxicol 2003; 33: 469–503. [PubMed] [Google Scholar]
- 12. Holford N, Heo YA, Anderson B. A pharmacokinetic standard for babies and adults. J Pharm Sci 2013; 102: 2941–2952. [DOI] [PubMed] [Google Scholar]
- 13. Wang C, Sadhavisvam S, Krekels EH, Dahan A, Tibboel D, et al. Developmental changes in morphine clearance across the entire paediatric age range are best described by a bodyweight‐dependent exponent model. Clin Drug Investig 2013; 33: 523–534. [DOI] [PubMed] [Google Scholar]
- 14. Alcorn J, McNamara PJ. Ontogeny of hepatic and renal systemic clearance pathways in infants: part I. Clin Pharmacokinet 2002; 41: 959–998. [DOI] [PubMed] [Google Scholar]
- 15. Sumpter AL, Holford NH. Predicting weight using postmenstrual age – neonates to adults. Paediatr Anaesth 2011; 21: 309–315. [DOI] [PubMed] [Google Scholar]
- 16. NMUsers. Available at http://www.cognigencorp.com/index.php/resources_nonmem (last accessed 9 April 2015).
- 17. Boeckmann AJ, Beal SL, Sheiner LB. NONMEM users guide. San Francisco: University of California at San Francisco, 1999. [Google Scholar]
- 18. R Core Team . R: A language and environment for statistical computing. Vienna, Austria: R Foundation for Statistical Computing, 2014. Available at http://www.R‐project.org/. [Google Scholar]
- 19. Knight JA, Davis EM, Manouilov K, Hoie EB. The effect of postnatal age on gentamicin pharmacokinetics in neonates. Pharmacotherapy 2003; 23: 992–996. [DOI] [PubMed] [Google Scholar]
- 20. Dodge WF, Jelliffe RW, Richardson CJ, McCleery RA, Hokanson JA, Snodgrass WR. Gentamicin population pharmacokinetic models for low birth weight infants using a new nonparametric method. Clin Pharmacol Ther 1991; 50: 25–31. [DOI] [PubMed] [Google Scholar]
- 21. Nielsen EI, Sandstrom M, Honore PH, Ewald U, Friberg LE. Developmental pharmacokinetics of gentamicin in preterm and term neonates: population modelling of a prospective study. Clin Pharmacokinet 2009; 48: 253–263. [DOI] [PubMed] [Google Scholar]
- 22. Low YS, Tan SL, Wan AS. Extended‐interval gentamicin dosing in achieving therapeutic concentrations in Malaysian neonates. J Pediatr Pharmacol Ther 2015; 20: 119–127. [DOI] [PMC free article] [PubMed] [Google Scholar]
- 23. Nakae S, Yamada M, Ito T, Chiba Y, Sasaki E, Sakamoto M, et al. Gentamicin dosing and pharmacokinetics in low birth weight infants. Tohoku J Exp Med 1988; 155: 213–223. [DOI] [PubMed] [Google Scholar]
- 24. Lulic‐Botica M, Sheer T, Edwards D, Thomas RL, Natarajan G. Impact of small‐for‐gestational age (SGA) status on gentamicin pharmacokinetics in neonates. J Clin Pharmacol 2014; 54: 39–45. [DOI] [PubMed] [Google Scholar]
- 25. DiCenzo R, Forrest A, Slish JC, Cole C, Guillet R. A gentamicin pharmacokinetic population model and once‐daily dosing algorithm for neonates. Pharmacotherapy 2003; 23: 585–591. [DOI] [PubMed] [Google Scholar]
- 26. Vervelde ML, Rademaker CM, Krediet TG, Fleer A, van Asten P, van Dijk A. Population pharmacokinetics of gentamicin in preterm neonates: evaluation of a once‐daily dosage regimen. Ther Drug Monit 1999; 21: 514–519. [DOI] [PubMed] [Google Scholar]
- 27. Garcia B, Barcia E, Perez F, Molina IT. Population pharmacokinetics of gentamicin in premature newborns. J Antimicrob Chemother 2006; 58: 372–379. [DOI] [PubMed] [Google Scholar]
- 28. Lanao JM, Calvo MV, Mesa JA, Martin‐Suarez A, Carbajosa MT, Miguelez F, et al. Pharmacokinetic basis for the use of extended interval dosage regimens of gentamicin in neonates. J Antimicrob Chemother 2004; 54: 193–198. [DOI] [PubMed] [Google Scholar]
- 29. Fuchs A, Guidi M, Giannoni E, Werner D, Buclin T, Widmer N, et al. Population pharmacokinetic study of gentamicin in a large cohort of premature and term neonates. Br J Clin Pharmacol 2014; 78: 1090–1101. [DOI] [PMC free article] [PubMed] [Google Scholar]
- 30. Haughey DB, Hilligoss DM, Grassi A, Schentag JJ. Two‐compartment gentamicin pharmacokinetics in premature neonates: a comparison to adults with decreased glomerular filtration rates. J Pediatr 1980; 96: 325–330. [DOI] [PubMed] [Google Scholar]
- 31. Botha JH, du Preez MJ, Adhikari M. Population pharmacokinetics of gentamicin in South African newborns. Eur J Clin Pharmacol 2003; 59: 755–759. [DOI] [PubMed] [Google Scholar]
- 32. Lingvall M, Reith D, Broadbent R. The effect of sepsis upon gentamicin pharmacokinetics in neonates. Br J Clin Pharmacol 2005; 59: 54–61. [DOI] [PMC free article] [PubMed] [Google Scholar]
- 33. Murphy JE, Austin ML, Frye RF. Evaluation of gentamicin pharmacokinetics and dosing protocols in 195 neonates. Am J Health Syst Pharm 1998; 55: 2280–2288. [DOI] [PubMed] [Google Scholar]
- 34. Thomson AH, Way S, Bryson SM, McGovern EM, Kelman AW, Whiting B. Population pharmacokinetics of gentamicin in neonates. Dev Pharmacol Ther 1988; 11: 173–179. [DOI] [PubMed] [Google Scholar]
- 35. Bhatt‐Mehta V, Donn SM. Gentamicin pharmacokinetics in term newborn infants receiving high‐frequency oscillatory ventilation or conventional mechanical ventilation: a case‐controlled study. J Perinatol 2003; 23: 559–562. [DOI] [PubMed] [Google Scholar]
- 36. Izquierdo M, Lanao JM, Cervero L, Jimenez NV, Dominguez‐Gil A. Population pharmacokinetics of gentamicin in premature infants. Ther Drug Monit 1992; 14: 177–183. [DOI] [PubMed] [Google Scholar]
- 37. Mark LF, Solomon A, Northington FJ, Lee CK. Gentamicin pharmacokinetics in neonates undergoing therapeutic hypothermia. Ther Drug Monit 2013; 35: 217–222. [DOI] [PMC free article] [PubMed] [Google Scholar]
- 38. Lopez SA, Mulla H, Durward A, Tibby SM. Extended‐interval gentamicin: population pharmacokinetics in pediatric critical illness. Pediatr Crit Care Med 2010; 11: 267–274. [DOI] [PubMed] [Google Scholar]
- 39. Cohen P, Collart L, Prober CG, Fischer AF, Blaschke TF. Gentamicin pharmacokinetics in neonates undergoing extracorporal membrane oxygenation. Pediatr Infect Dis J 1990; 9: 562–566. [DOI] [PubMed] [Google Scholar]
- 40. Medellin‐Garibay SE, Rueda‐Naharro A, Pena‐Cabia S, Garcia B, Romano‐Moreno S, Barcia E. Population pharmacokinetics of gentamicin and dosing optimization for infants. Antimicrob Agents Chemother 2015; 59: 482–489. [DOI] [PMC free article] [PubMed] [Google Scholar]
- 41. Bass KD, Larkin SE, Paap C, Haase GM. Pharmacokinetics of once‐daily gentamicin dosing in pediatric patients. J Pediatr Surg 1998; 33: 1104–1107. [DOI] [PubMed] [Google Scholar]
- 42. Shankar SM, Jew RK, Bickert BM, Cavalieri GE, Bell LM, Lange BJ. Pharmacokinetics of single daily dose gentamicin in children with cancer. J Pediatr Hematol Oncol 1999; 21: 284–288. [DOI] [PubMed] [Google Scholar]
- 43. Ho KK, Bryson SM, Thiessen JJ, Greenberg ML, Einarson TR, Leson CL. The effects of age and chemotherapy on gentamicin pharmacokinetics and dosing in pediatric oncology patients. Pharmacotherapy 1995; 15: 754–764. [PubMed] [Google Scholar]
- 44. Postovsky S, Ben Arush MW, Kassis E, Elhasid R, Krivoy N. Pharmacokinetic analysis of gentamicin thrice and single daily dosage in pediatric cancer patients. Pediatr Hematol Oncol 1997; 14: 547–554. [DOI] [PubMed] [Google Scholar]
- 45. Walker JM, Wise R, Mitchard M. The pharmacokinetics of amikacin and gentamicin in volunteers: a comparison of individual differences. J Antimicrob Chemother 1979; 5: 95–99. [DOI] [PubMed] [Google Scholar]
- 46. el‐Sayed YM, Islam SI. Effect of age and renal function on gentamicin pharmacokinetic parameters. Int J Clin Pharmacol Ther Toxicol 1989; 27: 503–509. [PubMed] [Google Scholar]
- 47. Zaske DE, Cipolle RJ, Rotschafer JC, Solem LD, Mosier NR, Strate RG. Gentamicin pharmacokinetics in 1,640 patients: method for control of serum concentrations. Antimicrob Agents Chemother 1982; 21: 407–411. [DOI] [PMC free article] [PubMed] [Google Scholar]
- 48. Simon VK, Mosinger EU, Malerczy V. Pharmacokinetic studies of tobramycin and gentamicin. Antimicrob Agents Chemother 1973; 3: 445–450. [DOI] [PMC free article] [PubMed] [Google Scholar]
- 49. Demczar DJ, Nafziger AN, Bertino JS Jr. Pharmacokinetics of gentamicin at traditional versus high doses: implications for once‐daily aminoglycoside dosing. Antimicrob Agents Chemother 1997; 41: 1115–1119. [DOI] [PMC free article] [PubMed] [Google Scholar]
- 50. Gilman TM, Brunnemann SR, Segal JL. Comparison of population pharmacokinetic models for gentamicin in spinal cord‐injured and able‐bodied patients. Antimicrob Agents Chemother 1993; 37: 93–99. [DOI] [PMC free article] [PubMed] [Google Scholar]
- 51. Bianco TM, Dwyer PN, Bertino JS Jr. Gentamicin pharmacokinetics, nephrotoxicity, and prediction of mortality in febrile neutropenic patients. Antimicrob Agents Chemother 1989; 33: 1890–1895. [DOI] [PMC free article] [PubMed] [Google Scholar]
- 52. Bertino JS Jr, Booker LA, Franck P, Rybicki B. Gentamicin pharmacokinetics in patients with malignancies. Antimicrob Agents Chemother 1991; 35: 1501–1503. [DOI] [PMC free article] [PubMed] [Google Scholar]
- 53. Lewis DR, Longman RJ, Wisheart JD, Spencer RC, Brown NM. The pharmacokinetics of a single dose of gentamicin (4 mg kg−1) as prophylaxis in cardiac surgery requiring cardiopulmonary bypass. Cardiovasc Surg 1999; 7: 398–401. [DOI] [PubMed] [Google Scholar]
- 54. Goncalves‐Pereira J, Martins A, Povoa P. Pharmacokinetics of gentamicin in critically ill patients: pilot study evaluating the first dose. Clin Microbiol Infect 2010; 16: 1258–1263. [DOI] [PubMed] [Google Scholar]
- 55. Hilmer SN, Tran K, Rubie P, Wright J, Gnjidic D, Mitchell SJ, et al. Gentamicin pharmacokinetics in old age and frailty. Br J Clin Pharmacol 2011; 71: 224–231. [DOI] [PMC free article] [PubMed] [Google Scholar]
- 56. Johnston C, Hilmer SN, McLachlan AJ, Matthews ST, Carroll PR, Kirkpatrick CM. The impact of frailty on pharmacokinetics in older people: using gentamicin population pharmacokinetic modeling to investigate changes in renal drug clearance by glomerular filtration. Eur J Clin Pharmacol 2014; 70: 549–555. [DOI] [PubMed] [Google Scholar]
- 57. Lee TC, Charles BG, Harte GJ, Gray PH, Steer PA, Flenady VJ. Population pharmacokinetic modeling in very premature infants receiving midazolam during mechanical ventilation: midazolam neonatal pharmacokinetics. Anesthesiology 1999; 90: 451–457. [DOI] [PubMed] [Google Scholar]
- 58. Harte GJ, Gray PH, Lee TC, Steer PA, Charles BG. Haemodynamic responses and population pharmacokinetics of midazolam following administration to ventilated, preterm neonates. J Paediatr Child Health 1997; 33: 335–338. [DOI] [PubMed] [Google Scholar]
- 59. de Wildt SN, Kearns GL, Hop WC, Murry DJ, Abdel‐Rahman SM, van den Anker JN. Pharmacokinetics and metabolism of intravenous midazolam in preterm infants. Clin Pharmacol Ther 2001; 70: 525–531. [DOI] [PubMed] [Google Scholar]
- 60. Jacqz‐Aigrain E, Daoud P, Burtin P, Maherzi S, Beaufils F. Pharmacokinetics of midazolam during continuous infusion in critically ill neonates. Eur J Clin Pharmacol 1992; 42: 329–332. [DOI] [PubMed] [Google Scholar]
- 61. Burtin P, Jacqz‐Aigrain E, Girard P, Lenclen R, Magny JF, Betremieux P, et al. Population pharmacokinetics of midazolam in neonates. Clin Pharmacol Ther 1994; 56: 615–625. [DOI] [PubMed] [Google Scholar]
- 62. Jacqz‐Aigrain E, Wood C, Robieux I. Pharmacokinetics of midazolam in critically ill neonates. Eur J Clin Pharmacol 1990; 39: 191–192. [DOI] [PubMed] [Google Scholar]
- 63. Mulla H, McCormack P, Lawson G, Firmin RK, Upton DR. Pharmacokinetics of midazolam in neonates undergoing extracorporeal membrane oxygenation. Anesthesiology 2003; 99: 275–282. [DOI] [PubMed] [Google Scholar]
- 64. Ahsman MJ, Hanekamp M, Wildschut ED, Tibboel D, Mathot RA. Population pharmacokinetics of midazolam and its metabolites during venoarterial extracorporeal membrane oxygenation in neonates. Clin Pharmacokinet 2010; 49: 407–419. [DOI] [PubMed] [Google Scholar]
- 65. Peeters MY, Prins SA, Knibbe CA, Dejongh J, Mathot RA, Warris C, et al. Pharmacokinetics and pharmacodynamics of midazolam and metabolites in nonventilated infants after craniofacial surgery. Anesthesiology 2006; 105: 1135–1146. [DOI] [PubMed] [Google Scholar]
- 66. Reed MD, Rodarte A, Blumer JL, Khoo KC, Akbari B, Pou S, et al. The single‐dose pharmacokinetics of midazolam and its primary metabolite in pediatric patients after oral and intravenous administration. J Clin Pharmacol 2001; 41: 1359–1369. [DOI] [PubMed] [Google Scholar]
- 67. Mathews HM, Carson IW, Lyons SM, Orr IA, Collier PS, Howard PJ, et al. A pharmacokinetic study of midazolam in paediatric patients undergoing cardiac surgery. Br J Anaesth 1988; 61: 302–307. [DOI] [PubMed] [Google Scholar]
- 68. Muchohi SN, Kokwaro GO, Ogutu BR, Edwards G, Ward SA, Newton CR. Pharmacokinetics and clinical efficacy of midazolam in children with severe malaria and convulsions. Br J Clin Pharmacol 2008; 66: 529–538. [DOI] [PMC free article] [PubMed] [Google Scholar]
- 69. Rey E, Delaunay L, Pons G, Murat I, Richard MO, Saint‐Maurice C, et al. Pharmacokinetics of midazolam in children: comparative study of intranasal and intravenous administration. Eur J Clin Pharmacol 1991; 41: 355–357. [DOI] [PubMed] [Google Scholar]
- 70. Payne K, Mattheyse FJ, Liebenberg D, Dawes T. The pharmacokinetics of midazolam in paediatric patients. Eur J Clin Pharmacol 1989; 37: 267–272. [DOI] [PubMed] [Google Scholar]
- 71. Salonen M, Kanto J, Iisalo E, Himberg JJ. Midazolam as an induction agent in children: a pharmacokinetic and clinical study. Anesth Analg 1987; 66: 625–628. [PubMed] [Google Scholar]
- 72. Tolia V, Brennan S, Aravind MK, Kauffman RE. Pharmacokinetic and pharmacodynamic study of midazolam in children during esophagogastroduodenoscopy. J Pediatr 1991; 119: 467–471. [DOI] [PubMed] [Google Scholar]
- 73. Mandema JW, Tuk B, van Steveninck AL, Breimer DD, Cohen AF, Danhof M. Pharmacokinetic‐pharmacodynamic modeling of the central nervous system effects of midazolam and its main metabolite alpha‐hydroxymidazolam in healthy volunteers. Clin Pharmacol Ther 1992; 51: 715–728. [DOI] [PubMed] [Google Scholar]
- 74. Olkkola KT, Ahonen J, Neuvonen PJ. The effects of the systemic antimycotics, itraconazole and fluconazole, on the pharmacokinetics and pharmacodynamics of intravenous and oral midazolam. Anesth Analg 1996; 82: 511–516. [DOI] [PubMed] [Google Scholar]
- 75. Wermeling DP, Record KA, Kelly TH, Archer SM, Clinch T, Rudy AC. Pharmacokinetics and pharmacodynamics of a new intranasal midazolam formulation in healthy volunteers. Anesth Analg 2006; 103: 344. [DOI] [PubMed] [Google Scholar]
- 76. Shord SS, Chan LN, Camp JR, Vasquez EM, Jeong HY, Molokie RE, et al. Effects of oral clotrimazole troches on the pharmacokinetics of oral and intravenous midazolam. Br J Clin Pharmacol 2010; 69: 160–166. [DOI] [PMC free article] [PubMed] [Google Scholar]
- 77. Breimer LT, Hennis PJ, Burm AG, Danhof M, Bovill JG, Spierdijk J, et al. Quantification of the EEG effect of midazolam by aperiodic analysis in volunteers. Pharmacokinetic/pharmacodynamic modelling. Clin Pharmacokinet 1990; 18: 245–253. [DOI] [PubMed] [Google Scholar]
- 78. Heizmann P, Eckert M, Ziegler WH. Pharmacokinetics and bioavailability of midazolam in man. Br J Clin Pharmacol 1983; 16 (Suppl 1): 43S–49S. [DOI] [PMC free article] [PubMed] [Google Scholar]
- 79. Wong SL, Goldberg MR, Ballow CH, Kitt MM, Barriere SL. Effect of Telavancin on the pharmacokinetics of the cytochrome P450 3A probe substrate midazolam: a randomized, double‐blind, crossover study in healthy subjects. Pharmacotherapy 2010; 30: 136–143. [DOI] [PubMed] [Google Scholar]
- 80. Schwagmeier R, Alincic S, Striebel HW. Midazolam pharmacokinetics following intravenous and buccal administration. Br J Clin Pharmacol 1998; 46: 203–206. [DOI] [PMC free article] [PubMed] [Google Scholar]
- 81. Albrecht S, Ihmsen H, Hering W, Geisslinger G, Dingemanse J, Schwilden H, et al. The effect of age on the pharmacokinetics and pharmacodynamics of midazolam. Clin Pharmacol Ther 1999; 65: 630–639. [DOI] [PubMed] [Google Scholar]
- 82. Clausen TG, Wolff J, Hansen PB, Larsen F, Rasmussen SN, Dixon JS, et al. Pharmacokinetics of midazolam and alpha‐hydroxy‐midazolam following rectal and intravenous administration. Br J Clin Pharmacol 1988; 25: 457–463. [DOI] [PMC free article] [PubMed] [Google Scholar]
- 83. van Gerven JM, Roncari G, Schoemaker RC, Massarella J, Keesmaat P, Kooyman H, et al. Integrated pharmacokinetics and pharmacodynamics of Ro 48‐8684, a new benzodiazepine, in comparison with midazolam during first administration to healthy male subjects. Br J Clin Pharmacol 1997; 44: 487–493. [DOI] [PMC free article] [PubMed] [Google Scholar]
- 84. Greenblatt DJ, Abernethy DR, Locniskar A, Harmatz JS, Limjuco RA, Shader RI. Effect of age, gender, and obesity on midazolam kinetics. Anesthesiology 1984; 61: 27–35. [PubMed] [Google Scholar]
- 85. Balson KR, Morgan DJ, Richmond BH, McAlindon ME, Elliott SL, Yeomans ND. Pharmacokinetics of midazolam in Vietnamese subjects. J Gastroenterol Hepatol 1996; 11: 1177–1180. [DOI] [PubMed] [Google Scholar]
- 86. Hostler D, Zhou J, Tortorici MA, Bies RR, Rittenberger JC, Empey PE, et al. Mild hypothermia alters midazolam pharmacokinetics in normal healthy volunteers. Drug Metab Dispos 2010; 38: 781–788. [DOI] [PMC free article] [PubMed] [Google Scholar]
- 87. Platten HP, Schweizer E, Dilger K, Mikus G, Klotz U. Pharmacokinetics and the pharmacodynamic action of midazolam in young and elderly patients undergoing tooth extraction. Clin Pharmacol Ther 1998; 63: 552–560. [DOI] [PubMed] [Google Scholar]
- 88. Bancke LL, Dworak HA, Rodvold KA, Halvorsen MB, Gidal BE. Pharmacokinetics, pharmacodynamics, and safety of USL261, a midazolam formulation optimized for intranasal delivery, in a randomized study with healthy volunteers. Epilepsia 2015; 56: 1723–1731. [DOI] [PubMed] [Google Scholar]
- 89. Garg V, Chandorkar G, Farmer HF, Smith F, Alves K, van Heeswijk RP. Effect of telaprevir on the pharmacokinetics of midazolam and digoxin. J Clin Pharmacol 2012; 52: 1566–1573. [DOI] [PubMed] [Google Scholar]
- 90. Crevat‐Pisano P, Dragna S, Granthil C, Coassolo P, Cano JP, Francois G. Plasma concentrations and pharmacokinetics of midazolam during anaesthesia. J Pharm Pharmacol 1986; 38: 578–582. [DOI] [PubMed] [Google Scholar]
- 91. Patel IH, Soni PP, Fukuda EK, Smith DF, Leier CV, Boudoulas H. The pharmacokinetics of midazolam in patients with congestive heart failure. Br J Clin Pharmacol 1990; 29: 565–569. [DOI] [PMC free article] [PubMed] [Google Scholar]
- 92. Bjorkman S, Rigemar G, Idvall J. Pharmacokinetics of midazolam given as an intranasal spray to adult surgical patients. Br J Anaesth 1997; 79: 575–580. [DOI] [PubMed] [Google Scholar]
- 93. Persson P, Nilsson A, Hartvig P, Tamsen A. Pharmacokinetics of midazolam in total i.v. anaesthesia. Br J Anaesth 1987; 59: 548–556. [DOI] [PubMed] [Google Scholar]
- 94. Malacrida R, Fritz ME, Suter PM, Crevoisier C. Pharmacokinetics of midazolam administered by continuous intravenous infusion to intensive care patients. Crit Care Med 1992; 20: 1123–1126. [DOI] [PubMed] [Google Scholar]
- 95. Bolon M, Bastien O, Flamens C, Paulus S, Salord F, Boulieu R. Evaluation of the estimation of midazolam concentrations and pharmacokinetic parameters in intensive care patients using a Bayesian pharmacokinetic software (PKS) according to sparse sampling approach. J Pharm Pharmacol 2003; 55: 765–771. [DOI] [PubMed] [Google Scholar]
- 96. Barr J, Zomorodi K, Bertaccini EJ, Shafer SL, Geller E. A double‐blind, randomized comparison of i.v. lorazepam versus midazolam for sedation of ICU patients via a pharmacologic model. Anesthesiology 2001; 95: 286–298. [DOI] [PubMed] [Google Scholar]
- 97. Zomorodi K, Donner A, Somma J, Barr J, Sladen R, Ramsay J, et al. Population pharmacokinetics of midazolam administered by target controlled infusion for sedation following coronary artery bypass grafting. Anesthesiology 1998; 89: 1418–1429. [DOI] [PubMed] [Google Scholar]
- 98. Smith MT, Heazlewood V, Eadie MJ, Brophy TO, Tyrer JH. Pharmacokinetics of midazolam in the aged. Eur J Clin Pharmacol 1984; 26: 381–388. [DOI] [PubMed] [Google Scholar]
- 99. Bjorkman S, Wada DR, Berling BM, Benoni G. Prediction of the disposition of midazolam in surgical patients by a physiologically based pharmacokinetic model. J Pharm Sci 2001; 90: 1226–1241. [DOI] [PubMed] [Google Scholar]
- 100. Kanto J, Aaltonen L, Himberg JJ, Hovi‐Viander M. Midazolam as an intravenous induction agent in the elderly: a clinical and pharmacokinetic study. Anesth Analg 1986; 65: 15–20. [PubMed] [Google Scholar]
- 101. Kelman AW, Thomson AH, Whiting B, Bryson SM, Steedman DA, Mawer GE, et al. Estimation of gentamicin clearance and volume of distribution in neonates and young children. Br J Clin Pharmacol 1984; 18: 685–692. [DOI] [PMC free article] [PubMed] [Google Scholar]
- 102. Uijtendaal EV, Rademaker CM, Schobben AF, Fleer A, Kramer WL, van Vught AJ, et al. Once‐daily versus multiple‐daily gentamicin in infants and children. Ther Drug Monit 2001; 23: 506–513. [DOI] [PubMed] [Google Scholar]
- 103. de Wildt SN, de Hoog M, Vinks AA, van der Giesen E, van den Anker JN. Population pharmacokinetics and metabolism of midazolam in pediatric intensive care patients. Crit Care Med 2003; 31: 1952–1958. [DOI] [PubMed] [Google Scholar]
- 104. Nahara MC, McMorrow J, Jones PR, Anglin D, Rosenberg R. Pharmacokinetics of midazolam in critically ill pediatric patients. Eur J Drug Metab Pharmacokinet 2000; 25: 219–221. [DOI] [PubMed] [Google Scholar]
- 105. Rosario MC, Thomson AH, Jodrell DI, Sharp CA, Elliott HL. Population pharmacokinetics of gentamicin in patients with cancer. Br J Clin Pharmacol 1998; 46: 229–236. [DOI] [PMC free article] [PubMed] [Google Scholar]
- 106. Xuan D, Nicolau DP, Nightingale CH. Population pharmacokinetics of gentamicin in hospitalized patients receiving once‐daily dosing. Int J Antimicrob Agents 2004; 23: 291–295. [DOI] [PubMed] [Google Scholar]
- 107. Kirkpatrick CM, Duffull SB, Begg EJ. Pharmacokinetics of gentamicin in 957 patients with varying renal function dosed once daily. Br J Clin Pharmacol 1999; 47: 637–643. [DOI] [PMC free article] [PubMed] [Google Scholar]
- 108. Plajer SM, Chin PK, Vella‐Brincat JW, Buffery PJ, Begg EJ. Gentamicin and renal function: lessons from 15 years' experience of a pharmacokinetic service for extended interval dosing of gentamicin. Ther Drug Monit 2015; 37: 98–103. [DOI] [PubMed] [Google Scholar]
- 109. Foissac F, Bouazza N, Valade E, De Sousa Mendes M, Fauchet F, Benaboud S, et al. Prediction of drug clearance in children. J Clin Pharmacol 2015; 55: 739–747. [DOI] [PubMed] [Google Scholar]
- 110. Holford NH, Ma SC, Anderson BJ. Prediction of morphine dose in humans. Paediatr Anaesth 2012; 22: 209–222. [DOI] [PubMed] [Google Scholar]
- 111. Kimland E, Odlind V. Off‐label drug use in pediatric patients. Clin Pharmacol Ther 2012; 91: 796–801. [DOI] [PubMed] [Google Scholar]
- 112. Bellis JR, Kirkham JJ, Nunn AJ, Pirmohamed M. Adverse drug reactions and off‐label and unlicensed medicines in children: a prospective cohort study of unplanned admissions to a paediatric hospital. Br J Clin Pharmacol 2014; 77: 545–553. [DOI] [PMC free article] [PubMed] [Google Scholar]
- 113. Conroy S. Association between licence status and medication errors. Arch Dis Child 2011; 96: 305–306. [DOI] [PubMed] [Google Scholar]
- 114. Cuzzolin L, Atzei A, Fanos V. Off‐label and unlicensed prescribing for newborns and children in different settings: a review of the literature and a consideration about drug safety. Expert Opin Drug Saf 2006; 5: 703–718. [DOI] [PubMed] [Google Scholar]
- 115. Standing JF, Nika A, Tsagris V, Kapetanakis I, Maltezou HC, Kafetzis DA, et al. Oseltamivir pharmacokinetics and clinical experience in neonates and infants during an outbreak of H1N1 influenza A virus infection in a neonatal intensive care unit. Antimicrob Agents Chemother 2012; 56: 3833–3840. [DOI] [PMC free article] [PubMed] [Google Scholar]
- 116. Ince I, de Wildt SN, Wang C, Peeters MY, Burggraaf J, Jacqz‐Aigrain E, et al. A novel maturation function for clearance of the cytochrome P450 3A substrate midazolam from preterm neonates to adults. Clin Pharmacokinet 2013; 52: 555–565. [DOI] [PubMed] [Google Scholar]
- 117. Germovsek E, Kent A, Metsvaht T, Lutsar I, Klein N, Turner MA, et al. Development and evaluation of a gentamicin pharmacokinetic model that facilitates opportunistic gentamicin therapeutic drug monitoring in neonates and infants. Antimicrobial agents and chemotherapy 2016; AAC–00577. doi: 10.1128/AAC.00577-16. [DOI] [PMC free article] [PubMed] [Google Scholar]
- 118. McLeay SC, Morrish GA, Kirkpatrick CM, Green B. The relationship between drug clearance and body size: systematic review and meta‐analysis of the literature published from 2000 to 2007. Clin Pharmacokinet 2012; 51: 319–330. [DOI] [PubMed] [Google Scholar]
- 119. De Cock RF, Allegaert K, Schreuder MF, Sherwin CM, de Hoog M, van den Anker JN, et al. Maturation of the glomerular filtration rate in neonates, as reflected by amikacin clearance. Clin Pharmacokinet 2012; 51: 105–117. [DOI] [PubMed] [Google Scholar]
- 120. Anderson BJ, Allegaert K, Van den Anker JN, Cossey V, Holford NH. Vancomycin pharmacokinetics in preterm neonates and the prediction of adult clearance. Br J Clin Pharmacol 2007; 63: 75–84. [DOI] [PMC free article] [PubMed] [Google Scholar]
- 121. Kimura T, Sunakawa K, Matsuura N, Kubo H, Shimada S, Yago K. Population pharmacokinetics of arbekacin, vancomycin, and panipenem in neonates. Antimicrob Agents Chemother 2004; 48: 1159–1167. [DOI] [PMC free article] [PubMed] [Google Scholar]
- 122. Robbie GJ, Zhao L, Mondick J, Losonsky G, Roskos LK. Population pharmacokinetics of palivizumab, a humanized anti‐respiratory syncytial virus monoclonal antibody, in adults and children. Antimicrob Agents Chemother 2012; 56: 4927–4936. [DOI] [PMC free article] [PubMed] [Google Scholar]
- 123. Savic RM, Cowan MJ, Dvorak CC, Pai SY, Pereira L, Bartelink IH, et al. Effect of weight and maturation on busulfan clearance in infants and small children undergoing hematopoietic cell transplantation. Biol Blood Marrow Transplant 2013; 19: 1608–1614. [DOI] [PMC free article] [PubMed] [Google Scholar]
- 124. Wang C, Peeters MY, Allegaert K, Blusse van Oud‐Alblas HJ, Krekels EH, Tibboel D, et al. A bodyweight‐dependent allometric exponent for scaling clearance across the human life‐span. Pharm Res 2012; 29: 1570–1581. [DOI] [PMC free article] [PubMed] [Google Scholar]
- 125. Ding J, Wang Y, Lin W, Wang C, Zhao L, Li X, et al. A population pharmacokinetic model of valproic acid in pediatric patients with epilepsy: a non‐linear pharmacokinetic model based on protein‐binding saturation. Clin Pharmacokinet 2015; 54: 305–317. [DOI] [PubMed] [Google Scholar]
Associated Data
This section collects any data citations, data availability statements, or supplementary materials included in this article.
Supplementary Materials
Table S1 Gentamicin clearance and covariate values used for modelling
Table S2 Midazolam clearance and covariate values used for modelling
Supporting info item