

Abstract
Freezing to a tone following auditory fear conditioning is commonly considered as a measure of the strength of the tone-shock association. The decrease in freezing on repeated nonreinforced tone presentation following conditioning, in turn, is attributed to the formation of an inhibitory association between tone and shock that leads to a suppression of the expression of fear. This study challenges these concepts for auditory fear conditioning in mice. We show that acquisition of conditioned fear by a few tone-shock pairings is accompanied by a nonassociative sensitization process. As a consequence, the freezing response of conditioned mice seems to be determined by both associative and nonassociative memory components. Our data suggest that the intensity of freezing as a function of footshock intensity is primarily determined by the nonassociative component, whereas the associative component is more or less categorical. We next demonstrate that the decrease in freezing on repeated nonreinforced tone presentation following conditioning shows fundamental properties of habituation. Thus, it might be regarded as a habituation-like process, which abolishes the influence of sensitization on the freezing response to the tone without affecting the expression of the associative memory component. Taken together, this study merges the dual-process theory of habituation with the concept of classical fear conditioning and demonstrates that sensitization and habituation as two nonassociative learning processes may critically determine the expression of conditioned fear in mice.
Our current knowledge about the relationship between emotions and learning is largely based on studies using fear conditioning. Fear conditioning has emerged as a leading paradigm to investigate fear memory and its extinction on the behavioral, cellular, and molecular level. Many conclusions drawn from fear-conditioning experiments rely on its associative nature, as fear conditioning is generally regarded as a typical example of classical Pavlovian conditioning (Blair et al. 2001; Maren 2001; Schafe et al. 2001). In classical conditioning, the subject learns about the relationship between two stimuli, an unconditioned stimulus (US), which produces a strong, consistent, overt unconditioned response, and a conditioned stimulus (CS), which on itself produces either no overt response or a weak response usually unrelated to the response that eventually will be learned. In the case of auditory fear conditioning, a tone (CS) is paired with a mild electric footshock (US). After conditioning, presentation of the tone alone elicits a fear reaction, which is measured, for instance, as freezing duration or potentiation of startle response (Davis 2000). Without additional shocks, the fear reaction to the tone decreases on repeated stimulus presentation (extinction). It is generally accepted that this process represents a form of new learning, whereby a second, inhibitory association between CS and US will be formed that suppresses the original fear reaction (for reviews, see Falls 1998; Myers and Davis 2002).
To us, today's view that expression and extinction of conditioned fear are based on associative memory processes appears to be too shortsighted. Decades ago, authors already proposed that the fear response following fear conditioning and extinction training might be partially affected by nonassociative memory components (Harris 1943; Mackintosh 1974, and references therein). On the one hand, very intensive or harmful stimuli (such as the US) may increase the general responsiveness of the organism even to harmless stimuli (such as the CS) independently from CS-US contingencies, a process called sensitization or pseudoconditioning. On the other hand, extinction of conditioned fear seems to include aspects of habituation (Harris 1943; McSweeney and Swindell 2002). Habituation describes the decrease in responsiveness to a certain stimulus when this stimulus is presented repeatedly or for a prolonged time (Thompson and Spencer 1966). According to the dual-process theory of habituation posted by Groves and Thompson (1970), every encounter of a given stimulus activates two independent processes, habituation in the stimulus-response circuit and sensitization in a general state system. In a recent critical survey of the literature, McSweeney and Swindell (2002) applied this concept to extinction; in their habituation hypothesis of extinction, they state that common processes contribute to extinction and habituation. They demonstrate that behavior undergoing extinction shares numerous fundamental properties with habituation (criteria modified from Thompson and Spencer 1966).
Despite these general arguments for a contribution of nonassociative memory processes to expression and extinction of conditioned fear, it is still uncertain whether these processes play a significant role in fear conditioning in mice. With one to three pairings of a tone with a footshock of intermediate intensity, conventional conditioning protocols for mice appear far less aversive than those reported for sensitization or other nonassociative changes in behavioral performance (for reviews, see Korte and de Boer 2003; Wiedenmayer 2004). Therefore, the present study sought to investigate the impact of sensitization and habituation on expression and extinction of conditioned fear exemplarily in C57BL/6JOlaHsd mice.
The study splits into two parts. The first part characterized the contribution of sensitization to the freezing response of conditioned mice. The second part assessed the extent to which habituation may account for the decrease in freezing on repeated nonreinforced tone presentation to conditioned mice. We refer to procedures with tone-shock pairings as conditioning procedures and with shock-presentation only as sensitization procedures. The term sensitization describes the general increase in responsiveness to potentially harmful stimuli following sensitization procedures. Accordingly, we call mice that underwent sensitization procedures sensitized mice and mice that underwent conditioning procedures conditioned mice. The freezing response of naive (i.e., nonshocked) mice to a tone is called unconditioned freezing. We termed tones that were presented to naive mice CS0, those presented to sensitized mice Csn, and those presented to conditioned mice CS+. The experimental procedures are schematically summarized in the first panel of the figures. Table 1 displays the symbols and abbreviations used in those schemes.
Table 1.
Symbols and codes used for description of the experimental procedures
Symbols used for description of the contexts are explained in Table 2.

To study the contribution of sensitization to the freezing response of conditioned mice, we first integrated different innate and acquired components that may affect the freezing response to a tone into a general scheme (Fig. 1). According to this scenario, auditory fear conditioning leads to the formation of an associative memory of the tone-footshock contiguity. At the same time, animals might form an association between the footshock and the conditioning context (contextual memory) that could be generalized to a test context (context generalization) (Fanselow 1980; Richardson 2000). On the other hand, the footshock applied during the conditioning procedure may unspecifically sensitize the animals (i.e., lead to the formation of nonassociative memory components), resulting in a general increase in responsiveness to potentially harmful stimuli. Importantly, the influence of sensitization on freezing to the tone would become evident for those CS only, which have the general capacity to reflexly elicit freezing. Therefore, we first demonstrated that the tone has the general capacity to elicit a freezing response in naive mice, and that this response might be potentiated by footshocks as a function of footshock intensity, independently of whether or not the footshocks have been paired with the tone (Experiment 1). To rule out the possibility that this potentiating effect of footshocks simply relates to context generalization, we studied (1) how different footshock intensities affected freezing to the test context without tone presentation (baseline) and during tone presentation (Experiments 1 and 4), and (2) how pre-exposure to the tone or test context before sensitization procedures, conditioning procedures and (re-)exposure to the tone, respectively, affects the subsequent freezing response to the tone (Experiments 4 and 6). In addition, (3) we minimized the contribution of handling to context generalization (Experiments 4 and 6). Finally, (4) we studied the consequences of a single footshock on general changes in animals' emotionality in an environment that was completely different from the conditioning chamber. For this purpose, we compared the behavioral performance of conditioned and sensitized mice in a light-dark test (Experiment 2). We introduced calculations aimed at dissecting the contribution of associative and nonassociative learning processes to the freezing response to the tone of conditioned mice (Experiment 1).
Figure 1.

Neural circuits determining freezing to a tone following auditory fear conditioning. There are at least three different neural pathways, which may influence freezing to the tone. Firstly, a tone may reflexly elicit freezing via a direct pathway as a function of the stimulus intensity (unconditioned freezing). Secondly, presentation of a tone together with the footshock eventually leads to the formation of associative memories about the tone-footshock and the conditioning context-footshock contiguity (excitatory associative memory components, eAC). Subsequent tone presentation activates the eAC, and thus triggers a freezing response independently of direct tone effects on freezing. Noteworthy, generalization of the conditioning context to the test context might also influence the freezing response to the tone. Thirdly, an aversive encounter (e.g., electric footshock) leads to an activation of nonassociative memory components (NAC; sensitization). Subsequent nonreinforced tone presentation potentiates the unconditioned response to the tone via this pathway. Note that the NAC affect the processing of various stimuli in an unspecific manner.
The second part of the study characterized the contribution of nonassociative memory processes to extinction of conditioned fear. To this end, we compiled different associative and nonassociative memory processes, which may generally account for the decrease in freezing to a tone following its repeated nonreinforced presentation (Fig. 2). First, repeated nonreinforced tone presentation may lead to the formation of an inhibitory associative memory component (Falls 1998; Myers and Davis 2002), which predicts that the tone will not be followed by the punishment anymore and suppresses the expression of the excitatory associative memory (inhibition/masking; Fig. 2A). Second, activation of the excitatory associative memory component may turn it into a labile state, thus leading to reconsolidation (Sara 2000; Nader 2003; Fig. 2B). This process could involve undoing the acquired ability to reconstruct a certain spatiotemporal neuronal state without undoing the connections that have created this acquired state (i.e., deconsolidation/depotentiation) (Dudai 2004). Third, molecular and cellular processes responsible for sensitization might be reversed (desensitization) or might decay with the passage of time (decay) (Fig. 2C). As a consequence, mice should show a general relaxation that is stimulus unspecific. Fourth, habituation processes in the direct tone-freezing pathway may lead to reduced freezing (Fig. 2D). Under these circumstances, the decrease in freezing has to be stimulus specific, as the nonassociative memory components remain activated, but fail to still influence unconditioned freezing to the tone.
Figure 2.

Principles of extinction. The decreased expression of conditioned fear on a second nonreinforced tone presentation to conditioned mice might be attributed to at least four fundamentally different processes that are illustrated by means of the scheme of Figure 1. The thickness of the lines indicates the activity status of a given pathway. (A) Tone presentation after conditioning predicts the occurrence of the footshock. In absence of the expected punishment, conditioned mice eventually form an inhibitory association between tone and shock (iAC). Subsequent tone presentations trigger the iAC to inhibit the expression of excitatory associative memory components (eAC) that had been formed during fear conditioning (cf. Fig. 1). (B) Nonreinforced tone presentations might render the eAC labile again (reconsolidation). As a consequence, the original eAC might not be appropriately retrieved in the future. Under these circumstances, the freezing response to the tone would be determined primarily by nonassociative memory components formed during fear conditioning (NAC; sensitization; cf. Fig. 1). (C) A nonreinforced tone presentation reverses the modifications in the NAC (desensitization). After desensitization, the freezing response to a second nonreinforced tone presentation would be primarily determined by the eAC. Desensitization does not necessarily require tone presentation, but might also be triggered by other stimuli, or even occur spontaneously with the passage of time (decay). The consequences of desensitization are not specific for the freezing response to the tone, but affect also the processing of other stimuli. (D) Habituation in the direct pathway abolishes the potentiating influence of the NAC in a stimulus-specific manner. As a consequence, the freezing response on a second nonreinforced tone presentation is primarily determined by the eAC. Note that the NAC is still activated and might influence the behavioral response to other stimuli. It is likely that the four processes interact at multiple levels and determine extinction of conditioned fear in parallel, depending on the species, strain, and protocols.
As stated before, this study largely focused on the potential role of the nonassociative memory processes in extinction of conditioned fear. Therefore, we first ruled out that the decrease in freezing on repeated nonreinforced tone presentation simply relates to decay (Experiment 4) or active reversal of sensitization (i.e., desensitization; Experiment 5). We next confirmed that extinction of conditioned fear shares fundamental properties with habituation processes (Thompson and Spencer 1966; McSweeney and Swindell 2002). Most of the criteria used for the characterization of extinction as the formation of an inhibitory associative memory (i.e., spontaneous recovery, context specificity, reinstatement, renewal) (Myers and Davis 2002), apply also for habituation processes (Groves and Thompson 1970; McSweeney and Swindell 2002). To demonstrate that habituation plays a role in extinction of the freezing response to the tone also in conditioned mice, we focused on those criteria, which can be explained best by habituation (Fig. 2D) rather than by inhibition/masking (Fig. 2A). In this context, we studied (1) whether freezing declines as a negative exponential function of the length of the tone exposure (short-term habituation, Experiment 1), (2) whether habituation without responding does exist, and (3) whether extinction is similar in conditioned and sensitized mice (i.e., independent of an excitatory associative memory component).
Our data provide evidence that the intensity of the freezing response of mice to a tone following auditory fear conditioning with a few tone-shock pairings is critically determined by sensitization rather than by the strength of the tone-shock association. The decline in freezing on repeated nonreinforced tone presentation, in contrast, apparently involves habituation-like processes.
Results
Experiment 1: Freezing to a tone in naive, sensitized, and conditioned mice
Experiment 1 assessed the reflexive nature of freezing to a tone by exposing naive mice to tones of different intensity. Next, potentiation of this freezing response by a footshock (sensitization) was measured in other groups of mice as a function of footshock intensity. The behavior of sensitized mice was compared with that of conditioned mice in order to estimate the contribution of nonassociative memory components to the expression of conditioned fear.
As a representative example for all experimental groups, we plotted the ethograms of the freezing responses of naive mice, of mice conditioned with a single 0.70-mA shock, and of mice sensitized with a single 0.70-mA shock before (baseline) and during presentation of an 80-dB tone at day 1 (Fig. 3A). The freezing response of the animals was scattered (Fig. 3A) and characterized by bouts of activity (typically associated with a redirection of the head) (K. Kamprath and C.T. Wotjak, unpubl.). To quantify the differences in freezing between the groups, we first analyzed the total freezing response shown during the entire 3-min observation periods before and during tone presentation (Fig. 3B). A two-way ANOVA (Group, Tone presentation) for repeated measures (Tone presentation) revealed significant effects of the two main factors (Group: F(2,27) = 18.2, P < 0.0001; Tone presentation: F(1,27) = 34.5, P < 0.0001) as well as a significant factor interaction (F(2,27) = 23.5, P < 0.0001). Subsequent analysis of group differences by one-way ANOVA, performed separately for baseline and tone presentation, revealed a significantly increased baseline freezing of sensitized mice compared to naive animals (F(2,27) = 7.2, P = 0.003; CSn > CS0, P = 0.002, Newman-Keuls post-hoc test). During tone presentation, conditioned mice showed significantly more freezing than naive and sensitized animals (F(2,27) = 21.1, P < 0.0001; CS+ > CSn and CS0, P < 0.001, Newman-Keuls). Upon first glance, visual inspection of the ethograms suggests group differences between CS+ and CSn during baseline as well as between CSn and CS0 during tone presentation. However, statistical analyses of the data failed to reach significance. Therefore, we decided to analyze the data in shorter observation intervals, which allow us to detect differences in dynamic changes of the freezing response between the three experimental groups. We selected 20 sec as duration of the observation intervals, because this analysis interval corresponds with the duration of tone presentation during conditioning. Using this procedure, separate analyses of baseline and tone freezing by two-way ANOVA (Group, Interval) for repeated measures (Interval) revealed a significant factor interaction both during baseline (F(16,216) = 4.1, P < 0.0001) and during tone presentation (F(16,216) = 16.7, P < 0.0001; Fig. 3C). Post-hoc analyses demonstrated significant differences between sensitized versus naive and conditioned mice during the first minute in test context 1. During the subsequent tone presentation, conditioned mice showed significantly more freezing than sensitized and naive mice. Moreover, sensitized mice showed significantly more freezing during the first 40 sec of tone presentation than naive animals.
Figure 3.

Analysis of freezing behavior. (A) Mice were randomly assigned to three groups. One group remained nonshocked (naive mice). Two groups received a 0.70-mA footshock of 2-sec duration in the conditioning chamber at d0, either in combination with a 20-sec tone (conditioning procedure) or without tone presentation (sensitization procedure). At day 1, all mice were exposed to a 3-min tone (80 dB) in test context 1 (cf. Table 2). Tone presentation was preceded by a 3-min baseline period. The tone was designated CS0 for naive, CS+ for conditioned, and CSn for sensitized mice (cf. Table 1). Freezing before (pre-CS, Baseline) and during tone presentation (CS, Tone) was scored throughout the entire test session by typing preset keys on a computer keyboard. Periods of freezing are indicated for each individual subject (n = 10 per group; one subject per row) by black bars (ethogram). The length of the horizontal bars depicts the duration of a given freezing episode. Freezing was interrupted by bouts of activity. Some animals failed to show freezing at all. For statistical purposes, the individual freezing responses have been analyzed (B) as the sum of freezing shown over the entire 180 sec before and during tone presentation, respectively, and (C) in 20-sec intervals (corresponding to the length of CS+ at d0). Apparently, analysis in 20-sec intervals provides more information about the time course of the freezing response. For description of symbols and codes, see Tables 1 and 2. Mean ± SEM. Statistics for B: (*) P < 0.05, (***) P < 0.001 (paired t-test). Statistics for C: (*) P < 0.05, (***) P < 0.001 vs. the two other groups; + P < 0.05 vs. CS0 (2-way ANOVA for repeated measures, performed separately for baseline and for tone presentation, followed by Newman-Keuls post-hoc test).
We next studied the effects of tone intensity on the freezing response of naive mice (Fig. 4B). As expected, there were no differences in basal freezing between the three groups of naive mice (Group: F(2,27) = 0.44, P = 0.650; Group × Interval: F(16,216) = 0.52, P = 0.934). During the subsequent tone presentation, however, groups differed significantly (Group: F(2,27) = 22.8, P < 0.0001; Group × Interval: F(16,216) = 17.6, P < 0.0001). Post-hoc analyses revealed that increasing the tone intensity from 80 to 95 dB or 98 dB caused an increased freezing during the first 40 sec of tone presentation.
Figure 4.

Freezing to a tone in naive, sensitized, and conditioned mice. (A) Mice were randomly assigned to 11 groups (n = 10, each). Three groups of naive mice were exposed to 3-min tones of different intensity in test context 1. Four groups were sensitized in the conditioning chamber with 1 or 3 footshocks of different intensities (0.40, 0.55, or 0.70 mA). Four groups were conditioned with 1 or 3 tone-shock pairings in the conditioning chamber with shock intensities of 0.40, 0.55, or 0.70 mA. Group codes indicate shock intensity (first part) and number of shocks (second part). All sensitized and conditioned mice were exposed to a 3-min tone (80 dB) in test context 1 at day 1. Freezing of (B) naive, (C) sensitized, and (D) conditioned mice was analyzed in 20-sec intervals during the 3-min baseline period preceding tone presentation (open symbols) and during the 3-min tone presentation (filled symbols) and normalized to the analysis interval. Mice sensitized with three 0.55-mA shocks (0.55-3) or a single 0.70 mA shock (0.70-1) showed a similar freezing response to the tone, resulting in overlapping curves. The groups (1) naive mice with an 80-dB tone, and (2) sensitized, or (3) conditioned mice with a single 0.70-mA shock (0.70-1) are the same as in Figure 3. For description of symbols and codes, see Tables 1 and 2. Mean ± SEM. (°°) P < 0.01; (°°°) P < 0.001 vs. 95 dB; (a) P < 0.001 vs. the two other groups; (b) P < 0.05 vs. 98 dB; (*) P < 0.05 vs. all other groups; (+) P < 0.05 vs. 0.55-3 and 0.70-1 (2-way ANOVA for repeated measures, performed separately for baseline and for tone presentation, followed by Newman-Keuls post-hoc test).
Analysis of the influence of the shock intensity on the freezing response of sensitized mice (Fig. 4C) revealed no significant differences in baseline freezing (Group: F(3,36) = 1.1, P = 0.356; Group × Interval: F(24,288) = 1.4, P = 0.119), but during tone presentation (Group: F(3,36) = 7.1, P < 0.001; Group × Interval: F (24,288) = 3.5, P < 0.0001). Animals submitted to the strongest sensitization protocol (three 0.70-mA shocks; 0.70-3) showed more freezing than all other groups, whereas animals submitted to the weakest protocol (three 0.40-mA shocks; 0.40-3) showed the lowest freezing response.
Analysis of the influence of the shock intensity on the freezing response of conditioned mice (Fig. 4D) revealed no significant differences in baseline freezing (Group: F(3,36) = 0.3, P = 0.790; Group × Interval: F(24,288) = 0.6, P = 0.941), but during tone presentation (Group: F(3,36) = 6.6, P = 0.001) with no significant Group × Interval interaction (F(24,288) = 0.7, P = 0.828). Post-hoc analysis demonstrated that animals with the strongest conditioning protocol (three 0.70-mA shocks; 0.70-3) showed more freezing than all other groups (P < 0.05 vs. 0.70-1, P < 0.01 vs. 0.55-3 and 0.40-3).
As revealed by three-way ANOVA (CS, Protocol, Interval) for repeated measures (Interval) for all shock protocols freezing to the tone was significantly more pronounced in conditioned mice than in mice of the respective sensitization group (CS: F(1,72) = 57.5, P < 0.0001; CS × Protocol: F3,576 = 2.5, P = 0.068).
For all groups (i.e., naive, sensitized, and conditioned mice), the freezing response to the tone decreased toward the end of tone presentation (Interval: F(8,216) = 83.5 for CS0, F(8,288) = 94.0 for Csn, and F(8,288) = 117.5 for CS+, P < 0.0001, each). To assess possible differences in the decrement of freezing at day 1, individual data were fitted with a single-exponential decay function (Fig. 5), as recommended for analysis of habituation processes (Petrinovich and Widaman 1984). Except for naive animals exposed to the 80 dB tone (data not shown), and a few animals of the other groups (0-1 animal per group), curve fitting was significant for all mice (Fig. 5A,B,C; r2 > 0.94 for averaged data of each group).
Figure 5.

Freezing shows a single-exponential decay over the course of a 3-min tone presentation at day 1. Data of Figure 4 were fitted with the single-exponential decay function F(t) = F0 * e-τt, with F(t) representing the actual freezing response at a given time point t, F0 representing the initial freezing response and τ representing the decay constant. (A) Curve fitting for the freezing responses to tones of either 95 or 98 dB (CS0) measured in naive mice. Freezing responses to an 80-dB tone could not be fitted with the decay function. (B) Curve fittings for the freezing responses to an 80-dB tone (CSn) measured in sensitized mice. (C) Curve fittings for the freezing responses to a 80-dB tone (CS+) measured in conditioned mice. The freezing response showed the steepest decay during the first minute of tone presentation (gray area), reaching asymptotic levels toward the end of tone presentation. (D) The initial freezing response F0 and (E) the decay constant τ were calculated separately for each individual animal and averaged per group (mean ± SEM). Sensitization and conditioning groups with the same number [US(n)] and intensity [US(mA)] of the footshocks are plotted adjacently. A small number of animals had to be excluded from analysis, as the individual curve fitting failed to reach statistical significance. Therefore, the resulting sample sizes were 9 or 10 of 10 per group. (#) P < 0.01 vs. all other groups (ANOVA followed by Newman-Keuls post-hoc test); (**) P < 0.01 (Student's t-test).
Successful curve fitting allowed us to assess the (theoretical) initial freezing response F0 and the decay constant τ for each experimental subject. Comparison of F0 for all experimental groups by one-way ANOVA revealed a significant group difference (F(9,96) = 2.1, P = 0.042; Fig. 5D), which related to a significantly smaller F0 in mice sensitized with the weakest shock protocol (three 0.40-mA shocks). All other groups had a similar F0 of ∼100%. Comparison of τ, in contrast, revealed a highly significant group difference (F(9,96) = 8.6, P < 0.0001; Fig. 5E), related to significant differences between conditioned and sensitized mice (CS: F(1,75) = 28.6, P < 0.0001) and to the shock intensity during conditioning (F(3,36) = 6.6, P = 0.001; 0.70-3 vs. 0.40-3, P < 0.001; 0.70-3 vs. 0.55-3 and 0.70-1, P < 0.05) and sensitization procedures (F(3,36) = 3.3, P = 0.033), respectively. Together, curve fitting with a single-exponential decay function indicates that, except for the weakest sensitization protocol, acute adaptation to the tone is based on similar mechanisms with similar initial freezing responses, but differences in the decay of freezing. Furthermore, curve fitting reveals that the decrement of freezing has the steepest slope within the first 60 sec of tone presentation, reaching asymptotic levels with ongoing tone presentation. Thus, in support of our analysis of the ethograms shown in Figure 3, the first 60 sec of tone presentation contain most of the relevant information about an animal's freezing response.
If one compares the freezing responses of the conditioned and sensitized mice during the first 60 sec of tone presentation, a two-way ANOVA (Procedure, Shock Intensity) reveals general differences in the amount of freezing related to Procedure (F(1,72) = 121.3, P < 0.0001) and Shock Intensity (F(3,72) = 16.7, P < 0.0001). However, there was no significant factor interaction (F(3,72) = 0.8, P = 0.515), indicating that the shock intensity influences freezing to the tone in conditioned and sensitized mice in a similar manner (Fig. 6A).
Figure 6.

Nonassociative, rather than associative memory components define the intensity of freezing to the tone following conditioning. (A) Freezing response during the first 60 sec of tone presentation at day 1 (mean ± SEM), measured in the same sensitized (CSn) and conditioned mice (CS+) as shown in Figures 4 and 5. Sensitization and conditioning groups, respectively, differed by the number [US(n)] and intensity [US(mA)] of the footshocks. Conditioned mice: (a) P < 0.001 vs. 0.40-3, P < 0.01 vs. 0.55-3, and P < 0.05 vs. 0.70-1; (b) P < 0.05 vs. 0.40-3 and 0.70-3. Sensitized mice: (c) P < 0.001 vs. all other groups (ANOVA followed by Newman-Keuls post-hoc test). (B) Using the data set shown in A, the mean freezing response of the respective sensitization group was subtracted from each individual freezing value of conditioned (open symbols) and sensitized mice (filled symbols). Thus, mean freezing responses of sensitization groups are set at zero (dotted line). Individual data with box plots indicate that the group differences between the conditioning groups seen in A disappear after this calculation. (C) Model for the interrelation between fear memory and intensity of the conditioning procedure. On the basis of the results of A and B, we propose that fear memory consists mainly of two summative components, an associative [association between tone and shock, (ac)] and a nonassociative component [sensitization due to the footshock, (nac)]. Values calculated under B suggest that conditioning with 1-3 tone-shock pairings leads to the formation of a categorical memory about the tone-shock association. The intensity of the footshock, in contrast, is predominantly encoded by sensitization.
If the shock alone modulates the animals' freezing to the tone, this nonassociative learning process may also occur during conditioning, as we observe a similar modulation in conditioned mice. Thus, the freezing response following conditioning may be composed of memory of the tone-shock association and a nonassociative sensitization memory component coding for the shock intensity. We isolated the freezing response, which relates to the associative memory component, by subtracting from each conditioned mouse the mean freezing response of the respective sensitization group. After this calculation, differences between the conditioning groups seen at day 1 (F(3,36) = 8.0, P < 0.001; Fig. 6A) disappeared (F(3,36) = 1.1, P = 0.341; Fig. 6B), leaving an associative memory component independent from the shock intensity. Information about the shock intensity seems to be stored by the nonassociative memory component (i.e., by sensitization; Fig. 6C).
Experiment 2: Effects of conditioning and sensitization procedures on behavioral performance in the light-dark test
Experiment 2 addressed the question as to whether or not sensitization and conditioning procedures have similar consequences on the fear response measured in a completely novel test situation with light as the dominant aversive stimulus. To this end, naive, conditioned, and sensitized mice were tested in a light-dark avoidance task (Fig. 7A). Detailed analysis of the behavioral parameters in 3-min intervals by two-way ANOVA (Group, Interval) for repeated measures (Interval) revealed significant differences between naive, conditioned, and sensitized mice in horizontal locomotion (Group: F(2,33) = 30.0, P < 0.0001; Group × Interval: F(18,297) = 2.6, P < 0.001; Fig. 7B), rearings (Group: F(2,33) = 26.8, P < 0.0001; Group × Interval: F(18,297) = 1.6, P = 0.067; Fig. 7C) and resting time (Group: F(2,33) = 14.7, P < 0.0001; Group × Interval: F(18,297) = 1.2, P = 0.240; Fig. 7D). There were no significant differences between the three groups in the relative time spent in the dark compartment (Group: F(2,33) = 2.9, P = 0.066; Group × Interval: F(18,297) = 0.9, P = 0.596; Fig. 7E) and the relative distance traveled in the dark compartment (Group: F(2,33) = 1.4, P = 0.258; Group × Interval: F(18,297) = 0.7, P = 0.822; Fig. 7F). Post-hoc analyses revealed that significant group differences always related to differences between naive animals versus conditioned and sensitized animals, with no differences between the latter two. This observation indicates that in conditioned mice, the shock not only mediates associative memory of the tone-shock pairing, but also affects the fear response in a nonassociative manner, similar to sensitized mice.
Figure 7.

Altered behavioral performance in a light-dark avoidance task following conditioning and sensitization procedures. (A) Mice were randomly assigned to three groups. At d0, all animals were placed into the conditioning chamber. Two groups received a single 0.70-mA footshock with (conditioning procedure) or without tone presentation (sensitization procedure). The third group did not receive a shock in the conditioning chamber. All animals were placed into test context 1 for 7 min without any tone presentation at d1, and into a light-dark avoidance box for 30 min at d7. The light-dark box was located in a different room and consisted of a light and a dark compartment of similar dimensions that were connected by a doorway. Several behavioral parameters were automatically recorded over the course of the 30-min light-dark test and analyzed in 3-min intervals. These behavioral parameters included (B) horizontal locomotion, (C) vertical exploration (rearings), (D) resting time (normalized to the observation period), (E) relative time spent in the dark compartment (normalized to the observation period), and (F) relative distance moved in the dark (normalized to the total horizontal locomotion shown in the respective observation period). For description of symbols and codes see Tables 1 and 2. Mean ± SEM. (n = 12 per group). (***) P < 0.001 nonshocked mice vs. the two other groups (2-way ANOVA for repeated measures, followed by Newman-Keuls post-hoc test).
Our failure to detect significant differences in the two parameters time in dark and distance in dark likely relates to the high variability in the behavioral performance of conditioned and sensitized mice. Therefore, we additionally analyzed the consequences of sensitization and conditioning procedures on the adaptation to the light separately per group by one-way ANOVAs for repeated measures (Interval). Naive mice adapted to the light over the course of the 30-min exposure (Time in Dark: F(9,99) = 6.1, P < 0.0001; Distance in Dark: F(9,99) = 5.5, P < 0.0001) to finally reach chance levels that indicate that the mice equally explored the lit and the dark compartment (Fig. 7E,F). In contrast, neither sensitized (Time in Dark: F(9,99) = 1.4, P = 0.187; Distance in Dark: F(9,99) = 1.1, P = 0.366), nor conditioned mice (Time in Dark: F(9,99) = 0.7, P = 0.729; Distance in Dark: F(9,99) = 0.6, P = 0.824) showed a similar adaptation to the light (Fig. 7E,F).
Experiment 3: Freezing of sensitized and conditioned mice on repeated tone presentation
Experiment 3 studied long-term changes in the freezing response to a tone. Conditioned and sensitized mice of Experiment 1 were exposed to the 3-min tone for a second time 6 d after the first tone presentation (Fig. 8A). As revealed by a three-way ANOVA (Protocol, Interval, Day) for repeated measures (Interval, Day), conditioned mice showed a general decrease in freezing from day 1 to day 7 (Day: F(1,36) = 74.5, P < 0.0001; Fig. 8B) and a significant factor interaction (F(3,36) = 9.3, P < 0.0001), indicating that the group differences relating to different conditioning protocols at day 1 (Experiment 1; Fig. 8B, d1) disappeared at day 7 (Fig. 8B, d7). This conclusion was verified by a two-way ANOVA (Protocol, Interval) for repeated measures (Interval) which failed to reveal a significant effect of Protocol (F(3,36) = 1.0, P = 0.403) or a significant factor interaction (F(24,288) = 1.5, P = 0.078) for day 7. Sensitized mice also showed a decrease in freezing at day 7 compared with day 1 (Day: F(1,36) = 34.2, P < 0.0001; Fig. 8C). Again, there was a significant factor interaction (F(3,36) = 9.3, P < 0.0001), relating to the disappearance of the group differences from day 1 (Experiment 1; Fig. 8C, d1) at day 7 (Protocol: F(3,36) = 1.5, P = 0.221; Protocol × Interval: F(24,288) = 0.7, P = 0.865; Fig. 8C, d7).
Figure 8.

Freezing of sensitized and conditioned mice on repeated tone presentation. (A) The same conditioned and sensitized mice shown in Figure 4 were exposed to the 3-min tone (80 dB) in test context 1 (cf. Table 2) for a second time, 6 d after the first exposure (d7). Conditioning and sensitization groups, respectively, differed in the number and intensity of the footshocks. Group codes indicate shock intensity (first part) and number of shocks (second part). (B) Conditioned mice showed a reduction in their freezing response to a tone (CS+) from d1 to d7. The significant group differences seen at d1 disappeared at d7. (C) Also, sensitized mice showed a reduction in their freezing response to a tone (CSn) from d1 to d7. Again, the significant group differences seen at d1 disappeared at d7. (D) Spontaneous recovery expressed as difference between the freezing value of the first 20-sec interval of tone presentation at day 7 and the freezing value of the last 20-sec interval of tone presentation at day 1. Conditioned mice showed, in general, more spontaneous recovery than sensitized mice. The intensity of the aversive encounter, however, had no influence on spontaneous recovery either in sensitized or in conditioned mice. Mean ± SEM. Freezing was analyzed in 20-sec bins and normalized to the length of the analysis interval. Freezing data at d1 are identical to those of Figure 4C,D. For description of symbols and codes see Tables 1 and 2.
Conditioned mice showed, in general, more spontaneous recovery of their freezing response from day 1 to day 7 than sensitized mice (CS: F(1,72) = 52.2, P < 0.0001), independent of the conditioning and sensitization protocols [Protocol: F(3,72) = 1.1, P = 0.373; CS × Protocol: F(3,72) = 0.1, P = 0.979; 2-way ANOVA (CS, Protocol); Fig. 8D]. One-way ANOVAs confirmed that spontaneous recovery was similar for all sensitized (F(3,36) = 1.0, P = 0.418), and conditioned mice (F(3,36) = 0.4, P = 0.777), respectively (Fig. 8D).
Experiment 4: Temporal decay of sensitization and context-dependency of extinction
In the first experimental series (Fig. 9A), repeated tone presentation to sensitized mice resulted in a significantly decreased freezing response to the tone at day 7 compared with day 1 [Day: F(1,8) = 18.1, P = 0.003; Day × Interval: F(8,64) = 9.0, P < 0.0001; 2-way ANOVA (Day, Interval) for repeated measures (Day, Interval); Fig. 9B]. To exclude the possibility that this decrease in freezing from day 1 to day 7 simply relates to temporal decay of sensitization, a second group of mice had remained undisturbed in their home cages after the sensitization procedure, and had been exposed to the tone for the first time at day 7. Mice of this group showed a more pronounced freezing response to the tone than animals of the first group did at day 1 (Group: F(1,16) = 4.6, P = 0.048; Group × Interval: F(8,128) = 1.2, P = 0.317) and, in particular, at day 7 [Group: F(1,16) = 18.7, P = 0.0005; Group × Interval: F(8,128) = 4.3, P = 0.0001; 2-way ANOVA (Group, Interval) for repeated measures (Interval); Fig. 9B]. These data indicate that the decrease in freezing to the tone from day 1 to day 7 requires tone presentation at day 1, and cannot simply be ascribed to decay processes.
Figure 9.

Reduced freezing to the tone at day 7 requires prior tone presentation and does not depend on the extinction context. (A) In the first experimental series, naive mice were sensitized with a single 0.70-mA footshock in the conditioning chamber (d0). The next day (d1), mice were assigned to three groups (n = 9, each). The first group was subsequently exposed to a 3-min tone (80 dB) in test context 1, the second group remained undisturbed in their home cages, and the third group was placed into test context 1, but without tone presentation. Six days later (d7), all mice were exposed to a 3-min tone in test context 1. (B) Freezing response to the tones and to the respective silent periods shown by the mice of the first experimental series. Note that at d1, mice of the first group froze significantly more to the tone than mice of the third group to the test context. Moreover, the freezing response to the tone was independent of the familiarity with the test context and handling procedure, as mice of the third group showed essentially the same freezing to the tone at d7 as mice of the second group. (C) In the second experimental series, mice were frequently handled prior to the experiment. At d0, all mice were sensitized with three 0.70-mA footshocks in the conditioning chamber. The next day (d1), mice were assigned to two groups (n = 11-12) and placed into test context 1. Only one of the two groups was exposed to a 3-min tone (80 dB). Six days later (d7), both groups were placed into test context 2 and exposed to the 3-min tone. (D) Freezing response to the tones and to the respective silent periods shown by the mice of the second experimental series. Extensive handling before sensitization caused a general decrease in freezing to the tone (cf. Fig. 8C, group 0.70-3), but did not abolish the sensitization effects seen in the first experimental series (Fig. 9B). The decrease in freezing to the tone from d1 to d7 appeared to be unaffected by the test context. Data were analyzed in 20-sec bins and normalized to the length of the analysis interval. For description of symbols and codes, see Tables 1 and 2. Mean ± SEM. (*) P < 0.05; (**) P < 0.01; (***) P < 0.001 vs. the other group (2-way ANOVA for repeated measures, followed by Newman-Keuls post-hoc test).
To assess the contribution of context generalization to the freezing response to the tone, a third group of mice was familiarized with the test context at day 1 without tone presentation and exposed to the tone in the same test context at day 7. At day 1, mice without tone presentation in the test context froze significantly less than mice with tone presentation (Group: F(1,16) = 24.7, P = 0.0001; Group × Interval: F(8,128) = 11.8, P < 0.0001; Fig. 9B). Exposure to the test context without tone presentation failed to affect freezing to the tone at day 7, as the animals of this group froze at similarly high levels as mice that had remained undisturbed in their home cages after the sensitization procedure (Group: F(1,16) = 0.0, P = 0.953; Group × Interval: F(8,128) = 0.7, P = 0.648; Fig. 9B), indicating that familiarization with the test context had no influence on the freezing response to the tone.
In the second experimental series (Fig. 9C), we investigated whether experimental handling during the sensitization procedure might have contributed to context generalization and thus, to the subsequently potentiated freezing response to the tone. Freezing to the tone was less pronounced at day 1 in handled mice than in naive mice that underwent the same strong sensitization procedure (Experiment 1, group 0.70-3) or in naive mice that underwent a weaker sensitization procedure (Experiment 1, group 0.70-1; Experiment 4, first experimental series; Fig. 9D; statistics not shown). Despite this general decrease in the intensity of freezing, statistical analyses otherwise revealed essentially the same results as reported for the first experimental series, namely, that mice froze significantly more to the 3-min tone at day 1 than mice of the other group to the test context in absence of tone presentation (Group: F(1,21) = 11.9, P = 0.002; Group × Interval: F(8,168) = 4.3, P < 0.0001; Fig. 9D, d1). These data are consistent with the idea that handling caused a decrease in the susceptibility to sensitization.
We next studied the context dependency of the decrease in freezing on repeated tone presentation. Re-exposure to the tone in test context 2 (Table 2) led to a decrease in freezing at day 7 compared with day 1 (Day: F(1,11) = 11.2, P = 0.007; Day × Interval: F(8,88) = 2.2, P = 0.089), indicating that the decrease in freezing was independent of the extinction context. At day 7, mice without exposure to the tone at day 1 showed significantly more freezing than mice with pre-exposure to the tone (Group × Interval: F(8,168) = 2.7, P = 0.008; Fig. 9D, d7). The freezing response to the tone shown in test context 2 at day 7 by mice without pre-exposure to the tone was comparable to that shown by animals of the other group in test context 1 at day 1 [Group: F(1,21) = 0.0, P = 0.988; Group × Interval: F(8,168) = 0.5, P = 0.871; 2-way ANOVA (Group, Interval) for repeated measures (Interval)], indicating that neither the test context nor the passage of time affected freezing to the tone.
Table 2.
Detailed description of the three different contexts used in the experiments
Particular care was taken to adjust their dimensions in order to ensure comparable sound pressure levels.

Experiment 5: Stimulus specificity of the adaptive changes to the tone
As the low freezing response to the tone at day 7 required prior exposure to the tone and did not simply develop over time (cf. Experiment 4), we wondered whether the reduced response is specific for auditory stimuli or due to a more general relaxation in a state system (desensitization). To this end, we compared the behavioral performance of naive, conditioned and sensitized mice with or without tone presentation at day 1 in a light-dark test at day 7 after the aversive encounter (Fig. 10A). For the sake of brevity and clarity, data were analyzed and presented for the entire 30-min exposure. Analysis in 3-min bins revealed essentially the same results (data and statistics not shown). In all cases, except for the relative time spent in the dark, behavioral and autonomous responses of naive mice differed significantly from that of the two conditioning and the two sensitization groups. Naive mice showed more horizontal locomotion (naive vs. conditioning groups: F(3,35) = 35.4, P < 0.0001; naive vs. sensitization groups: F(3,35) = 39.0, P < 0.0001; Fig. 10B) and rearings (naive vs. conditioning groups: F(3,35) = 26.0, P < 0.0001; naive vs. sensitization groups: F(3,35) = 29.5, P < 0.0001; Fig. 10C), less resting time (naive vs. conditioning groups: F(3,35) = 14.0, P = 0.005; naive vs. sensitization groups: F(3,35) = 22.5, P < 0.0001; Fig. 10D), less time in the dark (naive vs. conditioning groups: F(3,35) = 3.9, P = 0.030; but not naive vs. sensitization groups: F(3,35) = 1.2, P = 0.321; Fig. 10E) and less defecation (naive vs. conditioning groups: P = 0.007; naive vs. sensitization groups: P = 0.002; Kruskal-Wallis; Fig. 10F). Only in the case of rearings had there been a difference between conditioned mice with and without pre-exposure to the tone. In no other case, was the behavior of the animals in the light-dark task significantly affected by pre-exposure to the tone, indicating that the decrease in freezing on repeated tone presentation is largely stimulus specific.
Figure 10.

No effect of tone presentation following conditioning and sensitization procedures on behavioral performance in a light-dark avoidance task. (A) Mice were randomly assigned to five groups. At d0, all animals were placed into the conditioning chambers. One group did not receive a shock (group I). Four groups received a single 0.70-mA footshock either with (conditioning procedures, groups II and III) or without tone presentation (sensitization procedures, groups IV and V). The next day (d1), all groups were placed into test context 1 (cf. Table 2) either without (groups I, II, and IV) or with subsequent presentation of a 3-min tone (80dB, groups III and V). Note that groups I, II, and IV are identical to those shown in Figure 7. At d7, all groups were tested in the light-dark avoidance task for 30 min. Several behavioral and autonomic parameters were recorded over the course of the 30-min light-dark test, including (B) horizontal locomotion, (C) vertical exploration (rearing), (D) resting time (normalized to the observation period), (E) relative time spent in the dark compartment (normalized to the observation period), and (F) defecation. For description of symbols and codes, see Tables 1 and 2. Mean ± SEM. (n = 12 per group). (a) P < 0.001 vs. all other groups; (b) P < 0.01 vs. groups III and IV, P < 0.001 vs. groups II and V; (c) P < 0.05 vs. group II; (d) P < 0.01 vs. groups III, IV, and V; (*) P < 0.05 (A-E: ANOVA, performed separately for groups I+II+III and I+IV+V, followed by Newman-Keuls post-hoc test; F: Kruskal-Wallis test followed by Dunn's post-hoc test).
Experiment 6: Pre-exposure to the tone before sensitization and conditioning procedures
This experiment investigated whether exposure to a tone causes the same long-lasting decrease in freezing independently of whether or not it has been presented before or after conditioning and sensitization procedures, respectively. A two-way ANOVA (Day, Interval) for repeated measures (Day, Interval) revealed that repeated exposure of naive mice to a 98-dB tone caused a significant decrease in the freezing response at day 7 compared with day 1 (Day: F(1,9) = 9.8, P = 0.012; Day × Interval: F(8,72) = 9.9, P < 0.001; Fig. 11B), with clear evidence of spontaneous recovery (statistics not shown). Also, conditioned mice without pre-exposure to the tone showed a decrease in freezing on repeated nonreinforced tone presentation after conditioning (Day: F(1,9) = 56.0, P < 0.0001; Fig. 11C; animals are identical to group 0.70-1 of Experiment 1). Pre-exposure to an 80-dB tone before conditioning caused a significantly smaller freezing response to the same 80-dB tone at day 1 following conditioning, compared with conditioned mice without pre-exposure to that tone [Group: F(1,18) =5.7, P = 0.027; Fig. 11D; two-way ANOVA (Group × Interval) for repeated measures (Interval)]. Furthermore, the freezing response during the second exposure to the 3-min 80-dB tone was similar, no matter whether the first exposure to the same tone occurred before or after conditioning (Group: F(1,18) =0.0, P = 0.921; Fig. 11E). The effects of pre-exposure to the tone on freezing to an 80-dB tone at day 1 after conditioning were more pronounced if the pre-exposed tone had the same intermediate intensity as during conditioning and tone exposure at day 1 (80 vs. 98 dB; Group: F(1,18) =5.7, P = 0.027; Fig. 11F).
Figure 11.

Effects of tone presentation before conditioning on the freezing response to the tone. (A) Animals were randomly assigned to four groups. Naive mice of group I were repeatedly exposed to a 3-min tone of 98 dB in test context 1 at d1 and d7. Animals of group II were pre-exposed to the 3-min tone (80dB) in test context 1, followed by conditioning with a single 0.70-mA footshock at d0 and re-exposure to the 3-min tone the next day (d1). Mice of group III were exposed to the tone in test context 1 at d1 and d7 following conditioning. Mice of group IV were treated identically to group II, except for the tone intensity during tone pre-exposure at d-6 (95 dB instead of 80 dB). Note that group I is identical to group 98 dB of Figure 4B, group III with group 0.70-1 of Figure 4D, and group IV with group 95 dB of Figure 4B. (B) Reduced freezing to a loud tone on repeated tone presentation in naive mice (group I). (C) Reduced freezing to the tone on repeated tone presentation in conditioned mice (group III). (D) Pre-exposure to the tone led to a significantly reduced freezing response at d1 following conditioning (groups II and III). (E) The freezing response of group II at d1 was identical to that of group III at d7. (F) Pre-exposure to a loud tone had significantly less effects on freezing to the tone at d1 following conditioning than pre-exposure to a tone of the same intermediate intensity as used for conditioning and re-exposure to the tone at d1 (groups II and IV). For description of symbols and codes, see Tables 1 and 2. Data were analyzed in 20-sec bins and normalized to the length of the analysis interval. Mean ± SEM. (n = 10 per group). (*) P < 0.05; (***) P < 0.001 vs. the other group (2-way ANOVA for repeated measures, followed by Newman-Keuls post-hoc test).
In the second part of Experiment 6, we confirmed the results of tone pre-exposure on conditioned freezing and extended our study by analyzing the effects of tone pre-exposure on sensitization. This time, all mice were placed into test context 1 with or without tone presentation 5 d before conditioning and sensitization procedures, respectively (Fig. 12A). Both conditioned (Group: F(1,18) = 5.2, P = 0.034; Group × Interval: F(8,144) = 6.4, P < 0.0001; Fig. 12C) and sensitized mice (Group: F(1,18) = 21.5, P = 0.0002; Group × Interval: F(8,144) = 5.3, P < 0.0001; Fig. 12B) with tone pre-exposure showed significantly less freezing to the tone at day 1 than mice without tone pre-exposure. These group differences disappeared at day 7 (Figs 12B,C; statistics not shown). As in the first part of Experiment 6 (Fig. 11E), mice again showed a similar freezing response during the second exposure to the 3-min tone, irrespective of whether the tone had been presented for the first time before or after conditioning (Group: F(1,18) = 0.0, P = 0.980; Group × Interval: F(8,144) = 1.3, P = 0.246; Fig. 12D). The same was the case for sensitized mice (Group: F(1,18) = 2.6, P = 0.127; Group × Interval: F(8,144) = 0.8, P = 0.647; Fig. 12D).
Figure 12.

Effects of tone presentation before sensitization and conditioning procedures on the freezing response to the tone. (A) Animals were randomly assigned to four groups. All mice were placed into test context 1 (cf. Table 2) at d-5. Two groups of mice were subsequently exposed to a 3-min tone (80 dB); the two other groups remained in the test context without tone presentation. Five days later (d0), one group with and one group without pre-exposure to the tone were sensitized with a single footshock (0.70 mA, 2 sec). The two other groups were conditioned with a single tone-shock association. All mice were exposed to 3-min tones (80 dB) in test context 1 at d1 and d7 and in test context 2 at d8 following sensitization and conditioning procedures, respectively. (B) Pre-exposure to the tone led to a significantly reduced freezing response at d1 following sensitization procedures (groups I and II). Both group I and group II showed virtually no freezing to the tone at d7. (C) Pre-exposure to the tone led to a significantly reduced freezing response at d1 following conditioning (groups III and IV). These group differences disappeared at d7. (D) The freezing response of group I at d7 was similar to that of group II at d1. The same was the case for the freezing response of group III at d7 and group IV at d1. (E) Freezing response to the tone at d1, d7, and d8. In all groups, freezing decreased from d1 to d7 and d8. Only in the case of group II, tone presentation in the unfamiliar test context 2 at d8 led to an increase in freezing compared with d7. (F) Defecation score (number of feces) counted at the end of the respective test trial. Freezing data were analyzed in 20-sec bins (B,C,D) or for the total 180-sec tone presentation (E) and normalized to the length of the respective analysis interval. For description of symbols and codes, see Tables 1 and 2. Mean ± SEM. (n = 10 per group). (*) P < 0.05; (**) P < 0.01; (***) P < 0.001 vs. the other group (1-way or 2-way ANOVA for repeated measures, followed by Newman-Keuls post-hoc test).
Long-term changes in the freezing response to the tone were assessed separately per group by one-way ANOVAs for repeated measures (Day). For the sake of brevity, we present data and statistical analysis of the total freezing response shown during the 3-min tone presentation. Analysis of the data in 20-sec bins revealed essentially the same results (statistics not shown). All groups of mice showed a decrease of freezing over the course of repeated tone presentation from day 1 to day 7 and, in most cases, also to day 8 (sensitized mice without pre-exposure to the tone: F(2,29) = 13.6, P = 0.0003; sensitized mice with pre-exposure to the tone: F(2,29) = 5.6, P = 0.013; conditioned mice without pre-exposure to the tone: F(2,29) = 29.9, P < 0.0001; conditioned mice with pre-exposure to the tone: F(2,29) = 5.7, P = 0.012; Fig. 12E). Changing of the test context failed to significantly influence the freezing response to the tone, as freezing shown in test context 2 at day 8 was similar to that shown in test context 1 the day before or even reduced, except for sensitized mice with pre-exposure to the tone (Fig. 12E). Importantly, mice of all groups showed an increased defecation in test context 2 at day 8 compared with test context 1 at day 7 [Context: F(1,36) = 22.7, P < 0.0001; three-way ANOVA (Pre-exposure × Shock protocol × Context) for repeated measures (Context); Fig. 12F]. This indicates that they recognized test context 2 as a novel environment and demonstrates the persistence of sensitization despite the decrease in freezing in response to the tone. Noteworthy, the effects of tone pre-exposure on freezing to the tone at day 1 were mirrored at the autonomic level, as tone pre-exposure led to less defecation (Pre-exposure: F(1,36) = 6.9, P = 0.012) independently of the shock protocol (Pre-exposure × Shock protocol: F(1,36) = 0.2, P = 0.622; two-way ANOVA; Fig. 12F).
Discussion
The present study was designed to assess the contribution of nonassociative learning processes to expression and extinction of conditioned fear in mice. We demonstrate that acquisition of conditioned fear is usually accompanied by a nonassociative sensitization process, which occurs in a general state system rather than in the stimulus-response pathway (Groves and Thompson 1970). Extinction, in contrast, shares many fundamental properties with the nonassociative habituation process (McSweeney and Swindell 2002), which occurs in a certain stimulus-response pathway.
In the context of the present study, sensitization describes the phenomenon that an aversive encounter (e.g., perception of a footshock) leads to a general potentiation of the responsiveness to sensory stimuli. This potentiation becomes evident for those stimuli, which have the general capacity to reflexly elicit fear. We could show that tones meet this criterion, as they are able to elicit freezing in naive mice. In line with this observation, Lamprea et al. (2002) demonstrated in naive rats that electric stimulation of the inferior colliculus, a central relay station of auditory inputs to thalamic and cortical structures, with currents of rising intensity, induces the whole spectrum of behavioral fear responses, including freezing. In our experiments, the freezing response of nonshocked mice to a loud tone was similar to that of shocked mice to a tone of intermediate volume, indicating that the footshock sensitized the animals to the tone.
This interpretation is not unequivocally accepted, as the potentiated freezing response does not necessarily relate to sensitization, but might result from context generalization as well (Fanselow 1980; Richardson 2000). In fact, the sensitization protocols used in the present study represent a form of foreground contextual conditioning, which might lead to a strong association between the shock and the context in which the shock was applied. If this contextual memory is generalized to the test context, the freezing response observed in sensitized mice would relate to the shock-context association and not to nonassociative sensitization. Conditioned mice, in contrast, underwent background contextual conditioning and might develop less contextual memory and context generalization, as the tone serves as a predictor of the punishment and reduces the attention paid toward the conditioning context (Rescorla and Wagner 1972). Accordingly, we observed that sensitized mice showed slightly more freezing in the test context before tone presentation than conditioned mice. Nevertheless, several arguments render it unlikely that context generalization represents a critical determinant of the freezing response to the tone in sensitized mice as follows. (1) To minimize the risk of context generalization, our test contexts differed considerably from the conditioning context in shape, material, bedding, and odor. As a consequence, mice were able to discriminate between the different test contexts (Experiment 6), as well as between the test contexts and the conditioning context (K. Kamprath and C.T. Wotjak, unpubl.). Furthermore, we excluded a significant contribution of experimental handling to context generalization (Experiment 4). (2) Sensitized mice froze significantly more to the tone than to the test context. This was the case, in particular, for sensitization procedures with lower shock intensities, which completely failed to elicit freezing to the test context, but caused a prominent freezing response to the tone (Experiment 1). (3) The differences in the intensity of the sensitization protocols were mirrored in the freezing response to the tone, but not to the test context. Noteworthy, sensitized mice froze differently to the tone, although they showed the same low levels of freezing during the 140 sec preceding tone presentation (Experiment 1). (4) Other than pre-exposure to the tone, pre-exposure to the test context before sensitization procedures had no effect on the freezing response to the tone after the aversive encounter (Experiment 6). Accordingly, exposure to the test context 1 after sensitization procedures also was not sufficient to reduce freezing to the tone presented in the same test context or in a novel test context 6 d later (Experiment 4). Importantly, animals with exposure to the test context at day 1 showed essentially the same pronounced freezing response at day 7 as mice that had remained undisturbed in their home cages. If the shock would have produced generalized context conditioning, exposure to the test context prior to the tone presentation would have been expected to reduce or eliminate the freezing to the tone. However, our data clearly demonstrate that familiarization with the test context (i.e., extinction of generalized contextual fear) failed to affect the freezing response to the tone. (5) Sensitized and conditioned mice showed the same alterations in their behavioral performance in a light-dark test that was performed in a completely different room and setup (Experiment 2). Taken together, our data do not preclude the existence of context generalization following sensitization procedures. However, they provide clear evidence that the freezing response to the tone following sensitization procedures was not critically influenced by context generalization, and can thus be regarded as a measure of nonassociative learning (i.e., sensitization).
The footshock might sensitize the animals, not only if administered alone, but also if presented together with a tone during conditioning. Consequently, the freezing response to the tone following conditioning might be determined not only by associative, but also by nonassociative memory components. To dissect the contribution of associative and nonassociative memory components, we assume that the freezing response following sensitization procedures represents the nonassociative component that is similar for conditioning and sensitization protocols using the same number and intensities of footshocks. This assumption is justified by the observation that conditioned mice showed the same behavioral alterations in the light-dark test as sensitized mice. The contribution of the nonassociative memory component to expression of conditioned fear can thus be estimated from the freezing response of sensitized mice. The associative component, in contrast, is not accessible to our measurements and has to be calculated. To this end, we neglect a possibly complex relationship between associative and nonassociative memory components and assume that a simple summation of associative and nonassociative memory components determines the freezing response of conditioned mice (Harris 1943). On the basis of this assumption, we calculated the associative memory component by subtracting the freezing response of sensitized mice (nonassociative component) from the freezing response of conditioned mice (sum of both components). Such calculations were only performed between those conditioning and sensitization groups that experienced the footshocks in the same number and intensity. After this calculation, the significant differences in freezing between mice that were conditioned with different shock intensities disappeared. This suggests that the intensity of the freezing response of conditioned mice was primarily determined by nonassociative memory components, whereas associative memory components were more or less categorical. This conclusion questions attempts to interpret shock intensity-dependent changes in freezing as a measure of the strength of the associative memory in fear conditioning experiments similar to those of the present study (Cordero and Sandi 1998; Cordero et al. 1998; Sapolsky 2003). Modifications in the strength of the associative memory might be achieved primarily via changing the contingency between CS and US (Harris 1943; Mackintosh 1974). Our data indicate that more than three tone-shock pairings are required in C57BL/6JOlaHsd mice to significantly strengthen the associative memory component. As fear-conditioning experiments in mice typically use very few tone-shock pairings (1-3), the relationship between contingency and strength of the associative memory is accessible easier in conditioning procedures, which require more intensive training, such as eyeblink conditioning.
The hypothesis that sensitization partially determines the fear response of conditioned animals dates back to the first half of the last century (e.g., Harris 1943, and references therein) and has been repeatedly brought into discussion since then (Mackintosh 1974; Richardson 2000). So far, however, long-lasting consequences of aversive encounters like sensitization have been described for severe stressors only, including social defeat or footshocks of high intensity or frequency (for review, see Stam et al. 2000; Korte and de Boer 2003; Wiedenmayer 2004). Footshocks of intermediate intensity, in contrast, caused only transient changes in fear-related behavior that were confined to a relatively narrow time window after the aversive incident (Boulis and Davis 1989; Davis 1989; Korte and de Boer 2003). To the best of our knowledge, this is the first report that sensitization due to a footshock of intermediate intensity (as commonly used in fear-conditioning experiments with mice) persists for at least 1 wk after the aversive encounter. We conclude that the animals adopted an allostatic state after the stressful experience (for review, see McEwen 2000; Korte and de Boer 2003) with sensitization representing one feature of the chronic deviation of regulatory systems from their normal homeostatic operating levels (allostatic load; McEwen 2000).
The data of the first part of the study lead to the two-component theory of fear conditioning (Fig. 13), which predicts that fear conditioning may cause the formation of both associative and nonassociative memories, which enable the animals to separately encode qualitative and quantitative information about an aversive encounter. We propose that associative memories enable the recognition of predictors of potentially harmful situations, whereas nonassociative memories determine the strength of the fear reaction, depending on the intensity of the aversive experience. The contribution of the nonassociative component to expression of conditioned fear might differ between different mouse strains, different species, and different conditioning procedures. As sensitization occurs in a state system rather than in a specific stimulus-response pathway (Groves and Thompson 1970), nonassociative memories put the animal on a general alert, which allows a flexible adjustment of conditioned and unconditioned defense reactions to the actual situation. It is tempting to speculate that the two components of fear memory are homolog to the two neural systems proposed for the expression of fear and anxiety (Davis 1998; Grillon 2002; Walker et al. 2003).
Figure 13.

The two-component theory of fear conditioning. (A) In naive mice, the tone reflexly elicits freezing via the direct pathway. In addition, tone presentation might transiently activate nonassociative memory components (NAC), which, in turn, potentiate tone processing via the direct pathway (dual process theory of habituation; Groves and Thompson 1970). (B) In sensitized mice, chronically activated NAC potentiate the unconditioned fear response to the tone. (C) The two-component theory of fear conditioning predicts that fear conditioning causes the formation of both associative (eAC) and nonassociative memories (NAC) that enable the animals to separately encode qualitative (0/1, eAC) and quantitative information (NAC) about an aversive encounter. Consequently, two components of the fear memory, the eAC and the NAC, determine expression of the freezing response in conditioned mice. The thickness of the lines indicates the activity status of a given pathway. For further details see legend to Figure 1.
The first part of this study characterized the role of the nonassociative sensitization process in expression of conditioned fear. The second part addressed the question of whether nonassociative processes also account for the development of the fear response over time, with respect to both acute adaptation to the tone and changes on repeated nonreinforced tone presentation. Acute adaptation to the tone was mediated by a decrease in the freezing reaction that followed a single exponential decay function. Such a negative exponential function resembled the exponential decay of behavior undergoing habituation (Petrinovich and Widaman 1984) and described the course of the freezing response of each experimental group very well, no matter which shock intensity or paradigm (conditioning, sensitization, freezing of naive animals to a loud tone) was used. This similarity suggests that the decrease in freezing relates to similar habituation-like processes, not only in naive and sensitized mice, but also in conditioned mice.
To interpret the decrease in freezing in conditioned mice on repeated nonreinforced tone presentation (i.e., extinction of conditioned fear), one has to recall that extinction might be explained by at least four different processes (Fig. 2). Although it is very likely that a mixture of all four options finally mediates the decrease in freezing on the second tone presentation, the present study attempted to dissect their contribution to extinction of conditioned fear. Alterations in the nonassociative memory component were studied exemplarily in sensitized mice. Tone presentation led to an almost complete extinction of the freezing response to a second tone presentation, irrespective of the differences in the intensity of sensitization. This decrease in freezing required prior tone presentation, and was thus not related to temporal decay of the nonassociative memory component. Tone presentation caused a decrease in freezing on a second tone exposure, but failed to affect the behavioral alterations in the light-dark test. Moreover, the decrease in freezing on repeated tone presentation persisted in a novel test context, although the animals still perceived this context as an unpleasant and potentially dangerous environment. These observations demonstrate the stimulus specificity of the decrease in freezing and rule out that exposure and acute adaptation to a potentially harmful stimulus (i.e., a tone) led to a general relaxation of the animals by desensitization (Fig. 2C).
The stimulus specificity of the decrease in freezing in sensitized mice might be explained by habituation-like processes in the direct pathway (Fig. 2D). The existence of habituation in this pathway was proven by measuring the freezing response of naive mice to repeated presentation of a loud tone. If habituation plays a role also in sensitized mice and habituation without responding (below baseline) exists (Groves and Thompson 1970), it should not matter to the freezing response to a second tone presentation whether the first tone presentation occurred before or after sensitization procedures. This was the case in the present study.
Long-term habituation may also contribute to the decrease in freezing on the second nonreinforced tone presentation in conditioned mice (McSweeney and Swindell 2002). This notion is supported by the similar freezing response to the second tone presentation in mice, which perceived the first tone before or after conditioning (below baseline habituation). The inverse relationship between habituation and stimulus intensity (Groves and Thompson 1970) would, furthermore, explain our observation that pre-exposure to a louder tone than used in the subsequent nonreinforced tone presentations was less effective than pre-exposure to a tone of the same intermediate intensity.
Habituation of the freezing response to the tone appears to be maximal after a single 3-min tone presentation (S. Neuweiler and C.T. Wotjak, unpubl.). As a consequence, nonassociative memory components cannot potentiate the freezing response to the tone anymore (Fig. 2D), and sensitized mice show little freezing on a second nonreinforced tone presentation. The influence of the associative memory components, in contrast, remains intact. The freezing response of conditioned mice shown at day 7 thus appears to be primarily determined by the associative memory components, with the consequence that conditioned mice still show a prominent freezing response to a second nonreinforced tone presentation. Therefore, conditioned mice displayed a greater spontaneous recovery of their freezing response from day 1 to day 7, compared with sensitized mice.
Several arguments render it unlikely that the formation of an inhibitory association between the tone and the shock (i.e., inhibition/masking; Fig. 2A) and/or reconsolidation of the associative memory component (Fig. 2B) played an important role in extinction of conditioned fear in the present study. First, the tone had the same consequences on extinction whether presented before or after conditioning. Second, a third nonreinforced tone presentation failed to cause a further decrease in freezing. Third, if the associative component encodes categorical information about fear conditioning, reconsolidation or inhibition of this component should also have categorical consequences. However, the freezing response to a second or third tone presentation was still prominent. Fourth, massed tone presentations were more effective than spaced tone presentations in generating short-term and long-term extinction of conditioned fear in a different study using a similar mouse strain (Cain et al. 2003). If the decrease in freezing would relate to the formation of an inhibitory association between tone and shock, one would have expected the opposite, namely, spaced tone presentations to be more effective than the massed protocols. If, however, the decrease in freezing is based on habituation processes, then protocols with shorter inter-trial intervals should be more effective (McSweeney and Swindell 2002), as habituation is faster for higher rates of stimulus presentation (Groves and Thompson 1970). In this context, the 3-min tone presentations used in our study might be regarded as extreme forms of massed tone presentation, which would explain the high efficacy of our extinction protocol. Interestingly, spaced tone presentations caused even a slight increase in freezing (Cain et al. 2003). This is in agreement with the competition between habituation and sensitization processes, proposed by the dual process theory of habituation (Groves and Thompson 1970). Our data do not preclude that the formation of an inhibitory association between the tone and the shock may contribute to extinction of conditioned fear in mice. However, they indicate that more intensive extinction protocols than used in the present study are required to initiate this process (e.g., Cain et al. 2003).
Taken together, data of the second part of our study demonstrate that the decrease in freezing on repeated tone presentation shows fundamental properties of a behavior undergoing habituation (Thompson and Spencer 1966; McSweeney and Swindell 2002), namely, an exponential decay, lasting changes, inverse relationship to stimulus intensity, stimulus specificity, and habituation without responding. Additional criteria, such as a direct relationship to stimulus frequency and a coactivation of habituation and sensitization processes during tone presentation, are met by the data of others (Cain et al. 2003). On the basis of these findings, we propose that the decrease in freezing in conditioned C57BL/6JOlaHsd mice primarily relates to a nonassociative learning process (i.e., habituation). Habituation leaves both the associative and the nonassociative memory components of the fear memory unaffected, but abolishes the influence of the nonassociative memory components on the freezing response to the tone (Fig. 2D). Consequently, the freezing response of conditioned mice to a second nonreinforced tone presentation appears to be primarily determined by associative memory components. Under these circumstances, the fact that mice, which underwent conditioning procedures of different intensities, showed a similar freezing response to a second nonreinforced tone supports our two-component theory of fear conditioning (Fig. 13), according to which the associative memory component is supposed to encode primarily categorical information about the conditioning event.
In light of the proposed role of classical conditioning and sensitization in the etiology of distinct psychiatric disorders (e.g., generalized anxiety disorder and post-traumatic stress disorder; Jacobs and Nadel 1985; Marks and Tobena 1990; Dykman et al. 1997; Rosen and Schulkin 1998; Stam et al. 2000; Öhman and Mineka 2001), future studies have to pay more attention to the development of reconsolidation and desensitization protocols in order to reveal novel therapeutic strategies that target the cause of the stress-related diseases (i.e., the associative and nonassociative memory components) instead of alleviating its consequences for certain situations only.
Conclusion
The present study demonstrates that nonassociative learning processes critically influence the freezing response to a tone following auditory fear conditioning in C57BL/6JOlaHsd mice. Whereas sensitization determines the intensity of freezing after conditioning procedures with a few tone-shock pairings, habituation-like processes seem to be responsible for the decrease in freezing on repeated tone presentations. Habituation does not provide a complete explanation of extinction, which is certainly determined by multiple processes (McSweeney and Swindell 2002; Myers and Davis 2002). However, our study describes an important role of sensitization and habituation for expression and extinction of conditioned fear in mice in situations with common conditioning and testing protocols. The generality of both the two-component theory of fear conditioning and the habituation hypothesis of extinction remains to be shown in other mouse strains and species (including humans) and for other conditioning and extinction protocols. However, a potential contribution of nonassociative learning processes to expression and extinction of aversive memories has generally to be considered for those CS, which are able to elicit an unconditioned fear response.
Materials and Methods
All experiments were approved by the Committee on Animal Health and Care of the local governmental body and performed in strict compliance with the EEC recommendations for the care and use of laboratory animals (86/609/CEE).
Animals
A total of 251 male C57BL/6JOlaHsd mice were purchased from Harlan Winkelmann Germany (Dutch breeding stock) at an age of 6-8 wk. After their arrival in the institute, animals were kept singly in standard Macrolon type II cages with sawdust bedding (Altromin Faser Einstreu, Altromin GmbH), tap water, and food ad libitum, at 22 ± 2°C room temperature and 55% ± 5% humidity, under an inverse 12 h:12 h light-dark cycle (lights off: 08:00 a.m.). Animals were transferred from the vivarium to the laboratory 1-2 d before the experiment during the light phase of their cycle. During experiments, animals were kept in the same behavioral laboratory in which they were conditioned and tested (except for the light-dark avoidance task), but behind a sound- and light-tight curtain.
Unconditioned freezing, conditioning procedures, and sensitization procedures
Setup
Three different contexts were used that differed considerably in material, shape, surface texture, bedding, and odor of the cleaning solutions (Table 2). Both conditioning and sensitization procedures were performed in mouse-conditioning chambers (ENV-307A, MED Associates) with house light (0.6 Lux, ENV-215M, MED Associates), elongated walls, and mouse-shock floor (grid harness package: ENV-407; Shocker/Scrambler: ENV-414, MED Associates). The conditioning context had a cubic shape with two metal walls and two Plexiglas walls, and a grid floor. Grid and walls were cleaned with 70% ethanol. For memory tests and unconditioned freezing, two neutral test contexts were used. Test context 1 consisted of a Plexiglas cylinder with sawdust as bedding. It was illuminated with a house light (0.3 Lux, ENV-215M, MED Associates) and cleaned with 1% acetic acid. Test context 2 had the shape of a hexagonal prism, with opaque side walls with rough surface, except for the back plane that was made of Plexiglas, and silica sand used as bedding. Test context 2 was illuminated with a stimulus light (12 Lux, ENV-221M, MED Associates) and cleaned with water containing isoamylacetate (1:2000; banana aroma) as a monomolecular odor.
All contexts were located in soundproof isolation cubicles (ENV-018M, MED Associates) that were additionally isolated with acoustic foam (Conrad Electronics). Tones were generated by audio stimulus generators (ANL-926, MED Associates) and applied by speakers (DTW 110 NG, Visaton) mounted to the ceiling of the isolation cubicle over the respective contexts, which were open at the top. Sound-pressure levels were checked by means of the SPL Measurement Package (ANL-929A-PC, MED Associates) at floor level. Similar dimensions ensured that sound-pressure levels were comparable for the three contexts. Small CCD cameras (Conrad Electronics) were mounted to the back plane of the isolation cubicles to enable behavioral observation. Experiments were controlled by commercial software (MED-PC for Windows v1.17) via interfaces (DIG 715) and the respective control panels (SG 215, all MED Associates). Two conditioning or four testing setups were used simultaneously.
Experimental procedure
For conditioning, mice were placed into the conditioning chamber, and the house light was switched on. Three minutes later, a 20-sec tone (80 dB, 9 kHz sine wave, 10-msec raising and falling time) was presented that coterminated with a scrambled electric footshock of 1 sec (in case of repeated conditioning) or 2-sec duration (in case of a single tone-shock association). In case of repeated conditioning, the conditioning procedure was repeated two times with inter-tone intervals of 110 and 140 sec. Animals were returned to their home cages 60 sec after the last footshock. For sensitization, mice were treated in the same manner as for conditioning, except that the tone presentation was omitted.
To measure the freezing response to the tone without confounding influences of contextual memory, conditioned, sensitized, and naive mice were tested in a neutral environment (test contexts 1 or 2; cf. Table 2). Mice were placed into the test context, and the house light was switched on. Three minutes later, a 3-min tone was presented (9 kHz; 80 dB, if not stated otherwise). Mice were returned to their home cages 60 sec after the end of tone presentation.
In a few cases, animals were placed into the conditioning chamber and test context 1, respectively, without tone and shock presentation for the same amount of time as the other experimental groups with tone presentation.
All behaviors of the mice in the experimental setup were videotaped for subsequent off-line behavioral analysis. In selected cases, the number of feces was counted in the end of the exposures. Contexts were cleaned thoroughly after each exposure, including changing the bedding.
Light-dark avoidance
Setup
The light-dark avoidance task was performed in a different room from the conditioning and sensitization experiments (different illumination and lab environment). Animals were tested in boxes (Coulbourn Instruments), which were divided into two equally sized compartments (L13 × W26 × H38 cm). The light compartment had three transparent Plexiglas walls and was illuminated with 700 Lux white light. The dark compartment was made of black plastic, not illuminated, and covered by a black roof. The two compartments were connected by a 7.5-cm × 7.5-cm doorway. Two infrared sensor rings (sensor spacing 1.52 cm) allowed the measurement of horizontal and vertical activity in the two compartments. Both sensor rings were connected via an interface to a computer equipped with the Tru Scan Software Vers. 99 (Coulbourn Instruments). The sampling rate was 4 Hz. Each box, including the sensor rings, was surrounded by an additional box made of opaque Plexiglas side walls (L47 × W47 × H38 cm) without roof and floor. Before and after the experiment, animals were separated from the setup by a light-tight curtain.
Experimental procedure
In the beginning of the experiment, mice were placed into the center of the dark compartment, and their three-dimensional movements were automatically recorded over the course of 30 min. At the end of the experiment, mice were returned to their home cages, defecation was scored by counting the number of feces in the test box, and test boxes were carefully cleaned with soap, followed by clear water.
Experiments
All experiments were performed during the activity phase of the animals between 09:30 and 17:00 h. Experiments were designed to minimize the number of animals tested. Animals of a given experiment depicted in the respective schematic drawings derived from the same batch and were tested simultaneously. Experiments had been performed over the course of 2 yr.
Experiment 1: Freezing to a tone in naive, sensitized, and conditioned mice
Mice were randomly assigned to 11 groups (n = 10, each; Fig. 4A). Three groups of naive mice were exposed to 3-min tones of different intensities (80, 95, or 98 dB) in test context 1 at day 1. Four groups were sensitized in the conditioning chamber with one (0.70 mA) or three footshocks of different intensities (0.40, 0.55, or 0.70 mA). Four groups were conditioned with one or three tone-shock pairings in the conditioning chamber similar to the sensitization procedure. All sensitized and conditioned mice were exposed to a 3-min tone (80 dB) in test context 1 at day 1. The number of the tone-footshock presentations, as well as the intensities of the footshocks, were chosen from the literature in order to cover most of the fear-conditioning procedures commonly used for studies in mice.
Experiment 2: Effects of conditioning and sensitization procedures on behavioral performance in the light-dark test
Mice were randomly assigned to three groups (n = 12, each; Fig. 7A). At day 0, all animals were placed into the conditioning chambers. Two groups received a single 0.70-mA footshock with (conditioning procedures) or without tone presentation (sensitization procedures). A third group received neither a tone nor a footshock in the conditioning context. The following day, all groups were placed in test context 1 for 7 min without tone presentation. Six days later, all groups were tested in a light-dark avoidance task, which was performed in another lab.
Experiment 3: Freezing of sensitized and conditioned mice on repeated tone presentation
The sensitized and conditioned mice of Experiment 1 were exposed to the 3-min tone in test context 1 for a second time, 6 d after the first tone presentation (Fig. 8A).
Experiment 4: Temporal decay of sensitization and context-dependency of extinction
Experiments were performed in two independent series. The first experimental series (Fig. 9A) studied (1) whether the decrease in freezing from day 1 to day 7 requires tone presentation at day 1 or results from temporal decay of sensitization, and (2) whether the freezing response to the tone is affected by the familiarity with the test context. To this end, naive mice were sensitized with a single 0.70-mA footshock in the conditioning chamber, and randomly assigned to three groups (n = 9, each). At the following day 1 (d1), mice of the first group were exposed to a 3-min tone in test context 1, mice of the second group remained undisturbed in their home cages and mice of the third group were exposed to the test context 1 without tone presentation. At day 7 (d7), all mice were exposed to a 3-min tone in test context 1.
The second experimental (Fig. 9C) series investigated (1) whether experimental handling is responsible for the freezing response to the tone, as it reminds the animals to the sensitization procedure and thus mediates context generalization, and (2) whether the decrease in freezing from day 1 to day 7 depends on the extinction context. To this end, mice were extensively handled (10 min per mouse and day for 4 d) before sensitization with three 0.70-mA footshocks in the conditioning chamber (d0). The next day (d1), mice were randomly assigned to two groups (n = 11-12 per group). Both groups of mice were placed into test context 1 at day 1(d1). However, only one group perceived a 3-min tone. At day 7 (d7), all mice were exposed to a 3-min tone in test context 2.
Experiment 5: Stimulus specificity of the adaptive changes to the tone
Mice were randomly assigned to five groups (n = 12, each; Fig. 10A). At day 0, all animals were placed into the conditioning chambers. Two groups received a single 0.70-mA footshock with (conditioning procedures) and two groups without tone presentation (sensitization procedures). One group received neither a tone nor a footshock in the conditioning context. The next day, all groups were placed in test context 1. One conditioning group and one sensitization group were subsequently exposed to a 3-min tone. Six days later, all groups were tested in a light-dark avoidance task that was performed in another lab. The three groups without tone presentation at day 1 are identical to those of Experiment 2.
Experiment 6: Pre-exposure to the tone before sensitization and conditioning procedures
In the first part of Experiment 6, animals were randomly assigned to four groups (n = 10, each; Fig. 11A). Naive mice of the first group were exposed to a 3-min tone of 98 dB in test context 1 at days 1 and 7. Animals of the second group were pre-exposed to the 3-min tone (80 dB) in test context 1, 6 d before conditioning with a single 0.70-mA footshock (day 0). They were again exposed to the 3-min tone in test context 1 at the following day (day 1). The third group was conditioned with a single footshock (0.70 mA, 2 sec) without pre-exposure to the tone, followed by exposure to the 3-min tone in test context 1, 1 and 7 d later. Mice of the fourth group were treated identically to those of the second group, except for the tone intensity during tone pre-exposure (95 dB instead of 80 dB). Part of the data of the groups was used for Experiments 1 and 3.
In the second part of Experiment 6, we analyzed the influence of tone pre-exposure on the freezing response to this tone, not only following conditioning procedures (as a confirmation of the findings of the first part of this experiment), but also following sensitization procedures. To this end, animals from a new batch of mice were randomly assigned to four groups (n = 10, each; Fig. 12A). All animals were placed into test context 1. Two groups of mice were subsequently exposed to a 3-min tone (9 kHz, 80 dB), the two other groups remained in the test context without tone presentation. Five days later, one group with and one group without pre-exposure to the tone were sensitized with a single footshock (0.70 mA, 2 sec). The two other groups were conditioned with a single tone (9 kHz, 80 dB)-shock (0.70 mA, 2 sec) association. All mice were repeatedly exposed to 3-min tones (9 kHz, 80 dB) in test context 1 at day 1 and 7 and in test context 2 at day 8 following sensitization and conditioning procedures, respectively.
Behavioral analysis
The natural repertoire of fear responses in mice includes various exploratory and defensive behaviors (Fanselow 1994; Blanchard et al. 1997; Gerlai 1998; Laxmi et al. 2003) that can be assigned to three different phases; firstly, a primarily exploratory phase during which the animals show increased vigilance and orientation toward the sound source (e.g., frequent rearings and risk assessment), secondly by a passive defensive phase (characterized by freezing), and thirdly, by an active defensive phase (characterized by panic-like flight responses such as jumping and digging in the bedding) (K. Kamprath and C.T. Wotjak, unpubl.). In our experiments, we focused on freezing as a measure of fear. This response is (1) most frequently used in studies with aversive classical conditioning, (2) relatively easy to quantify, and (3)—other than the first phase of fear responses—not induced in naive mice by the neutral conditioned stimulus of intermediate intensity. Freezing to the tone was scored off-line by two trained observers that were blind to the animals' treatment (intraand inter-rater reliability of behavioral scoring of a randomly chosen subset of animals; r2 < 0.8, P < 0.0001). Freezing was defined as the absence of all movements, except for those related to respiration. As an additional criterion, the head of the animals had to be in a plane position and not oriented toward the speaker. We scored every immobility phase that met these criteria, by pressing preset keys on a computer keyboard, using a customized freeware software (EVENTLOG; Robert Hendersen 1986). The resulting 1-channel ethogram was further processed by customized software (Winrat Vers. 2.31; Heinz Barthelmes, MPI Munich).
The three-dimensional tracks obtained during the light-dark avoidance task were analyzed off-line by means of customized macros implemented into Microsoft Excel in order to extract the following behavioral parameters: (1) horizontal locomotion (assessed from breakings of the infrared beams of the lower infrared sensor ring), (2) vertical exploration (i.e., rearings; assessed from breakings of the upper infrared sensor ring), (3) resting time (normalized to the observation period), (4) time spent in the dark compartment (normalized to the observation period), and (5) distance moved in the dark (normalized to the total horizontal locomotion assessed during the respective observation period).
Statistical analysis
Data analysis
Data were analyzed in distinct intervals (freezing: 20, 60, or 180 sec; light-dark: 3 or 30 min) as indicated in the text, and normalized to the respective time interval. Normalization was performed by expressing the duration of a certain behavior (freezing data and selected behavioral parameters of the light-dark avoidance task) as a percentage of the respective analysis interval. Criteria for the selection of the respective analysis intervals are discussed in the Results section (Experiment 1; cf. Figs. 3 and 5).
Differences in the freezing response between two groups may generally relate to one of two extreme cases. In the first case, animals of a group 1 may consistently freeze at a higher level than mice of a group 2. In the second case, mice of group 2 may show the same initial freezing response as mice of group 1, but an accelerated adaptation to the tone. To compare the acute adaptation to the tone of conditioned, sensitized, and unconditioned mice at day 1 (Experiment 1), we followed the advice of Petrinovich and Widaman (1984), and fitted the individual freezing data (20-sec intervals) with a single exponential decay function (1), using SigmaPlot 5.0 (SPSS Inc.):
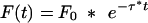 |
1 |
F(t) describes the freezing response at a certain time with F0 being the initial freezing response, t being the time, and τ the decay constant. Differences in F0 indicate freezing at different levels of intensity (first case). Differences in τ refer to an accelerated or decelerated adaptation to the tone (second case).
Furthermore, we tried to isolate the associative component of the freezing response (Fac) for conditioning groups at day 1 (Experiment 1) by equation 2:
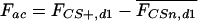 |
2 |
FCS+,d1 describes the individual freezing response of a mouse belonging to one of the conditioning groups and  the mean freezing response of all mice of the respective sensitization group, thus representing freezing due to the nonassociative memory component (Fnac). Similar calculations were performed for sensitized mice by using the same equation 2 and replacing FCS+,d1 with FCSn,d1. In general, Fac was calculated for the freezing response shown during the first minute of tone presentation. During this time period, the freezing reaction of all mice of Experiment 1 showed a steep, almost linear decay, and was not asymptotic to the x-axis yet (cf. Fig. 5; Results).
Spontaneous recovery of the freezing response from day 1 to day 7 was calculated as the difference between the freezing value of the first 20-sec interval of tone presentation at day 7 and the freezing value of the last 20-sec interval of tone presentation at day 1.
Statistics
Data were analyzed by paired t-test and analysis of variance (ANOVA) as specified in the Results section. Post-hoc comparisons were performed by Newman-Keuls test, if appropriate. Statistical significance was accepted if P < 0.05. Defecation scores of Experiment 5 were not normally distributed, and thus, analyzed by Kruskal-Wallis test. For the sake of clarity and brevity, only relevant results of the statistical analyses will be reported.
Acknowledgments
We thank Anja Siegmund (Munich) and Mario Engelmann (Magdeburg) for their valuable comments on this manuscript. This study was supported by a grant of the VolkswagenStiftung to C.T.W. (I/78 562).
Article published online ahead of print. Article and publication date are at http://www.learnmem.org/cgi/doi/10.1101/lm.86104.
References
- Blair, H.T., Schafe, G.E., Bauer, E.P., Rodrigues, S.M., and LeDoux, J.E. 2001. Synaptic plasticity in the lateral amygdala: A cellular hypothesis of fear conditioning. Learn. Mem. 8: 229-242. [DOI] [PubMed] [Google Scholar]
- Blanchard, R.J., Griebel, G., Henrie, J.A., and Blanchard, D.C. 1997. Differentiation of anxiolytic and panicolytic drugs by effects on rat and mouse defense test batteries. Neurosci. Biobehav. Rev. 21: 783-789. [DOI] [PubMed] [Google Scholar]
- Boulis, N.M. and Davis, M. 1989. Footshock-induced sensitization of electrically elicited startle reflexes. Behav. Neurosci. 103: 504-508. [DOI] [PubMed] [Google Scholar]
- Cain, C.K., Blouin, A.M., and Barad, M. 2003. Temporally massed CS presentations generate more fear extinction than spaced presentations. J. Exp. Psychol. Anim. Behav. Process 29: 323-333. [DOI] [PubMed] [Google Scholar]
- Cordero, M.I. and Sandi, C. 1998. A role for brain glucocorticoid receptors in contextual fear conditioning: Dependence upon training intensity. Brain Res. 786: 11-17. [DOI] [PubMed] [Google Scholar]
- Cordero, M.I., Merino, J.J., and Sandi, C. 1998. Correlational relationship between shock intensity and corticosterone secretion on the establishment and subsequent expression of contextual fear conditioning. Behav. Neurosci. 112: 885-891. [DOI] [PubMed] [Google Scholar]
- Davis, M. 1989. Sensitization of the acoustic startle reflex by footshock. Behav. Neurosci. 103: 495-503. [PubMed] [Google Scholar]
- Davis, M. 1998. Are different parts of the extended amygdala involved in fear versus anxiety? Biol. Psychiatry 44: 1239-1247. [DOI] [PubMed] [Google Scholar]
- Davis, M. 2000. The role of the amygdala in conditioned and unconditioned fear and anxiety. In The amygdala. A functional analysis (ed. J.P. Aggleton), pp. 213-287. Oxford UP, New York.
- Dudai, Y. 2004. The neurobiology of consolidations, or, how stable is the engram? Annu. Rev. Psychol. 55: 51-86. [DOI] [PubMed] [Google Scholar]
- Dykman, R.A., Ackerman, P.T., and Newton, J.E.O. 1997. Posttraumatic stress disorder: A sensitization reaction. Integr. Physiol. Behav. Sci. 32: 9-18. [DOI] [PubMed] [Google Scholar]
- Falls, W.A. 1998. Extinction: A review of theory and evidence suggesting that memories are not erased with nonreinforcement. In Learning and behavior therapy (ed. W. O'Donohue), pp. 205-229.
- Allyn & Bacon, Boston, MA. Fanselow, M.S. 1980. Conditioned and unconditional components of post-shock freezing. Pavlov. J. Biol. Sci. 15: 177-182. [DOI] [PubMed] [Google Scholar]
- Allyn & Bacon, Boston, MA. Fanselow, M.S. 1994. Neural organization of the defensive behavior system responsible for fear. Psychon. Bullet. Rev. 1: 429-438. [DOI] [PubMed] [Google Scholar]
- Gerlai, R. 1998. Contextual learning and cue association in fear conditioning in mice: A strain comparison and a lesion study. Behav. Brain Res. 95: 191-203. [DOI] [PubMed] [Google Scholar]
- Grillon, C. 2002. Startle reactivity and anxiety disorders: Aversive conditioning, context, and neurobiology. Biol. Psychiatry 52: 958-975. [DOI] [PubMed] [Google Scholar]
- Groves, P.M. and Thompson, R.F. 1970. Habituation: A dual-process theory. Psychol. Rev. 77: 419-450. [DOI] [PubMed] [Google Scholar]
- Harris, J.D. 1943. Studies on nonassociative factors inherent in conditioning. Com. Psychol. Monogr. 18: 1-74. [Google Scholar]
- Jacobs, W.J. and Nadel, L. 1985. Stress-induced recovery of fear and phobias. Psychol. Rev. 92: 512-531. [PubMed] [Google Scholar]
- Korte, M.S. and De Boer, S.F. 2003. A robust animal model of state anxiety: Fear-potentiated behaviour in the elevated plus-maze. Eur. J. Pharmacol. 463: 163-175. [DOI] [PubMed] [Google Scholar]
- Lamprea, M.R., Cardenas, F.P., Vianna, D.M., Castilho, V.M., Cruz-Morales, S.E., and Brandao, M.L. 2002. The distribution of fos immunoreactivity in rat brain following freezing and escape responses elicited by electrical stimulation of the inferior colliculus. Brain Res. 950: 186-194. [DOI] [PubMed] [Google Scholar]
- Laxmi, T.R., Stork, O., and Pape, H.C. 2003. Generalisation of conditioned fear and its behavioural expression in mice. Behav. Brain Res. 145: 89-98. [DOI] [PubMed] [Google Scholar]
- Mackintosh, N.J. 1974. Classical conditioning: Basic operations. In The psychology of animal learning, pp. 8-40. Academic Press, London.
- Maren, S. 2001. Neurobiology of Pavlovian fear conditioning. Annu. Rev. Neurosci. 24: 897-931. [DOI] [PubMed] [Google Scholar]
- Marks, I. and Tobena, A. 1990. Learning and unlearning fear: A clinical and evolutionary perspective. Neurosci. Biobehav. Rev. 14: 365-384. [DOI] [PubMed] [Google Scholar]
- McEwen, B.S. 2000. The neurobiology of stress: From serendipity to clinical relevance. Brain Res. 886: 172-189. [DOI] [PubMed] [Google Scholar]
- McSweeney, F.K. and Swindell, S. 2002. Common processes may contribute to extinction and habituation. J. Gener. Psychol. 129: 364-400. [DOI] [PubMed] [Google Scholar]
- Myers, K.M. and Davis, M. 2002. Behavioral and neural analysis of extinction. Neuron 36: 567-584. [DOI] [PubMed] [Google Scholar]
- Nader, K. 2003. Memory traces unbound. Trends Neurosci. 26: 65-72. [DOI] [PubMed] [Google Scholar]
- Öhman, A. and Mineka, S. 2001. Fears, phobias, and preparedness: Toward an evolved module of fear and fear learning. Psychol. Rev. 108: 483-522. [DOI] [PubMed] [Google Scholar]
- Petrinovich, L. and Widaman, K.F. 1984. An evaluation of statistical strategies to analyze repeated-measures data. In Habituation, sensitization, and behavior (eds. H.V.S. Peeke and L. Petrinovich), pp. 157-201. Academic Press, Orlando, FL.
- Rescorla, R.A. and Wagner, A.R. 1972. A theory of Pavlovian conditioning: Variations in the effectiveness of reinforcement and nonreinforcement. In Classical conditioning II: Current theory and research (eds. A.H. Black and W.F. Prokasy), pp. 65-99. Appleton-Century-Crofts, New York.
- Richardson, R. 2000. Shock sensitization of startle: Learned or unlearned fear? Behav. Brain Res. 110: 109-117. [DOI] [PubMed] [Google Scholar]
- Rosen, J.B. and Schulkin, J. 1998. From normal fear to pathological anxiety. Psychol. Rev. 105: 325-350. [DOI] [PubMed] [Google Scholar]
- Sapolsky, R.M. 2003. Stress and plasticity in the limbic system. Neurochem. Res. 28: 1735-1742. [DOI] [PubMed] [Google Scholar]
- Sara, S.J. 2000. Retrieval and reconsolidation: Toward a neurobiology of remembering. Learn. Mem. 7: 73-84. [DOI] [PubMed] [Google Scholar]
- Schafe, G.E., Nader, K., Blair, H.T., and LeDoux, J.E. 2001. Memory consolidation of Pavlovian fear conditioning: A cellular and molecular perspective. Trends Neurosci. 24: 540-546. [DOI] [PubMed] [Google Scholar]
- Stam, R., Bruijnzeel, A.W., and Wiegant, V.M. 2000. Long-lasting stress sensitization. Eur. J. Pharmacol. 405: 217-224. [DOI] [PubMed] [Google Scholar]
- Thompson, R.F. and Spencer, W.A. 1966. Habituation: A model phenomenon for the study of neuronal substrates of behavior. Psychol. Rev. 73: 16-43. [DOI] [PubMed] [Google Scholar]
- Walker, D.L., Toufexis, D.J., and Davis, M. 2003. Role of the bed nucleus of the stria terminalis versus the amygdala in fear, stress and anxiety. Eur. J. Pharmacol. 463: 199-216. [DOI] [PubMed] [Google Scholar]
- Wiedenmayer, C.P. 2004. Adaptations or pathologies? Long-term changes in brain and behavior after a single exposure to severe threat. Neurosci. Biobehav. Rev. 28: 1-12. [DOI] [PubMed] [Google Scholar]