Abstract:
Thromboelastography® (TEG®) is used to guide clinical decision-making across many medical and surgical subspecialties. Advances in this field have resulted in analyzers becoming increasingly user friendly, and have led to a reduction in the possibility of user error. The new TEG®6s does not come with the warnings of vibration and movement avoidance of its predecessor. It was decided to test the capability of this device while being subject to motion. TEG®6s machine 1 was placed in an environment free from motion. TEG®6s machine 2 was placed on a flatbed platelet agitator, which would expose the device to sudden and continual motion. Blood from the same healthy volunteer was pipetted into cartridges and inserted into both machines. Testing was commenced on machine 2 simultaneously with the agitator being activated. Visual and numerical data were collected. All measured parameters were significantly different (p < .05) between the motion and motion-free groups apart from CK R-Time, CRT R-Time, CRT Angle, and CRT Ly30. The TEG®6s results differ significantly when the analyzer is exposed to a set amount of motion. Such motion should be avoided if results are to be relied upon.
Keywords: thromboelastography
In many centers, Thromboelastography® (TEG®) (Haemonetics Corporation, Braintree, MA) has become an integral part of patient care. Over time, its value is becoming increasingly well established within liver transplantation (1), cardiac surgery (2), trauma centers (3), and beyond. TEG® was first described by Hartert in 1948 (4). Over the following decades, technological advances refined the underlying technology and clinical applicability, resulting in TEG® becoming an accessible point-of-care test (PoCT).
The TEG®5000 was perhaps the first advancement in the field of viscoelastic testing to be widely embraced clinically. Following activation of the blood sample, testing on the TEG®5000 device required the manual pipetting of blood into a preplaced cup within the analyzer. On loading of the cup, a stationary pin enters the blood, while the cup oscillates left and right at a set speed. The burgeoning clot formation has a direct influence on the torque and therefore movement of the pin, with the resultant rotation being converted into an electrical signal and consequently a tracing that directly represents the formation, maintenance, and potentially breakdown of clot (5).
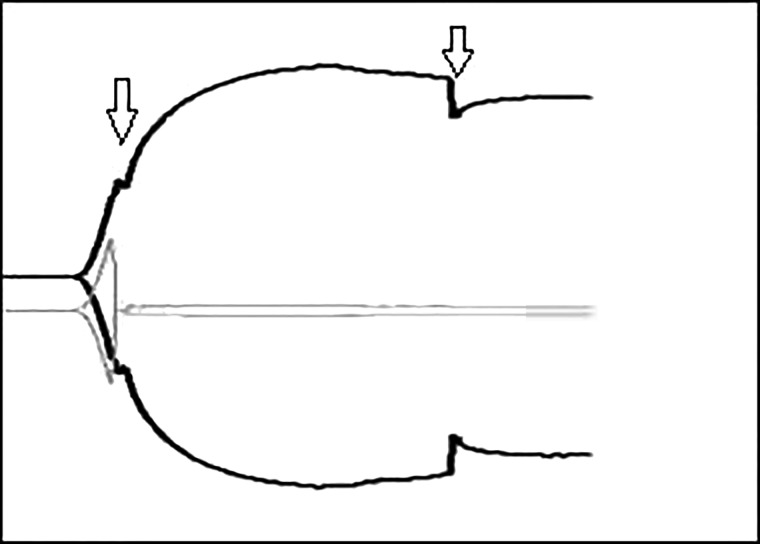
Due to the mechanisms involved in generating the TEG® tracing using the TEG®5000, the user manual strongly recommends that the device be situated in a low-vibration environment with any jolting of the machine being avoided (6). If the TEG®5000 device is inadvertently bumped or knocked, the displayed trace can be affected to varying degrees, with dips or spikes in the tracing making the interpretation of the results both challenging and unreliable (see Figure 1). The supplied literature accompanying the TEG®6s makes no mention of minimizing vibration or of the machine being sensitive to knocking or jerking.
Figure 1.
Example of TEG®5000 trace following tapping. Downward arrows denote the time the TEG®5000 machine was tapped. An obvious inflection can be seen on the displayed traces at the time point the machine was tapped; apart from on one of the traces which did not recover following the initial tap.
In 2015 Haemonetics® released the TEG®6s in Australia. Although still providing the same resultant viscoelastic measurements, functionally the TEG®6s differs from the TEG®5000. Using a four channel microfluidics cartridge containing all required reagents, the TEG®6s automatically draws the required blood volume into the testing chambers. Clot strength is determined using the resonance method, whereby the blood is exposed to a fixed vibration frequency range (20–500 Hz). Using light-emitting diode illumination, a detector measures the vertical motion of the blood meniscus. A fast Fourier transform is used to identify frequency leading to resonance; which information is subsequently converted to a tracing representing clot dynamics (5).
The aim of this study was to determine whether motion had a significant impact on the TEG®6s trace and results.
MATERIALS AND METHODS
Two TEG®6s global hemostasis cartridges were loaded into separate TEG®6s machines. Each cartridge has four channels consisting of a standard Kaolin TEG® (CK), a Kaolin TEG® with heparinase (CKH), a Rapid TEG® (CRT), and a TEG® Functional fibrinogen (CFF) channel.
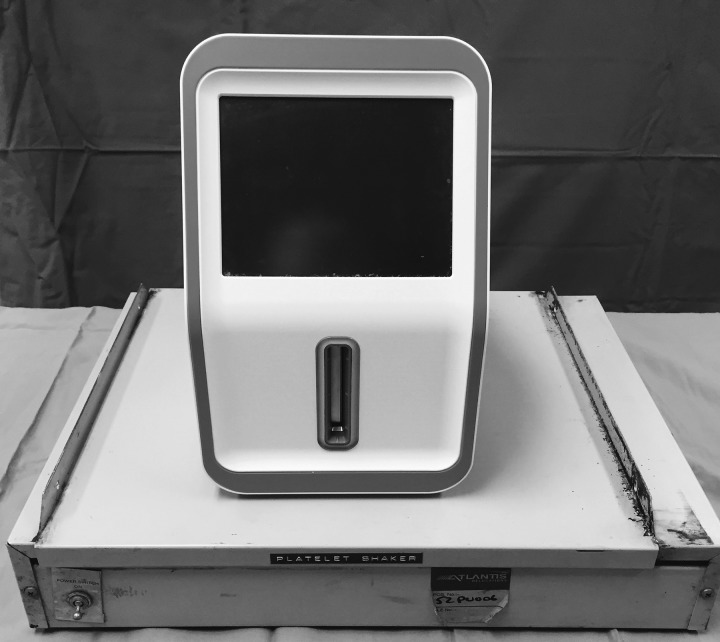
TEG®6s machine 1 was placed on a flat bench free from vibration and movement. TEG®6s machine 2 was placed on a flatbed platelet agitator (Lmb Technologie GmbH, Oberding, Germany) (see Figure 2). The platelet agitator was preset to 60 complete strokes per minute with each stroke constituting a movement of 3.5 cm from its central position.
Figure 2.
TEG®6s on platelet agitator.
Blood was collected from a single healthy volunteer into three citrated collection tubes, which were gently inverted six times. Following a settling period of at least 10 minutes, the blood was again gently inverted six times and manually pipetted into TEG®6s 1 and testing commenced. Blood was then manually pipetted into TEG®6s 2, with testing being commenced simultaneously with the agitator being activated.
Testing was carried out three times with TEG®6s machine 1 being in a vibration and motion-free environment, and TEG®6s machine 2 being subject to the movement of the platelet agitator. The machines were then rotated; with machine 1 being placed on the platelet agitator and machine 2 being placed in the vibration and motion-free environment. A further three tests were carried out with the new configuration.
Visual and numerical data were collected for comparison using the TEG Manager™ software (Haemonetics Corp., Braintree, MA) for each of the four channels on both machines.
The viscoelastic parameters compared were 1) reaction time (R-Time), measured in minutes, which is the time taken until the first significant amount of clot is detected which produces a measured 2-mm amplitude; representative of the enzymatic portion of coagulation. 2) Kinetic time (K-Time), measured in minutes, representative of the time elapsed till fibrin cross linking produces a set measured amplitude of 20 mm. 3) Angle, measured in degrees, is the angle formed by an applied tangent line from the midway point of the R-Time and the K-Time representative of the speed of clot formation. 4) Maximum Amplitude (MA), measured in millimeters, is representative of the maximum clot strength due to platelet and fibrin interaction. 5) Lysis 30 Time (LY30) measured as a percentage, demonstrates the percent reduction in amplitude 30 minutes after the MA is reached; representative of clot lysis. 6) Functional fibrinogen maximum amplitude (FF MA) is representative of the maximum amount of clot strength solely from fibrin. 7) Functional fibrinogen level (FLEV), measured in mg/dL, is a functional FLEV derived from the FF MA (5).
Due to the blood for this study coming from a single donor, namely the author, local Institutional Review Board approval was waived.
Computerized statistical analysis was performed using SAS software, version 9.3 (SAS Institute Inc., Cary, NC) for Windows (Microsoft Corporation, Redmond, WA). Values were compared between groups using a paired t test. A p value of equal to or less than .05 was considered statistically significant.
RESULTS
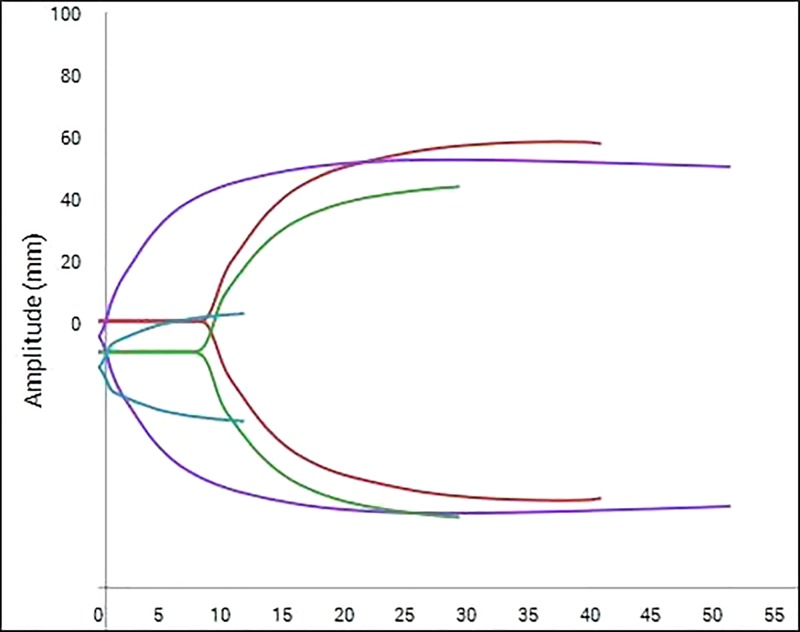
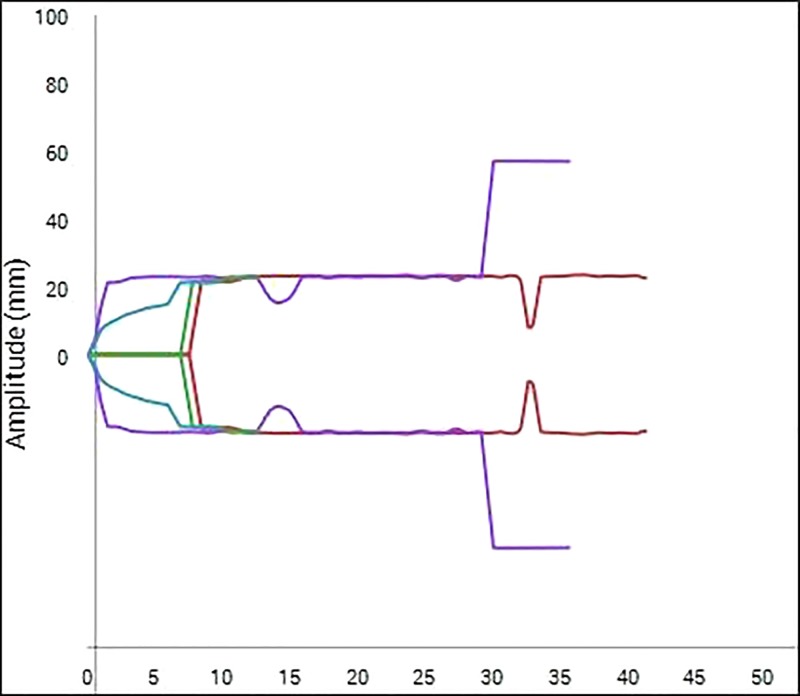
The results, including statistical significance, are shown in Table 1. Only the CK R-Time, CRT R-Time, CRT Angle, and CRT Ly30 failed to reach statistical significance between the machine exposed to motion and the machine in the motion-free environment. All other measured parameters were significantly different between the motion and motion-free groups. An example of the different TEG traces generated in the different environments can be seen in Figure 3 and Figure 4.
Table 1.
Comparison of measured parameters of TEG®6s exposed to motion and TEG®6s in motion-free environment.
| Measurement | Reference Ranges | Mean (SD) |
Mean Difference (95% CI) (Motion-Free Motion) | p Value | |
|---|---|---|---|---|---|
| Motion Free | Motion | ||||
| CK R-Time (minute) | 4.6–9.1 | 8.62 (.83) | 9.82 (5.99) | −1.20 (−7.74 to 5.34) | .66 |
| CK K-Time (minute) | .8–2.1 | 1.98 (.40) | .88 (.26) | 1.10 (.59 to 1.61) | .003 |
| CK Ang (degrees) | 63–78 | 65.58 (4.65) | 78.45 (5.22) | −12.9 (−19.8 to −5.9) | .005 |
| CK MA (mm) | 52–69 | 55.28 (1.65) | 22.87 (.61) | 32.4 (30.9 to 34.0) | <.0001 |
| CK LY30 (%) | 0–2.6 | .13 (.06) | .88 (1.08) | −1.90 (−3.17 to −.63) | .033 |
| CRT R-Time (minute) | .3–1.1 | .50 (.06) | .48 (.08) | .02 (−.06 to .10) | .61 |
| CRT K-Time (minute) | .8–2.7 | 1.80 (.09) | 1.43 (.37) | .37 (−.00 to .73) | .050 |
| CRT Ang (degrees) | 60–78 | 69.42 (.84) | 72.20 (2.84) | −2.78 (−6.20 to .63) | .090 |
| CRT MA (mm) | 52–70 | 56.58 (1.64) | 33.65 (16.69) | 22.9 (4.9 to 40.9) | .022 |
| CRT LY30 (%) | 0–2.2 | .68 (.38) | .63 (1.05) | −.08 (−1.81 to 1.65) | .90 |
| CKH R-Time (minute) | 4.3–8.3 | 7.87 (.50) | 6.88 (.65) | .98 (.35 to 1.62) | .010 |
| CKH K-Time (minute) | .8–1.9 | 1.80 (.06) | .82 (.04) | .98 (.90 to1.06) | <.0001 |
| CKH Ang (degrees) | 64.3–77.1 | 67.42 (2.08) | 79.92 (1.14) | −12.5 (−15.2 to −9.8) | <.0001 |
| CKH MA (mm) | 52.3–68.9 | 55.15 (1.62) | 22.40 (.82) | 32.8 (30.5 to 35.0) | <.0001 |
| CFF MA (mm) | 15–32 | 16.93 (.50) | 20.47 (1.73) | −3.53 (−5.59 to −1.48) | .007 |
| CFF FLEV (mg/dL) | 278–581 | 309.00 (9.22) | 373.48 (31.61) | −64.5 (−102.0 to −27.0) | .007 |
Ang, angle, CK, Kaolin TEG®, CKH, Kaolin with heparinase TEG®, CFF, Functional Fibrinogen, CRT, Rapid TEG®.
Figure 3.
Example of TEG®6s trace in motion-free environment. The arc of each curve is smooth in appearance without any obvious inflections.
Figure 4.
Example of TEG®6s trace exposed to motion. Multiple inflections can be seen throughout the displayed traces.
DISCUSSION
TEG® has had a tremendously positive influence on patient blood management in many fields of health care. The TEG®6s has now made this testing user friendly and improved reproducibility of results by its new cartridge-based system reducing the chance of user error.
Although the TEG®5000 was extremely sensitive to the slightest of movement, its successor, the TEG®6s, is far from immune to the effects of movement. This novel study has shown that almost all values generated by the TEG®6s were significantly affected when the machine was subject to a set amount of motion. The difference in traces between the motion and motion-free group would make interpretation of the motion group results very challenging and could result in inappropriate clinical decision-making if acted upon.
More specifically, within the clinical setting, using TEG® to target blood product replacement is extremely useful and can contribute to reduced donor blood product exposure and cost savings (7,8). To obtain these benefits, it is of vital importance that the results obtained can be relied upon. The results from this study show that motion of the machine during analysis has the potential to significantly affect the majority of measured parameters, thus making the accurate targeting of blood product replacement virtually impossible from the obtained results. Even the parameters that failed to reach statistical significance between the motion and motion-free groups (CK R-time, CRT R-time, and CRT LY30) had such significant differences in all other measured parameters within each channel, pointing to obvious interference.
The TEG®6s and accompanying TEG Manager™ software display a reference range as a guide for each measured parameter (Table 1). If the healthy subject's mean results were interpreted using this reference range, it can be seen that the user could draw very different conclusions between the motion and motion-free group. This would perhaps be most noticeable with the MA results in the CK, CKH, and CRT channels.
What is perhaps harder to show with the numerical data, displayed in Table 1, is the overall unreliability of the displayed trace. If Figure 4 is referred to, it can be seen that a parameter may be stable for an amount of time on a “Motion channel,” which would then trigger the recording of numerical data, yet further on the trace may change beyond recognition. This could lead to either inappropriate conclusions based on the numerical data or confusion of where the true trace should lie when looking at the results graphically.
Within the hospital setting, in light of these findings, movement of the machine should be avoided once testing has commenced. The user friendly interface of the TEG Manager™ software makes visualizing the generated results very easy from any screen with an internet connection, thus eradicating the need to move the machine for result visualization.
These findings should also be taken into consideration if this device was to be considered for road-based or air-based transport medicine, where sudden movements would likely be encountered.
The marketing of many PoCT devices strives to show how such devices are robust and portable, which may be the case. It would, however, be pertinent for the end user to be cognizant that the results of such tests have a direct impact on patient care, and thus any factors which may interfere with these results be minimized.
The placement of a TEG®6s machine on a platelet agitator is a means of simulating a type of movement in a reproducible manner to assess the impact of that movement during all aspects of the measurement. A platelet agitator was chosen due to the device moving from one end point to another mimicking a TEG®6s machine being moved in a continuous manner; and the rapid change in direction of the agitator as it reaches its end point mimicking a sudden jolt of the TEG®6s machine. It is acknowledged as a study limitation that this type of movement may not accurately represent motion encountered within the clinical setting.
CONCLUSION
When subject to a set amount of motion, the results generated by the TEG®6s are significantly affected across the majority of measured parameters. Clinical decision-making based on results generated by a machine exposed to such movement would be unwise.
ACKNOWLEDGMENT
I wish to thank Liz Barnes, at the Kids Research Institute, for the statistical analysis provided for this work.
REFERENCES
- 1.Gurusamy K. S., Pissanou T., Pikhart H., Vaughan J., Burroughs A. K., Davidson B. R.. Methods to decrease blood loss and transfusion requirements for liver transplantation. Cochrane Database Syst Rev. 2011;12:CD009052. [DOI] [PMC free article] [PubMed] [Google Scholar]
- 2.Gorlinger K., Dirkmann D., Hanke A. A.. Potential value of transfusion protocols in cardiac surgery. Curr Opin Anaesthesiol. 2013;26:230–43. [DOI] [PubMed] [Google Scholar]
- 3.Whiting D., DiNardo J. A.. TEG and ROTEM: Technology and clinical applications. Am J Hematol. 2014;89:228–32. [DOI] [PubMed] [Google Scholar]
- 4.Hartert H. Blutgerinnung studien mit der thromboelastographie, einen Neuen Untersuchingsverfahren. Klin Wochenschrift. 1948;26:577–83 cited by Whitten CW and Greilich PE. Thromboelastography® Past, Present, and Future. Anesthesiology. 2000;92:1223–5. [DOI] [PubMed] [Google Scholar]
- 5.Haemonetics Corporation. White Paper, Introducing TEG®6s. 2015. [Google Scholar]
- 6.Haemonetics Corporation TEG®5000 System User Manual. Niles, IL: Haemonetics Corp., Haemoscope Division; 2011. [Google Scholar]
- 7.Kane L. C., Woodward C. S., Husain S. A., Frei-Jones M. J.. Thromboelastography—Does it impact blood component transfusion in pediatric heart surgery? J Surg Res. 2016;200:21–7. [DOI] [PubMed] [Google Scholar]
- 8.Whiting P., Al M., Westwood M., Ramos I. C., Ryder S., Armstrong N., Misso K., Ross J., Severens J., Kleijnen J.. Viscoelastic point-of-care testing to assist with the diagnosis, management and monitoring of haemostasis: A systematic review and cost-effectiveness analysis. Health Technol Assess. 2015;19:1–228. [DOI] [PMC free article] [PubMed] [Google Scholar]


