Significance
Despite significant efforts, stable and organized human cartilage has not been grown from human mesenchymal stem cells in vitro. We report the formation of organized cartilage discs that resemble the articular cartilage from self-assembling human mesenchymal stem cells by implementing spatiotemporal regulation in vitro that mimics native development. Selective application of chondrogenic and hypertrophic induction regimens enabled the maintenance of functional hyaline cartilage and progressive deep-zone mineralization. We demonstrate that this simple biomimetic approach helped mature the cartilage discs and enabled them to remain stable and organized following implantation. These findings highlight the limitations of current isotropic culture, and could greatly accelerate the development of new therapeutic modalities for cartilage repair from a patient’s own cells.
Keywords: tissue engineering, biomimetic, regenerative medicine, cartilage development, cartilage repair
Abstract
Standard isotropic culture fails to recapitulate the spatiotemporal gradients present during native development. Cartilage grown from human mesenchymal stem cells (hMSCs) is poorly organized and unstable in vivo. We report that human cartilage with physiologic organization and in vivo stability can be grown in vitro from self-assembling hMSCs by implementing spatiotemporal regulation during induction. Self-assembling hMSCs formed cartilage discs in Transwell inserts following isotropic chondrogenic induction with transforming growth factor β to set up a dual-compartment culture. Following a switch in the basal compartment to a hypertrophic regimen with thyroxine, the cartilage discs underwent progressive deep-zone hypertrophy and mineralization. Concurrent chondrogenic induction in the apical compartment enabled the maintenance of functional and hyaline cartilage. Cartilage homeostasis, chondrocyte maturation, and terminal differentiation markers were all up-regulated versus isotropic control groups. We assessed the in vivo stability of the cartilage formed under different induction regimens. Cartilage formed under spatiotemporal regulation in vitro resisted endochondral ossification, retained the expression of cartilage markers, and remained organized following s.c. implantation in immunocompromised mice. In contrast, the isotropic control groups underwent endochondral ossification. Cartilage formed from hMSCs remained stable and organized in vivo. Spatiotemporal regulation during induction in vitro recapitulated some aspects of native cartilage development, and potentiated the maturation of self-assembling hMSCs into stable and organized cartilage resembling the native articular cartilage.
Functional tissues generated in vitro from a patient’s own cells could provide biological substitutes for tissues lost or damaged due to old age or injury (1). Our growing understanding of developmental biology has guided tissue-engineering approaches to better regulate stem cell differentiation and tissue formation (2–4). The articular cartilage has a limited regenerative ability due to its avascular nature (5). Current approaches to repair focal cartilage lesions include autograft, mosaicplasty, and autologous chondrocyte implantation (6–8). However, these methods are limited by donor site morbidity. Thus, there is an ongoing effort toward developing stem cell-based therapies, particularly with mesenchymal stem cells (MSCs)—the most attractive cell source for clinical application (9). Our group and others have shown that self-assembly methods recapitulated mesenchymal condensation and enhanced chondrogenesis of MSCs in vitro (10–12). Still, standard isotropic culture fails to recapitulate the spatiotemporal gradients present during native development (3, 9, 13, 14). Cartilage formed by MSCs is poorly organized and prone to endochondral ossification in vivo (4, 15). Instead, the native articular cartilage is organized and comprises the superficial zone, which develops into permanent cartilage, and the deep zone, which mineralizes to form calcified cartilage (16). We hypothesized that the implementation of spatiotemporal regulation during induction of self-assembling human (h)MSCs in vitro can potentiate the formation of functional cartilage with physiologic organization and in vivo stability. Specifically, we investigated whether a spatiotemporally regulated induction regimen can (i) generate hyaline cartilage discs with physiologic organization from self-assembling hMSCs, (ii) induce deep-zone hypertrophy and mineralization to guide cartilage maturation, and (iii) enable the cartilage discs to remain stable and organized in vivo.
To this end, we compacted hMSCs on coated Transwell membranes by centrifugation and allowed the cells to differentiate under chondrogenic induction. At 3 wk, we switched induction in the basal compartment to a hypertrophic regimen in the experimental group, and maintained isotropic chondrogenic or hypertrophic regimens in the control groups. After 10 wk, all groups were implanted ectopically in immunocompromised mice to evaluate their stability in vivo. Through extensive analyses, we showed that the implementation of spatiotemporal regulation during induction of self-assembling hMSCs in vitro resulted in the formation of cartilage discs with physiologic stratification and deep-zone mineralization. Human MSCs formed deep-zone mineralized cartilage discs that did not undergo endochondral ossification in vivo. Instead, the cartilage discs retained zonal organization and exhibited columnar chondrocytes and nascent tidemark formation. We thus propose that the mimicry of native spatiotemporal gradients can be achieved in vitro to enhance the organization and stability of cartilage tissues formed by self-assembling MSCs. We expect that this simple and effective approach can also be applied toward engineering other tissue types originating from self-assembling progenitor cells patterned with spatiotemporal gradients during native development.
Results
We hypothesized that the recapitulation of physiological spatiotemporal signals present during native cartilage development would promote the in vitro formation of phenotypically stable human articular cartilage. To test this hypothesis, we formed cartilage discs by self-assembly of hMSCs following isotropic chondrogenic induction with transforming growth factor β (TGF-β) in a dual-compartment culture (CH). The basal compartment of cartilage discs was changed to a hypertrophic regimen with thyroxine, to induce progressive deep-zone hypertrophy and mineralization, whereas the apical compartment was subjected to chondrogenic induction to maintain functional hyaline cartilage. Cartilage discs cultured under spatially isotropic chondrogenic conditions (IC) served as controls. The effects of spatiotemporal signals were investigated with respect to the formation and mineralization of cartilage, gene expression, biochemical composition, and mechanical properties of the engineered tissue.
Biochemical and Mechanical Analysis.
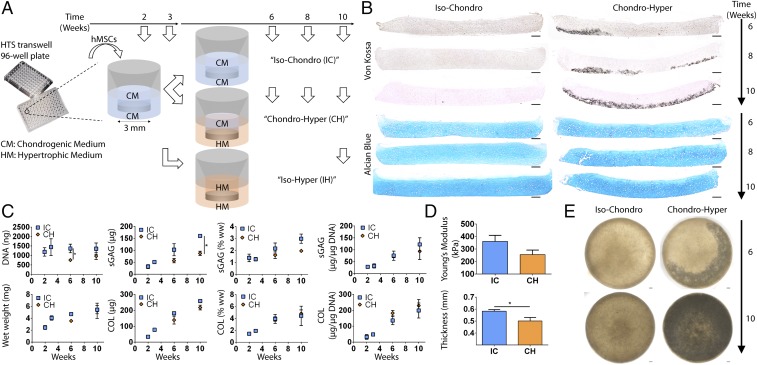
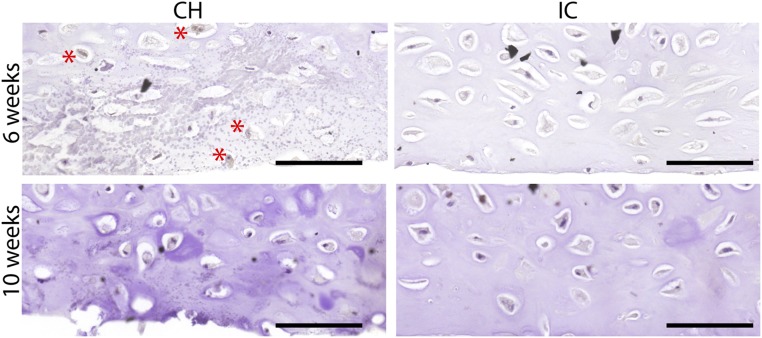
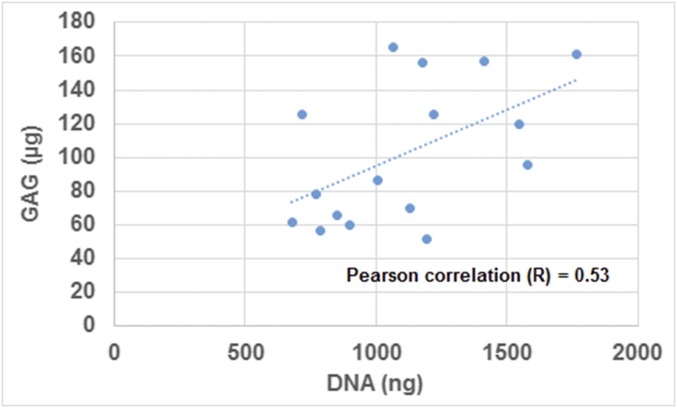
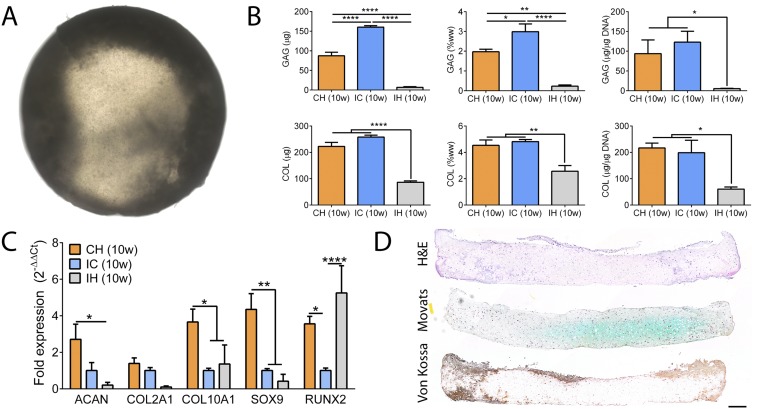
The DNA content of the CH group was lower at 6 wk (Fig. 1C), correlating with deep-zone cleaved caspase-3 expression (Fig. S1). This suggests the onset of apoptosis with cartilage mineralization. The lower GAG content of the CH group correlated with the DNA content (Fig. S2). Collagen (COL) contents and GAG and COL productivities (contents normalized to DNA) were similar between the groups (Fig. 1C). Correspondingly, the CH group exhibited a slightly lower Young’s modulus and thickness (Fig. 1D). Instead, GAG and COL contents of the IH group deteriorated significantly (Fig. S3B).
Fig. 1.
Experimental design and tissue morphogenesis. (A) Schematic of the induction regimens. (B) Progressive deep mineralization in the CH group but not the IC group (Von Kossa), and maintenance of hyaline cartilage in both groups (Alcian blue). (C) Biochemical analyses revealed a lower DNA content (6 wk) and a lower GAG content (10 wk) in the CH group. COL content and GAG and COL productivities (normalized to DNA) were similar. sGAG, sulfated GAG; ww, wet weight. (D) Mechanical testing showed similar compressive Young’s modulus between the groups. The IC group was slightly thicker. (E) Whole-tissue bright-field images showed near-complete mineralization by 10 wk. Mean ± SEM; *P < 0.05. (Scale bars, 200 µm.)
Fig. S1.
Cleaved caspase-3 expression. Following deep-zone hypertrophic induction, some apoptosis was seen at 6 wk with incipient mineralization in the deep zone (asterisks). In contrast, no apoptosis was seen at 10 wk, or in the isotropic control groups at both 6 and 10 wk. (Scale bars, 200 µm.)
Fig. S2.
Scatterplot showing the correlation between GAG and DNA data of both the IC and CH groups at 6 and 10 wk. Pearson correlation was determined to be 0.53.
Fig. S3.
In vitro outcomes of the isotropic hypertrophic control group. (A) Whole-tissue bright-field image revealing dense peripheral mineralization of the discs at 10 wk. (B) Biochemical analysis confirmed near-complete loss of GAG and significant loss of COL. (C) Gene expression analysis confirmed down-regulation of cartilage maintenance markers (ACAN, COL2A1, SOX9) and up-regulation of a terminal maturation marker (RUNX2). All gene expression (2−∆Ct) is normalized to GAPDH. (D) Histological stains showing widespread loss of GAG (Movat’s) and peripheral mineralization (Von Kossa). Mean ± SEM; *P < 0.05, **P < 0.01, and ****P < 0.0001. (Scale bar, 200 µm.)
Hyaline Cartilage Formation and Deep-Zone Mineralization.
Both the IC and CH groups formed hyaline cartilage rich in sulfated glycosaminoglycan (GAG). Depthwise cross-sections of the CH group exhibited deep-zone mineralization starting at 6 wk (Fig. 1B). Histological analysis confirmed maintenance of hyaline cartilage and progressive deep-zone mineralization. Whole-tissue transverse bright-field images revealed deep-zone mineralization reaching completion by 10 wk (Fig. 1E). In contrast, the isotropic hypertrophic (IH) control group exhibited near-complete loss of cartilage, and mineralized everywhere at the edge after 10 wk (Fig. S3 A and D).
Changes in Gene Expression.
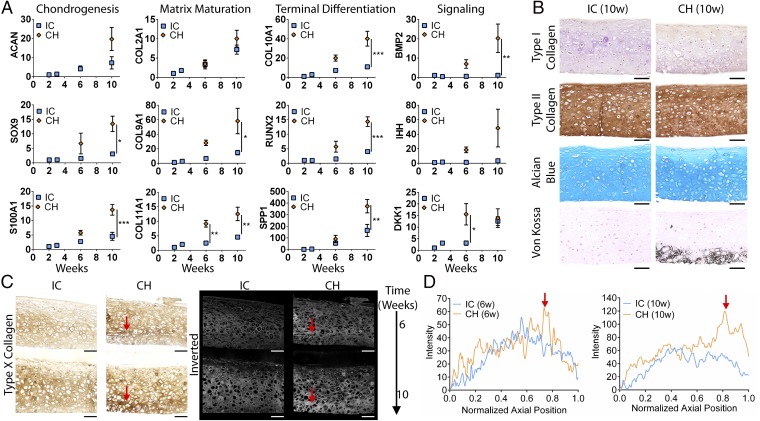
We assessed the gene expression of both the IC and CH groups at different time points. Correlating with the biochemical compositions, the expression of aggrecan (ACAN) and type II collagen (COL2A1) was similar between the groups. Instead, the expression of trophic factors (BMP2, DKK1, IHH) and markers associated with chondrogenesis (SOX9, S100A), chondrocyte maturation (COL9A1, COL11A1), and terminal differentiation (COL10A1, RUNX2, SPP1) was significantly up-regulated in the CH group from 6 to 10 wk (Fig. 2A). In contrast, the expression of chondrogenic markers was abolished and terminal maturation markers were up-regulated in the IH group at 10 wk (Fig. S3C).
Fig. 2.
Cartilage maturation and organization. (A) The CH group showed increased expression of cartilage homeostasis (SOX9, S100A1), chondrocyte maturation (COL9A1, COL11A1), terminal differentiation (COL10A1, RUNX2, SPP), and trophic markers (DKK1, BMP2, IHH) (for primers please Table S1). ACAN and COL2A1 expression was similar between groups. All gene expression (2−∆∆Ct) is normalized to GAPDH and 2-wk controls. (B) Hyaline cartilage at 10 wk with homogeneous type II collagen and GAG deposition. The CH group was mineralized in the deep zone. (C) Type X collagen immunohistochemical stains and inverted images. Red arrows indicate bands of hypertrophy. (D) Intensity profile of stains showed distinct deep-zone peaks in the CH group. Mean ± SEM; *P < 0.05, **P < 0.01, and ***P < 0.001. (Scale bars, 200 µm.)
Deep-Zone Hypertrophy.
We stained for type X collagen expression and found enhanced deep-zone hypertrophy in the CH group, which correlated with deep-zone mineralization (Fig. 2C). Profiling the expression, we observed a sharp-intensity peak in the deep zone of the CH group, which increased without a change in relative position from 6 to 10 wk. Instead, the expression in the IC group was more diffuse (Fig. 2D). Thus, the implementation of spatiotemporal regulation potentiated deep-zone chondrocyte terminal differentiation.
Cartilage Maintenance and Stability in Vivo.
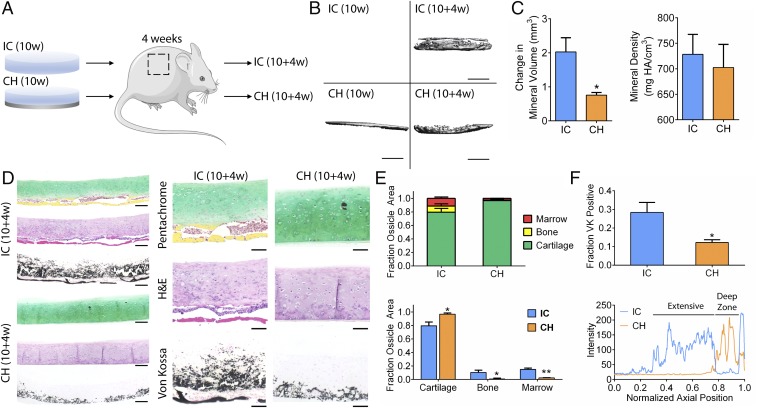
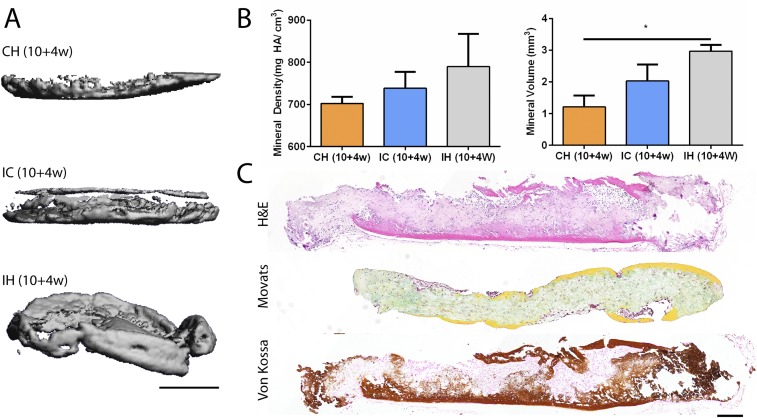
We implanted all groups s.c. in immunocompromised mice to assess cartilage maintenance in vivo. After 4 wk, the IC group underwent endochondral ossification as marrow cells, and nascent bone lined the bottom of the discs. Remarkably, the CH group resisted endochondral ossification and exhibited columnar chondrocytes and tidemark formation (Fig. 3). Microcomputed tomography (µCT) analysis revealed greater mineral deposition in the IC group than in the CH group (Fig. 3 B and C). Movat’s pentachrome stains confirmed significant bone and marrow fractions in the IC group not seen in the CH group (Fig. 3 D and E). Von Kossa stains revealed more extensive mineralization in the IC group (Fig. 3F). The IH group was also extensively mineralized, with bone formation and marrow infiltration all around the discs (Fig. S4). Thus, the implementation of spatiotemporal regulation during induction of self-assembling hMSCs in vitro resulted in the formation of organized cartilage discs that are stable in vivo.
Fig. 3.
Cartilage maintenance and stability in vivo. (A) Discs cultured for 10 wk under different regimens were implanted s.c. in the back of immunocompromised mice for 4 wk and explanted for analysis. (B) µCT images showed extensive mineral deposition in the IC group following implantation but not the CH group. (Scale bar, 1 mm.) (C) The increase in mineral volume was significantly greater in the IC group than the CH group postimplantation, with similar mineral density. HA, hydroxyapatite. (D) Whole-tissue (Left) and detailed (Right) histological comparisons of IH and CH discs postimplantation. Movat’s pentachrome and H&E stains of tissue cross-sections showed mature bone (yellow) with marrow cells (red) lining the bottom of the IC discs but not the CH discs. Instead, the CH discs displayed columnar chondrocytes and tidemark formation. Von Kossa stain showed extensive mineralization in the IC discs but local deep-zone mineralization in the CH discs (for antibodies please Table S2). [Scale bars, 200 μm (Left); 100 μm (Right).] (E) Segmentation and quantitation of Movat’s pentachrome stains showed significant fractions of bone and marrow present in the IC group but not the CH group. (F) Quantitation and profiling of Von Kossa (VK) staining showed greater and more extensive mineralization in the IC group. Mean ± SEM; *P < 0.05 and **P < 0.01.
Fig. S4.
In vivo outcomes of the isotropic hypertrophic control group. (A) Representative µCT images of CH, IC, and IH discs following 10-wk induction and 4-wk implantation. (Scale bar, 1 mm.) (B) The IH group exhibited greater mineral density and volume following implantation. (C) Histological stains showing extensive endochondral ossification with bone formation and marrow infiltration from all sides of the tissue. Mean ± SEM; *P < 0.05. (Scale bar, 200 µm.)
Retention of Cartilage Markers and Zonal Organization.
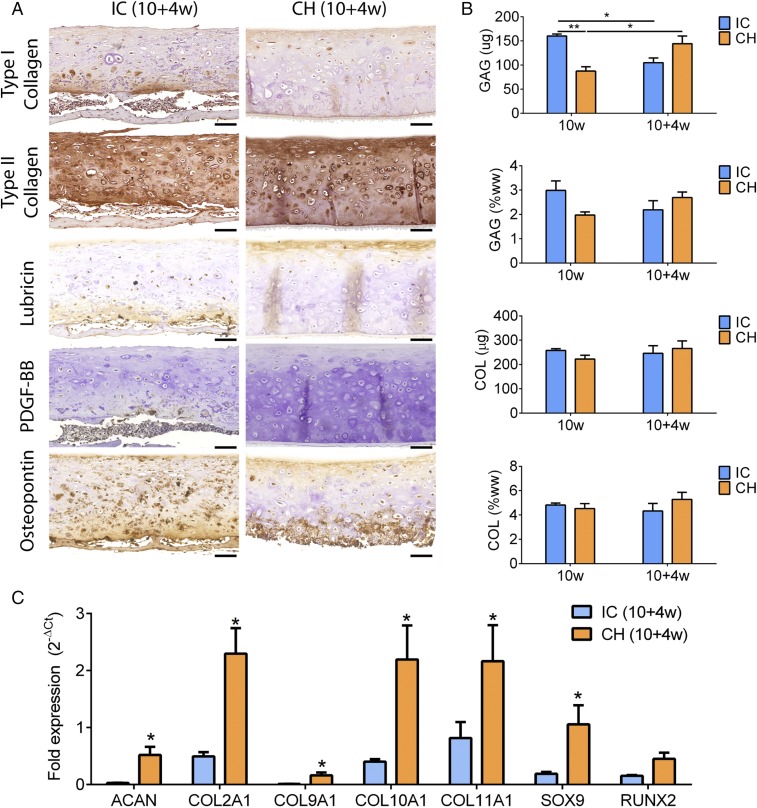
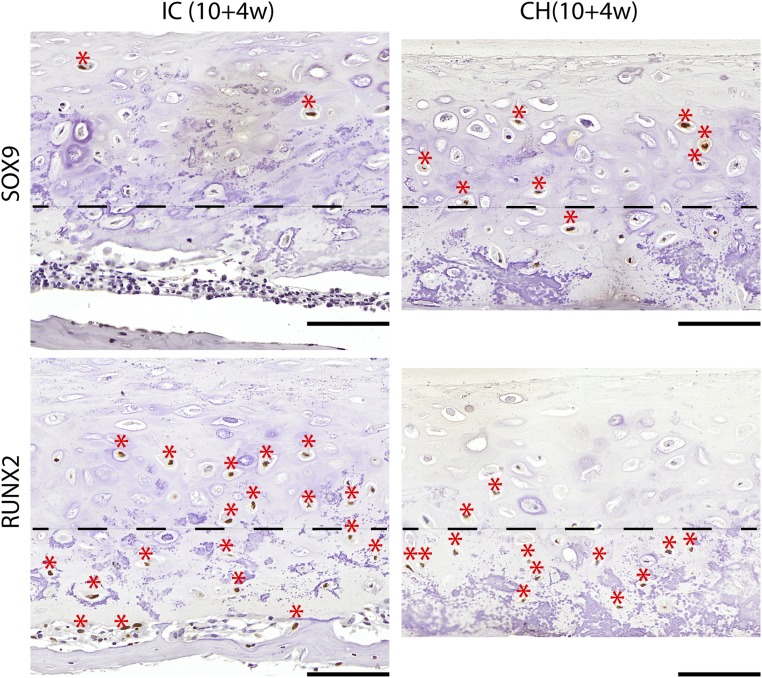
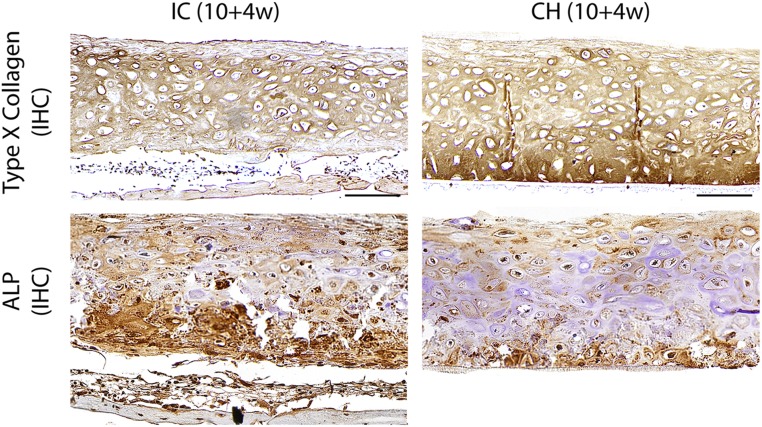
The CH group remained type II collagen-rich, and distinctly expressed lubricin in the superficial zone and osteopontin in the deep zone. In contrast, the IC group exhibited loss of type II collagen in the cartilage layer and deposition of type I collagen in the bone layer. The IC group exhibited faint lubricin expression and extensively expressed osteopontin. Platelet-derived growth factor-BB (PDGF-BB) staining revealed infiltration of preosteoclasts and multinuclear osteoclasts into the bottom of the IC but not the CH discs (Fig. 4A). SOX9, RUNX2, alkaline phosphatase, and type X collagen expression was zonally delineated in the CH discs but not the IC discs (Figs. S5 and S6). Compositionally, GAG content recovered in the CH group but decreased in the IC group (Fig. 4B). Correspondingly, the expression of genes associated with cartilage maintenance (SOX9, ACAN, COL2A1, COL9A1, COL11A1) and chondrocyte terminal differentiation (COL10A1, RUNX2) persisted in the CH group following implantation. In contrast, all cartilage maintenance markers were significantly down-regulated in the IC group (Figs. S6 and S7).
Fig. 4.
Retention of cartilage phenotype. (A) The IC group showed type I collagen deposition, loss of type II collagen, faint lubricin expression in upper and lower aspects, and extensive osteopontin expression. The CH group showed homogeneous type II collagen deposition, superficial-zone lubricin expression, and deep-zone osteopontin expression. PDGF-BB staining revealed preosteoclasts/osteoclasts invading IC discs but not CH discs. (Scale bar, 100 μm.) (B) The GAG content of the CH group recovered whereas that of the IC group deteriorated postimplantation. COL contents were similar. (C) Expression of cartilage maintenance (SOX9, ACAN, COL2A1, COL9A1, COL11A1) and chondrocyte terminal differentiation (COL10A1, RUNX2) markers persisted in the CH group but not the IC group postimplantation. All gene expression (2−∆Ct) is normalized to GAPDH. Mean ± SEM; *P < 0.05 and **P < 0.01.
Fig. S5.
SOX9 and RUNX2 expression after implantation. SOX9 expression (asterisk) was maintained in the upper zone of the CH group, and RUNX2 expression (asterisk) was limited to the deep zone. Instead, trace SOX9 expression and extensive RUNX2 were seen in the IC group. Dashed line demarcates the boundary between the upper and deep zones. (Scale bars, 200 µm.)
Fig. S6.
Type X collagen and alkaline phosphatase (ALP) expression after implantation. Strong type X collagen expression was seen in the deep zone of the CH group and near the superficial zone of the IC group that was undergoing endochondral ossification. Immunohistochemical (IHC) staining of ALP revealed deep-zone expression in the CH group and extensive expression in the IC group. (Scale bars, 200 µm.)
Fig. S7.
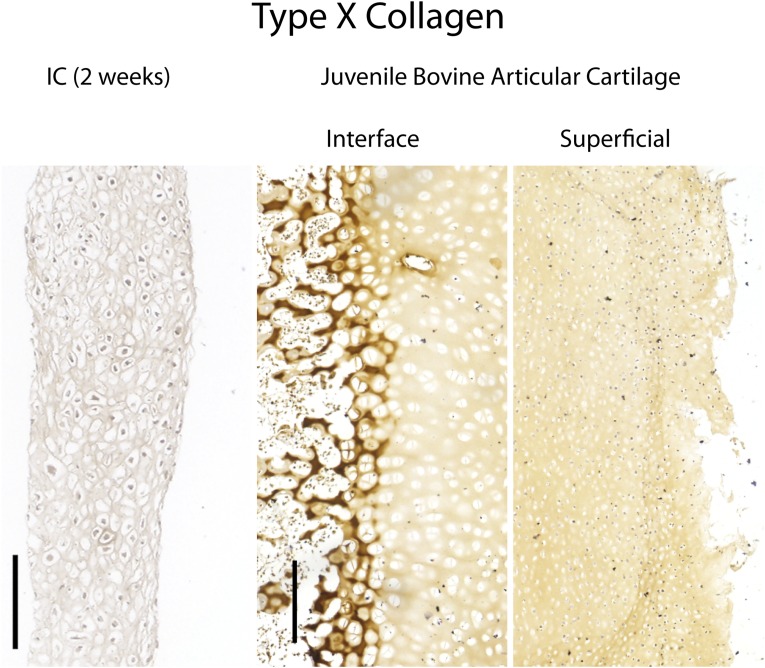
Control stains for type X collagen. (Left) Native juvenile (2-mo) osteochondral tissue harvested from a bovine femoral condyle expressed type X collagen at the cartilage–bone interface but not the superficial zone. (Right) Engineered tissues subjected to chondrogenic induction for 2 wk did not express type X collagen. (Scale bars, 200 µm.)
Standard isotropic culture conditions fail to recapitulate native spatiotemporal gradients, and tend to form poorly organized cartilage tissues that are prone to endochondral ossification in vivo (4, 15). Here we implemented spatiotemporal regulation during the induction of self-assembling hMSCs in vitro, and showed that it potentiated the formation of physiologic cartilage discs with deep-zone mineralization and in vivo stability.
Discussion
Tissue-engineering approaches are increasingly guided by biological principles. Mesenchymal condensation has been adapted into self-assembly methods to enhance cartilage formation in vitro (10, 11). TGF-β and thyroxine, potent effectors of cartilage maintenance and chondrocyte terminal differentiation, have been used in chondrogenic and hypertrophic induction regimens to guide MSC differentiation (4, 14, 17–22). Thus, we chose these two factors as culture supplements. Chondrogenesis of MSCs in vitro is defined by a temporal sequence of cellular events (3). We recently showed that isotropic chondrogenic induction of hMSCs in hydrogel formed cartilage with a deficient core (23). In other studies, isotropic hypertrophic induction of chondrogenically differentiated hMSCs resulted in uncontrolled mineralization (4, 12). As such, spatiotemporal regulation poses a significant challenge that we seek to overcome.
To enable compartmentalization and stepwise maturation, we switched deep-zone induction to a hypertrophic regimen at 3 wk. The formation of cartilage discs isolated the apical compartment from the basal compartment to set up a dual-compartment culture. This process recapitulates some aspects of the spatiotemporal gradient present during native cartilage development. Following the switch, hyaline cartilage was maintained and deep-zone mineralization progressed through 10 wk of culture.
Cartilage maintenance and maturation are governed by complex signaling cross-talk involving multiple pathways and transcription factors (24, 25). SOX9 and its target S100A1 are required for chondrogenesis during limb development and postnatal cartilage homeostasis (26, 27). DKK1 is a canonical Wnt inhibitor that prevents terminal differentiation (28). On the contrary, BMP2 and IHH promote terminal differentiation and the up-regulation of RUNX2 (29). Types II, IX, and XI collagen are indicative of mature articular chondrocytes, whereas type X collagen and mineral-binding proteins such as osteopontin are indicative of hypertrophic chondrocytes (25). In the present study, spatiotemporal regulation in vitro potentiated the up-regulation of these genes associated with cartilage maintenance, matrix maturation, and terminal differentiation. Along with the increased type X collagen expression in the deep zone, these data suggest that the increase in local terminal differentiation was concurrent with overall cartilage maturation.
Interestingly, gene expression at 6 wk was not significantly different between groups. This could be attributed to the heterogeneous differentiation states of the cells during induction. At 6 wk, the discs were mineralized at the rim, which suggests that deep-zone cells at the rim underwent terminal differentiation before cells in the middle. At 10 wk, the mineralization was complete and differences in gene expression of relevant markers reached significance.
Notably, we showed that the cartilage discs formed under spatiotemporal regulation in vitro were stable and remained organized during ectopic implantation in mice. Instead, discs formed in isotropic cultures underwent uncontrolled mineralization and endochondral ossification in vivo, in agreement with previous studies (4, 15, 30). The stratification was evidenced by superficial-zone expression of lubricin and deep-zone expression of osteopontin. We previously showed that self-assembling MSCs formed cartilage with a superficial lubricin lining after 5 wk of chondrogenic induction (10). In the present study, zonal lubricin expression was observed after implantation. Despite the heterogeneous differentiation states indicated by patchy expression, SOX9 was generally expressed in the upper zone and RUNX2 in the deep zone. These indicated zonal delineation of cartilage homeostasis and chondrocyte terminal differentiation. Persistent expression of cartilage maintenance and maturation markers, and a recovery in GAG content, further confirmed the in vivo stability of the discs.
The native calcified cartilage bridges the articular cartilage and subchondral bone, and protects the articular cartilage by blocking vascular invasion and selectively permitting the passage of small molecules from the subchondral bone (31). A recent study showed that engineered mineralized cartilage increases the interfacial shear strength of osteochondral composites (12). We determined that the mineral found in the calcified cartilage formed from hMSCs is apatite, similar to that of the native cartilage, and established that the mineral density increased during implantation before endochondral ossification. In the present study, deep-zone mineralized cartilage discs formed from hMSCs remained stable and organized in vivo. Interestingly, the mineralized cartilage bore a tidemark following implantation and resembled the native calcified cartilage. The lack of endochondral ossification in vivo could be attributed in part to the chondroprotective effects of the engineered calcified cartilage.
There are several ways to further improve the current study. Despite showing that similarities in the organization and maturation profiles exist between the engineered cartilage and the native articular cartilage, we could not clearly define underlying mechanisms. RNA in situ hybridization would further clarify expression patterns. To increase the cartilage thickness, we could integrate our novel approach with a method we developed to engineer large cartilage by fusing condensed mesenchymal bodies on bone scaffolds (10). Importantly, this approach locally regulated but did not inhibit type X collagen expression. The incorporation of other factors such as hypoxia and compressive loading could inhibit spontaneous hypertrophy and improve functional properties of the engineered cartilage (30, 32). Whether bona fide articular cartilage can be formed from MSCs requires validation with well-defined markers that distinguish between mature chondrocytes and MSCs (33). Developmentally, the articular cartilage is formed by outer interzone cells originating from the chondrogenic mesoderm (16). The use of pluripotent stem cells would also enable unprecedented control, as they can generate chondrocytes with distinct articular and growth plate phenotypes (34).
In summary, we report that organized and stable articular cartilage with physiologic likeness can be grown in vitro from self-assembling hMSCs by implementing spatiotemporal regulation during induction that recapitulates some aspects of native cartilage development. We showed that this simple and effective method potentiated the formation of physiologic cartilage with deep-zone mineralization and up-regulation of markers associated with cartilage homeostasis and maturation. We demonstrated that the stratified cartilage resisted endochondral ossification and retained zonal organization without loss of cartilage marker expression in vivo. Conceivably, this method could be applied toward engineering other tissues from self-assembling progenitor cells also patterned with spatiotemporal gradients during native development.
Materials and Methods
Please SI Materials and Methods for hMSC preparation, s.c. implantation, and gene expression, histological, µCT, biochemical, mechanical, and statistical analyses. All animal experiments followed federal guidelines and were conducted under a protocol approved by the Columbia University Animal Care and Use Committee.
Disc Formation.
Type I collagen (Corning) was diluted to 1.5 mg/mL in ethanol and used to coat the polycarbonate membrane (0.4-µm pore size) of 96-well HTS Transwell inserts (Corning). The inserts were air-dried overnight and rinsed with PBS. Multiple layers of hMSCs (250,000 per well) were seeded into the inserts and compacted by centrifugation (200 × g, 5 min). Seeded inserts were assembled with reservoir plates, each filled with 20 mL chondrogenic media. Media in the inserts were carefully topped up 3 h postcentrifugation (200 µL per well). Tissues were incubated in a controlled humidified chamber [37 °C, 5% (vol/vol) CO2], and media were replaced every other day. Samples were fixed in 10% (vol/vol) formalin or snap-frozen and stored at −80 °C.
Induction Regimens.
Chondrogenic medium comprises high-glucose DMEM supplemented with 10 ng/mL TGF-β3, 100 nM dexamethasone, 50 μM ascorbic acid-2 phosphate, 100 μM sodium pyruvate, 5 μg/mL proline, 1% insulin, transferrin, and sodium selenite mix (ITS+), and 1% penicillin–streptomycin (P/S). Hypertrophic medium comprises high-glucose DMEM supplemented with 50 nM T4, 5 mM β-glycerophosphate, 1 nM dexamethasone, 50 μM ascorbic acid-2 phosphate, 100 μM sodium pyruvate, 5 μg/mL proline, 1% ITS+, and 1% P/S. After 3 wk of chondrogenic induction in both compartments, 400-µm-thick discs formed and isolated the compartments from each other. Induction in the basal compartment (reservoir) was switched to a hypertrophic regimen in the experimental (CH) group. Chondrogenic induction was maintained in both compartments for the isotropic chondrogenic control group. Inductions in both compartments were switched to hypertrophic regimens and maintained for the isotropic hypertrophic control group. All groups were kept in culture for up to 10 wk. Samples were taken at different time points for analysis (n = 4).
SI Materials and Methods
Human Mesenchymal Stem Cells.
Fresh bone marrow aspirates were obtained from Cambrex and processed as in our previous studies (10). Bone marrow-derived hMSCs isolated were expanded to the end of the fourth passage (P4) in high-glucose DMEM containing 10% (vol/vol) FBS, 1% penicillin-streptomycin, and 1 ng/mL fibroblast growth factor 2. These cells were extensively used in previous studies, including the establishment of the method for making scaffold-free cartilage (10). To compare data between studies and ensure integration of methods, we performed the experiments twice on the same batch of cells. All reagents were from Life Technologies.
Subcutaneous Implantation.
Discs cultured for 10 wk were implanted into subcutaneous pouches of 8–10-wk-old female SCID mice (Jackson Laboratory). Two incisions were made on the back of each mice, and a blunt forceps was used to create a pocket in the subcutaneous space into which the tissue samples were inserted. After implantation, the skin was closed with two sutures, and mice were monitored daily. No signs of discomfort were observed following surgery in any of the animals throughout the study. Samples were explanted at 4 wk for gene expression (n = 4), biochemical (n = 4), histological (n = 4), μCT, and mechanical (n = 4) analyses.
Gene Expression.
Samples were crushed with pestles and homogenized with TRIzol reagent (Life Technologies). RNA was extracted according to the TRIzol method. The quantity of RNA was measured on the NanoDrop ND 1000 (Thermo Fisher Scientific). Following treatment with a DNase I removal kit, cDNA was synthesized using the Applied Biosystems High-Capacity Kit. Quantitative RT-PCR analysis was performed using 20 ng cDNA per reaction and Applied Biosystems SYBR Green PCR Master Mix. The expression of target genes was normalized to the housekeeping gene GAPDH, and calculated from the mean Ct values of technical duplicates for each sample. All primers (Table S1) were synthesized by Life Technologies.
Table S1.
List of primers
| Primer | Forward sequence, 5′ to 3′ | Reverse sequence, 5′ to 3′ |
| ACAN | CCCCTGCTATTTCATCGACCC | GACACACGGCTCCACTTGAT |
| BMP2 | ACCCGCTGTCTTCTAGCGT | TTTCAGGCCGAACATGCTGAG |
| COL10A1 | CATAAAAGGCCCACTACCCAAC | ACCTTGCTCTCCTCTTACTGC |
| COL11A1 | ACCCTCGCATTGACCTTCC | TTTGTGCAAAATCCCGTTGTTT |
| COL2A1 | AGACTTGCGTCTACCCCAATC | GCAGGCGTAGGAAGGTCATC |
| COL9A1 | GCCTTCCGGGCATTAAGGG | GCAAACCGTTGGGACCTCTT |
| DKK1 | ATAGCACCTTGGATGGGTATTCC | CTGATGACCGGAGACAAACAG |
| GAPDH | TGTTGCCATCAATGACCCCTT | CTCCACGACGTACTCAGCG |
| IHH | AACTCGCTGGCTATCTCGGT | GCCCTCATAATGCAGGGACT |
| RUNX2 | CCGTCTTCACAAATCCTCCCC | CCCGAGGTCCATCTACTGTAAC |
| S100A1 | GACCCTCATCAACGTGTTCCA | CCACAAGCACCACATACTCCT |
| SOX9 | AGCGAACGCACATCAAGAC | CTGTAGGCGATCTGTTGGGG |
| SPP1 | GTTTCGCAGACCTGACATCCA | GCTTTCCATGTGTGAGGTGAT |
Histology and Immunohistochemistry.
Samples were fixed in 10% (vol/vol) formalin for 24 h and, if necessary, decalcified with Immunocal (Fisher Scientific). Following dehydration in an ethanol series, samples were embedded in paraffin and sectioned to 5 µm. Sections were stained for hematoxylin and eosin (H&E), Alcian blue for glycosaminoglycan (GAG), Von Kossa for phosphates, and Movat’s pentachrome. Samples were also stained immunohistochemically for lubricin, osteopontin, PDGF-BB, cleaved caspase-3 (Cell Signaling Technology), SOX9, RUNX2, and types I, II, and X collagen. The source information on all antibodies used is summarized in Table S2. Controls for type X collagen staining included engineered tissue at an earlier time point and native osteochondral tissues (Fig. S7). All antibodies were from Abcam unless otherwise stated.
Table S2.
Source information on antibodies
| Marker | Vendor | Catalog no. | Dilution |
| Alkaline phosphatase | Abcam | 75699 | 1:25 |
| Cleaved caspase-3 | CST | 9661 | 1:300 |
| Lubricin | Abcam | 28484 | 1:250 |
| Osteopontin | Abcam | 166709 | 1:200 |
| PDGF-BB | Abcam | 21234 | 1:200 |
| RUNX2 | Abcam | 192256 | 1:1,000 |
| SOX9 | Abcam | 185966 | 1:1,000 |
| Type I collagen | Abcam | 34712 | 1:200 |
| Type II collagen | Abcam | 6308 | 1:200 |
| Type X collagen | Abcam | 49945 | 1:1,000 |
Image Quantitation.
For type X collagen and Von Kossa stains, images were balanced, binarized, and inverted (ImageJ; NIH). Intensity profiles were established across representative regions of interest. To quantify composition, inverted images were thresholded and the area stained was determined as a fraction of the total tissue area. For Movat’s pentachrome stains, images were segmented with the Color Deconvolution plugin. Separated colors were binarized, inverted, and thresholded to determine the stained areas of bone (yellow), cartilage (green), and marrow (red).
Biochemical Analysis.
Samples were blotted dry, weighed, and digested in 0.5 mL proteinase K solution (50 μg/mL) at 60 °C. DNA and sulfated GAG contents were measured from the sample digests using the Molecular Probes PicoGreen Assay (Life Technologies) and 1,9-dimethylmethylene blue dye colorimetric assay, respectively. The sample digests were then hydrolyzed at 110 °C with 6 N HCl. Hydroxyproline content was determined from the hydrolysates and assumed to be 10% of the total collagen content.
Mechanical Testing.
Samples (whole discs) were submerged in PBS and tested with unconfined compression. Disc thickness was measured by the position of tissue contact to that of the platen. Discs were compressed at 100 nm/s (∼0.02% strain per s) for up to 2,000 s, and the compressive load was measured. Young’s modulus was calculated from the linear slope (20 to 30% strain) of the stress–strain curve.
µCT Analysis.
Samples were fixed in 10% (vol/vol) formalin for 24 h at room temperature and kept in PBS. For each sample, 3D high-resolution images were obtained using a vivaCT 40 System (SCANCO Medical). Grayscale images were binarized using a global threshold. Mineral volume and mineral density were evaluated using standard morphological analysis software on the vivaCT 40 system.
Statistical Analysis.
All quantitative results are presented as mean ± SEM (n = 4 per data point). Pairwise comparisons were performed on results using multiway analysis of variance (ANOVA) followed by Tukey’s post hoc test (Prism software; GraphPad). Significant differences are denoted as *P < 0.05, **P < 0.01, and ***P < 0.001.
Acknowledgments
We gratefully acknowledge the funding support of A*STAR Singapore (NSS Scholarship) and the NIH (Grants EB002520, EB015888, DE016525, and AR061988) for this work.
Footnotes
The authors declare no conflict of interest.
This article is a PNAS Direct Submission.
This article contains supporting information online at www.pnas.org/lookup/suppl/doi:10.1073/pnas.1611771114/-/DCSupplemental.
References
- 1.Langer RS, Vacanti JP. Tissue engineering: The challenges ahead. Sci Am. 1999;280(4):86–89. doi: 10.1038/scientificamerican0499-86. [DOI] [PubMed] [Google Scholar]
- 2.Nakao K, et al. The development of a bioengineered organ germ method. Nat Methods. 2007;4(3):227–230. doi: 10.1038/nmeth1012. [DOI] [PubMed] [Google Scholar]
- 3.Sekiya I, Vuoristo JT, Larson BL, Prockop DJ. In vitro cartilage formation by human adult stem cells from bone marrow stroma defines the sequence of cellular and molecular events during chondrogenesis. Proc Natl Acad Sci USA. 2002;99(7):4397–4402. doi: 10.1073/pnas.052716199. [DOI] [PMC free article] [PubMed] [Google Scholar]
- 4.Scotti C, et al. Recapitulation of endochondral bone formation using human adult mesenchymal stem cells as a paradigm for developmental engineering. Proc Natl Acad Sci USA. 2010;107(16):7251–7256. doi: 10.1073/pnas.1000302107. [DOI] [PMC free article] [PubMed] [Google Scholar]
- 5.Tew SR, Kwan APL, Hann A, Thomson BM, Archer CW. The reactions of articular cartilage to experimental wounding: Role of apoptosis. Arthritis Rheum. 2000;43(1):215–225. doi: 10.1002/1529-0131(200001)43:1<215::AID-ANR26>3.0.CO;2-X. [DOI] [PubMed] [Google Scholar]
- 6.O’Driscoll SW, Keeley FW, Salter RB. The chondrogenic potential of free autogenous periosteal grafts for biological resurfacing of major full-thickness defects in joint surfaces under the influence of continuous passive motion. An experimental investigation in the rabbit. J Bone Joint Surg Am. 1986;68(7):1017–1035. [PubMed] [Google Scholar]
- 7.Hangody L, Kish G, Kárpáti Z, Szerb I, Udvarhelyi I. Arthroscopic autogenous osteochondral mosaicplasty for the treatment of femoral condylar articular defects. A preliminary report. Knee Surg Sports Traumatol Arthrosc. 1997;5(4):262–267. doi: 10.1007/s001670050061. [DOI] [PubMed] [Google Scholar]
- 8.Brittberg M, et al. Treatment of deep cartilage defects in the knee with autologous chondrocyte transplantation. N Engl J Med. 1994;331(14):889–895. doi: 10.1056/NEJM199410063311401. [DOI] [PubMed] [Google Scholar]
- 9.Mauck RL, Yuan X, Tuan RS. Chondrogenic differentiation and functional maturation of bovine mesenchymal stem cells in long-term agarose culture. Osteoarthritis Cartilage. 2006;14(2):179–189. doi: 10.1016/j.joca.2005.09.002. [DOI] [PubMed] [Google Scholar]
- 10.Bhumiratana S, et al. Large, stratified, and mechanically functional human cartilage grown in vitro by mesenchymal condensation. Proc Natl Acad Sci USA. 2014;111(19):6940–6945. doi: 10.1073/pnas.1324050111. [DOI] [PMC free article] [PubMed] [Google Scholar]
- 11.Hu JC, Athanasiou KA. A self-assembling process in articular cartilage tissue engineering. Tissue Eng. 2006;12(4):969–979. doi: 10.1089/ten.2006.12.969. [DOI] [PubMed] [Google Scholar]
- 12.Lee WD, Hurtig MB, Pilliar RM, Stanford WL, Kandel RA. Engineering of hyaline cartilage with a calcified zone using bone marrow stromal cells. Osteoarthritis Cartilage. 2015;23(8):1307–1315. doi: 10.1016/j.joca.2015.04.010. [DOI] [PubMed] [Google Scholar]
- 13.Murdoch AD, et al. Chondrogenic differentiation of human bone marrow stem cells in Transwell cultures: Generation of scaffold-free cartilage. Stem Cells. 2007;25(11):2786–2796. doi: 10.1634/stemcells.2007-0374. [DOI] [PubMed] [Google Scholar]
- 14.Murphy MK, Huey DJ, Hu JC, Athanasiou KA. TGF-β1, GDF-5, and BMP-2 stimulation induces chondrogenesis in expanded human articular chondrocytes and marrow-derived stromal cells. Stem Cells. 2015;33(3):762–773. doi: 10.1002/stem.1890. [DOI] [PubMed] [Google Scholar]
- 15.Pelttari K, et al. Premature induction of hypertrophy during in vitro chondrogenesis of human mesenchymal stem cells correlates with calcification and vascular invasion after ectopic transplantation in SCID mice. Arthritis Rheum. 2006;54(10):3254–3266. doi: 10.1002/art.22136. [DOI] [PubMed] [Google Scholar]
- 16.Pacifici M, Koyama E, Iwamoto M. Mechanisms of synovial joint and articular cartilage formation: Recent advances, but many lingering mysteries. Birth Defects Res C Embryo Today. 2005;75(3):237–248. doi: 10.1002/bdrc.20050. [DOI] [PubMed] [Google Scholar]
- 17.Ballock RT, et al. TGF-beta 1 prevents hypertrophy of epiphyseal chondrocytes: Regulation of gene expression for cartilage matrix proteins and metalloproteases. Dev Biol. 1993;158(2):414–429. doi: 10.1006/dbio.1993.1200. [DOI] [PubMed] [Google Scholar]
- 18.Bassett JHD, Williams GR. The molecular actions of thyroid hormone in bone. Trends Endocrinol Metab. 2003;14(8):356–364. doi: 10.1016/s1043-2760(03)00144-9. [DOI] [PubMed] [Google Scholar]
- 19.Okubo Y, Reddi AH. Thyroxine downregulates Sox9 and promotes chondrocyte hypertrophy. Biochem Biophys Res Commun. 2003;306(1):186–190. doi: 10.1016/s0006-291x(03)00912-4. [DOI] [PubMed] [Google Scholar]
- 20.Mello MA, Tuan RS. Effects of TGF-beta1 and triiodothyronine on cartilage maturation: In vitro analysis using long-term high-density micromass cultures of chick embryonic limb mesenchymal cells. J Orthop Res. 2006;24(11):2095–2105. doi: 10.1002/jor.20233. [DOI] [PubMed] [Google Scholar]
- 21.Johnstone B, Hering TM, Caplan AI, Goldberg VM, Yoo JU. In vitro chondrogenesis of bone marrow-derived mesenchymal progenitor cells. Exp Cell Res. 1998;238(1):265–272. doi: 10.1006/excr.1997.3858. [DOI] [PubMed] [Google Scholar]
- 22.Mueller MB, Tuan RS. Functional characterization of hypertrophy in chondrogenesis of human mesenchymal stem cells. Arthritis Rheum. 2008;58(5):1377–1388. doi: 10.1002/art.23370. [DOI] [PMC free article] [PubMed] [Google Scholar]
- 23.Albro MB, et al. Heterogeneous engineered cartilage growth results from gradients of media-supplemented active TGF-β and is ameliorated by the alternative supplementation of latent TGF-β. Biomaterials. 2016;77:173–185. doi: 10.1016/j.biomaterials.2015.10.018. [DOI] [PMC free article] [PubMed] [Google Scholar]
- 24.DeLise AM, Fischer L, Tuan RS. Cellular interactions and signaling in cartilage development. Osteoarthritis Cartilage. 2000;8(5):309–334. doi: 10.1053/joca.1999.0306. [DOI] [PubMed] [Google Scholar]
- 25.Goldring MB, Tsuchimochi K, Ijiri K. The control of chondrogenesis. J Cell Biochem. 2006;97(1):33–44. doi: 10.1002/jcb.20652. [DOI] [PubMed] [Google Scholar]
- 26.Ikeda T, et al. The combination of SOX5, SOX6, and SOX9 (the SOX trio) provides signals sufficient for induction of permanent cartilage. Arthritis Rheum. 2004;50(11):3561–3573. doi: 10.1002/art.20611. [DOI] [PubMed] [Google Scholar]
- 27.Henry SP, Liang S, Akdemir KC, de Crombrugghe B. The postnatal role of Sox9 in cartilage. J Bone Miner Res. 2012;27(12):2511–2525. doi: 10.1002/jbmr.1696. [DOI] [PMC free article] [PubMed] [Google Scholar]
- 28.Oh H, Chun C-H, Chun J-S. Dkk-1 expression in chondrocytes inhibits experimental osteoarthritic cartilage destruction in mice. Arthritis Rheum. 2012;64(8):2568–2578. doi: 10.1002/art.34481. [DOI] [PubMed] [Google Scholar]
- 29.Minina E, Kreschel C, Naski MC, Ornitz DM, Vortkamp A. Interaction of FGF, Ihh/Pthlh, and BMP signaling integrates chondrocyte proliferation and hypertrophic differentiation. Dev Cell. 2002;3(3):439–449. doi: 10.1016/s1534-5807(02)00261-7. [DOI] [PubMed] [Google Scholar]
- 30.Leijten J, et al. Metabolic programming of mesenchymal stromal cells by oxygen tension directs chondrogenic cell fate. Proc Natl Acad Sci USA. 2014;111(38):13954–13959. doi: 10.1073/pnas.1410977111. [DOI] [PMC free article] [PubMed] [Google Scholar]
- 31.Hoemann CD, Lafantaisie-Favreau C-H, Lascau-Coman V, Chen G, Guzmán-Morales J. The cartilage-bone interface. J Knee Surg. 2012;25(2):85–97. doi: 10.1055/s-0032-1319782. [DOI] [PubMed] [Google Scholar]
- 32.Mauck RL, et al. Functional tissue engineering of articular cartilage through dynamic loading of chondrocyte-seeded agarose gels. J Biomech Eng. 2000;122(3):252–260. doi: 10.1115/1.429656. [DOI] [PubMed] [Google Scholar]
- 33.Dell’Accio F, De Bari C, Luyten FP. Molecular markers predictive of the capacity of expanded human articular chondrocytes to form stable cartilage in vivo. Arthritis Rheum. 2001;44(7):1608–1619. doi: 10.1002/1529-0131(200107)44:7<1608::AID-ART284>3.0.CO;2-T. [DOI] [PubMed] [Google Scholar]
- 34.Craft AM, et al. Generation of articular chondrocytes from human pluripotent stem cells. Nat Biotechnol. 2015;33(6):638–645. doi: 10.1038/nbt.3210. [DOI] [PubMed] [Google Scholar]


