Significance
Although trimethylamine N-oxide (TMAO) is perhaps the quintessential protein-stabilizing osmolyte, its mechanism of action has long remained elusive. Our study indicates that, in contrast to betaine and glycine, TMAO forms direct attractive interactions with polypeptides. This work strengthens and extends Berne’s previous conclusions, because we report results for a model polypeptide rather than a hydrophobic polymer. Our results are particularly striking, because we consider a model polypeptide that is enriched in amide groups that are believed responsible for the depletion of TMAO from unfolded proteins. Our study leads to the surprising conclusion that TMAO stabilizes folded conformations, despite interacting with unfolded conformations. We hypothesize that TMAO acts as a unique surfactant for the heterogeneous surface that emerges on protein folding.
Keywords: osmolytes, protein folding, mechanism, spectroscopy, MD simulations
Abstract
We report experimental and computational studies investigating the effects of three osmolytes, trimethylamine N-oxide (TMAO), betaine, and glycine, on the hydrophobic collapse of an elastin-like polypeptide (ELP). All three osmolytes stabilize collapsed conformations of the ELP and reduce the lower critical solution temperature (LSCT) linearly with osmolyte concentration. As expected from conventional preferential solvation arguments, betaine and glycine both increase the surface tension at the air–water interface. TMAO, however, reduces the surface tension. Atomically detailed molecular dynamics (MD) simulations suggest that TMAO also slightly accumulates at the polymer–water interface, whereas glycine and betaine are strongly depleted. To investigate alternative mechanisms for osmolyte effects, we performed FTIR experiments that characterized the impact of each cosolvent on the bulk water structure. These experiments showed that TMAO red-shifts the OH stretch of the IR spectrum via a mechanism that was very sensitive to the protonation state of the NO moiety. Glycine also caused a red shift in the OH stretch region, whereas betaine minimally impacted this region. Thus, the effects of osmolytes on the OH spectrum appear uncorrelated with their effects upon hydrophobic collapse. Similarly, MD simulations suggested that TMAO disrupts the water structure to the least extent, whereas glycine exerts the greatest influence on the water structure. These results suggest that TMAO stabilizes collapsed conformations via a mechanism that is distinct from glycine and betaine. In particular, we propose that TMAO stabilizes proteins by acting as a surfactant for the heterogeneous surfaces of folded proteins.
Many organisms use small organic osmolytes to stabilize proteins in harsh environments, such as when the salinity is highly variable (1). In particular, trimethylamine N-oxide (TMAO) is known to counteract the denaturing effects of urea as well as salts, and it is present at high concentrations in some aquatic organisms (2). Its effects are often compared with the ions on the left side of the Hofmeister series, which help stabilize the native, folded structures of proteins (Fig. 1).
Fig. 1.
The rank order of the direct Hofmeister series and common osmolytes typically found for neutral and negatively charged macromolecules.
Because of their fundamental biophysical importance, many studies have investigated the behavior and effects of osmolytes. In particular, Timasheff and coworkers (3, 4) proposed that osmolyte effects result from the relative partitioning of these molecules between the bulk solution and the protein–water interface. Stabilization should occur when osmolytes are depleted from the protein–water interface, but proteins will unfold when osmolytes accumulate at this interface. Accordingly, osmolyte effects are often interpreted in terms of an effective protein–water “surface tension.” In fact, despite the significant differences between protein surfaces and air–water interfaces, osmolyte effects are often, although not always, consistent with their effect on the air–water interfacial tension (5). More recent studies (6, 7) have extended such classical considerations (3, 4, 8) to elucidate the mechanism by which many osmolytes impact protein stability. Nevertheless, the mechanism by which TMAO stabilizes proteins remains controversial.
Solvation studies with model compounds have suggested that TMAO is excluded from unfolded proteins because of its very unfavorable interactions with the peptide backbone (9, 10). Several molecular dynamics (MD) simulation studies have been consistent with this conclusion (11, 12). However, they have proposed a wide array of explanations for this preferential hydration ranging from unfavorable electrostatic interactions (13, 14) to “nanocrowder” effects (15, 16). By contrast, other simulations have suggested that TMAO stabilizes folded proteins via direct attractive van der Waals interactions (17, 18).
Several studies have investigated the effect of TMAO on the solvent. Garde and coworkers (19) concluded that TMAO has minimal impact on hydrophobic interactions, but Paul and Patey (20) suggested that TMAO actually weakens hydrophobic forces. Other studies suggested that osmolytes stabilize folded states of proteins indirectly by altering the bulk water structure. For instance, MD simulations and IR studies have both suggested that, by strengthening the water hydrogen-bonding network, TMAO impacts protein stability by weakening peptide–water interactions (10, 21–23). In particular, Sharp et al. (24) concluded that TMAO enhances the structure of water, because it induces a red shift in the OH stretch of the IR spectrum. In contrast, Hunger et al. (25) attributed the same red shift to the formation of hydrogen bonds between water and the oxygen of TMAO. Indeed, several simulation studies have observed very strong interactions between TMAO and water (26, 27). Nevertheless, it is not clear that one can draw conclusions about the water structure based solely on shifts in the OH stretch region, because the spectrum represents a convolution of water–water and water–cosolvent interactions. Moreover, Pielak and coworkers (28) have argued that the impact of cosolvents on protein stability and water structure are not correlated. As such, despite many previous studies, the mechanism of TMAO action remains controversial.
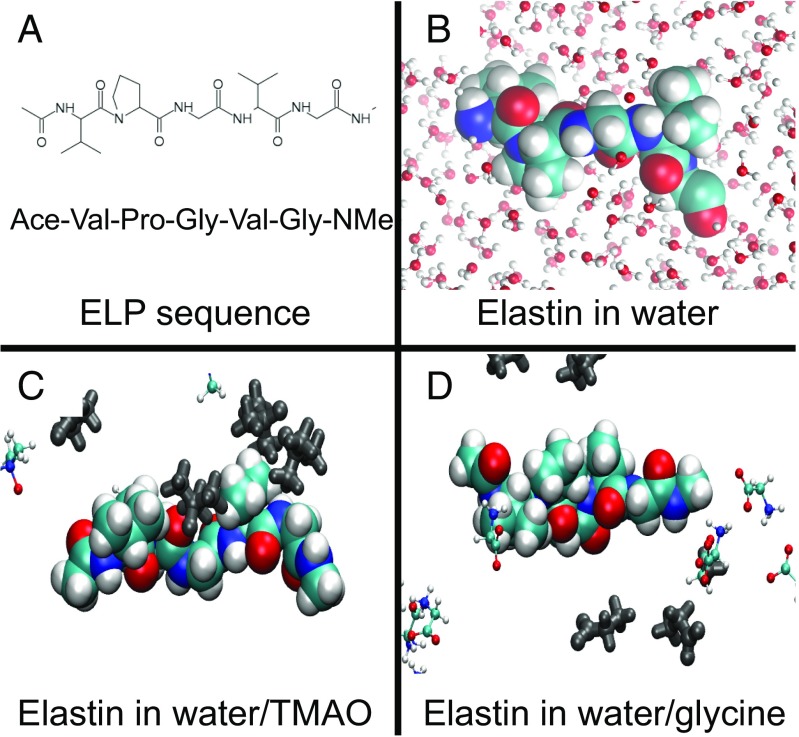
In this study, we examined contemporary models for the stabilizing influence of TMAO on macromolecular structure in aqueous solutions. Specifically, we looked at the influence of TMAO on the solubility of neutral, hydrophobic elastin-like polypeptides (ELPs), which contain 120 repeat units of the pentapetide sequence, VPGVG (valine–proline–glycine–valine–glycine), for a total of 600 residues. This biopolymer undergoes hydrophobic collapse above its lower critical solution temperature (LCST) (29). We used a combination of LCST measurements, surface tension measurements, and IR spectroscopy to investigate the nature of TMAO–ELP interactions. To complement these experimental measurements, we also performed atomically detailed MD simulations of a single capped VPGVG repeat in explicit solvent. Fig. 2A presents the chemical formula for this construct, whereas Fig. 2B presents a space-filling model of the ELP fragment, in which water molecules are indicated by a ball and stick representation.
Fig. 2.
Simulated ELP systems. A depicts the chemical sequence of the simulated ELP construct. B presents a space-filling model of the ELP construct while representing water molecules with a ball and stick representation. C and D present configurations that have been sampled from atomically detailed, explicit solvent simulations of the ELP fragment in water–TMAO and water–glycine solutions, respectively. In C and D, osmolyte atoms within 10 Å of the ELP solute have been highlighted in silver, whereas more distant osmolyte atoms are indicated with ball and stick representations. The simulated water molecules in C and D have been omitted for clarity.
Our studies indicate that, although TMAO stabilizes the collapsed state of the macromolecule, it is not depleted from either the air–water interface or the polypeptide–water interface. Rather, as Fig. 2C indicates by the silver atoms within the simulated configuration, TMAO molecules appear to form direct, favorable contacts with the ELP fragment. This result stands in striking contrast to the mechanisms observed for other osmolytes, such as glycine and betaine, which seem to stabilize folded conformations via a traditional depletion mechanism as illustrated by the simulated configuration in Fig. 2D. Moreover, we show that the TMAO oxygen significantly impacts the water OH IR spectrum and provide additional evidence that TMAO minimally disrupts the water-bonding network. These results contradict the central tenants of classical theories for protein stabilization by osmolytes. Instead, a new model is required that explains how TMAO stabilizes collapsed conformations, despite forming favorable interactions with extended conformations.
Results
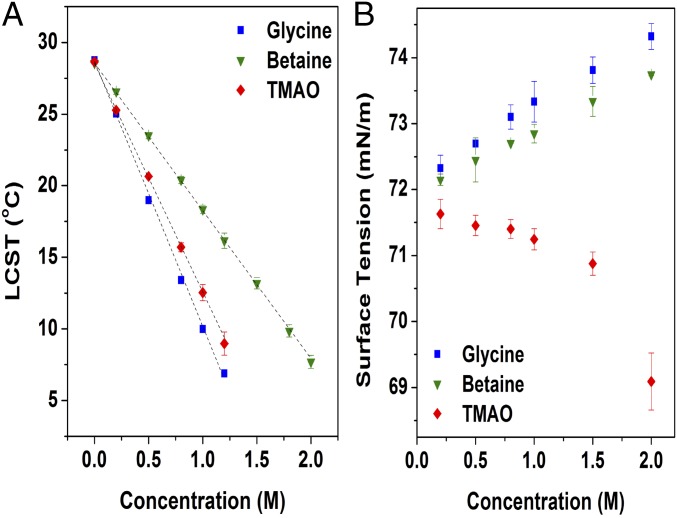
In a first set of experiments, we wished to directly measure the ability of TMAO, glycine, and betaine to stabilize the collapsed state of a thermoresponsive biopolymer. To this end, we measured the LCST of the elastin (VPGVG)120 as a function of concentration for all three osmolytes. Fig. 3A shows that the LCST decreased linearly with cosolvent concentration in each case. Thus, each of these additives shifts the equilibrium toward the collapsed state with respect to the hydrated state. Glycine was the most effective, whereas betaine was the least effective (Table S1). If we were to assume that the osmolytes have similar (or greater) affinity for the surface of the uncollapsed ELP with respect to the collapsed state, then classical preferential interaction theories suggest that all three cosolvents should be strongly depleted from the ELP–water interface (3). However, it is curious that, although TMAO has three methyl groups and appears to be similar in structure to betaine, it actually seems to behave more like glycine in terms of its effect on the ELP.
Fig. 3.
The effect of osmolytes on (A) the ELP LCST and (B) the surface tension of water.
Table S1.
Slopes from the linear fits for Fig. 2
| Property | Glycine | Betaine | TMAO |
| LCST increment () | −18.52 | −10.32 | −15.94 |
| Surface tension increment () | 1.11 | 0.87 | −0.57* |
The slope is determined in the linear regime between 0.2 and 1.5 M TMAO.
We wished to explore the extent to which each of the osmolytes would partition to the air–water interface. Fig. 3B shows surface tension data as a function of cosolvent concentration for each osmolyte. As expected, glycine increases the surface tension more strongly than betaine (30). In stark contrast to the other two osmolytes, however, TMAO decreases the surface tension at the air–water interface. Such a result suggests that TMAO is actually enriched rather than depleted at hydrophobic interfaces. This finding is consistent with previous measurements (3, 17, 31), although it is perhaps puzzling given the fact that TMAO is nearly as effective as glycine at depressing the LCST of the ELP (Fig. 3A). However, as illustrated in Fig. 2, the elastin surface presents both polar amide moieties and hydrophobic surfaces. As such, although the air–water surface tension results suggest that TMAO may accumulate at apolar surfaces, the LCST data could still be consistent with a classical depletion effect if this accumulation at nonpolar surfaces is offset and overcome by an even stronger repulsion from the amide groups (3). Consequently, we performed MD simulations to explore this possibility.
In the following calculations, we described water with the extended simple-point charge model (SPC/E) (32) and TMAO with the popular model by Kast and coworkers (33). We modeled both the ELP fragment and glycine with the CHARMM27 force field (34) while using the correction map (CMAP) (35). We followed the procedure of Ma et al. (36) to parameterize a betaine model that reasonably reproduces experimental measurements of the betaine preferential interaction coefficient with a model peptide. SI Materials and Methods describes our models and simulations in detail. Moreover, SI Materials and Methods indicates that the conclusions of these simulations seem quite robust (Figs. S1–S7).
Fig. S1.
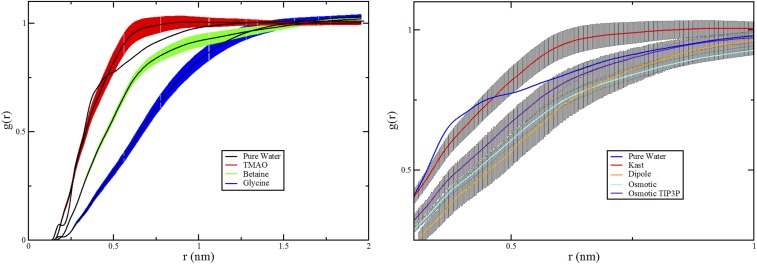
Statistical analysis of simulated atomic RDFs. All curves present results for the CHARMM peptide model. With the exception of the osmotic TIP3P curve, which corresponds to simulations with the TIP3P water model, all curves present results with the SPC/E water model. In Left, the central black lines correspond to the RDFs presented in Fig. 4A, whereas the colored bands indicate the statistical uncertainty. The statistical uncertainty for water is within the thickness of the line. Right compares the statistical uncertainty in the corresponding RDFs from simulations of the various TMAO models with three-site water models. In each case, the statistical uncertainty is obtained as the SE obtained from splitting the simulation trajectory into blocks of 10-ns duration.
Fig. S7.
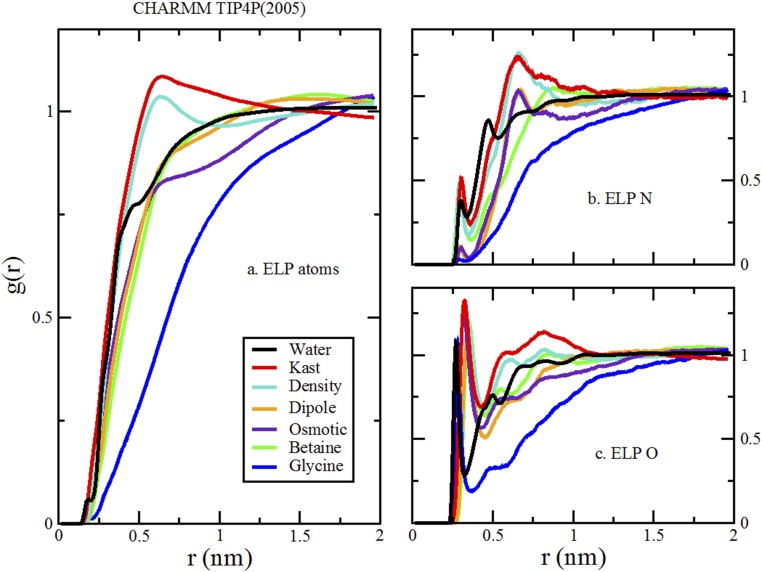
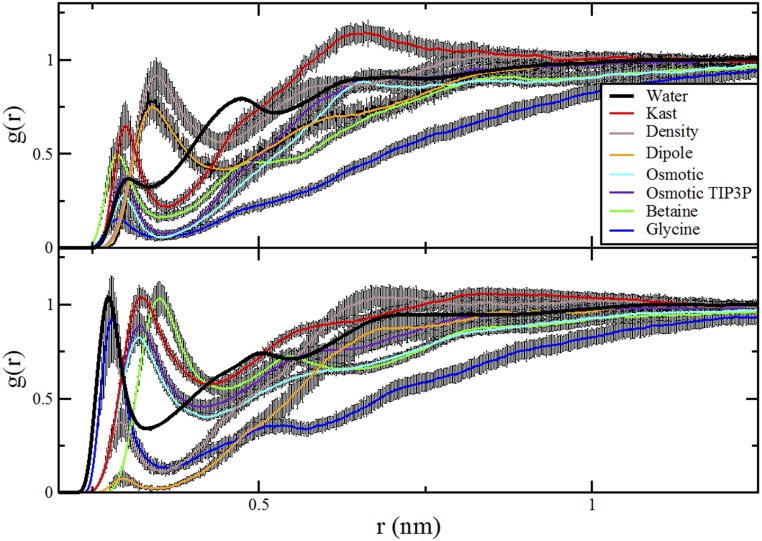
Comparison of RDFs from simulations of various cosolvents and various TMAO models with the TIP4P(2005) water model and CHARMM peptide model. As in Fig. 4, A presents the RDFs for all ELP atoms to all cosolvent or water atoms. B presents the RDFs for the nitrogen atoms of four ELP valine and glycine residues to the oxygen atoms of the cosolvents and water. C presents the RDFs for the carbonyl oxygen atoms of five ELP residues to the nitrogen atom of glycine, the methyl carbon atoms of betaine and TMAO, or the oxygen atom of water.
Fig. S6.
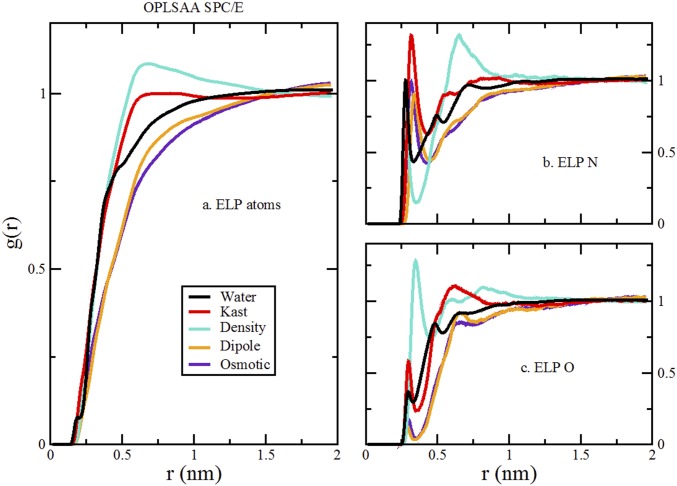
Comparison of RDFs from simulations of various TMAO models with the SPC/E water model and OPLS-AA peptide model. As in Fig. 4, A presents the RDFs for all ELP atoms to all cosolvent or water atoms. B presents the RDFs for the nitrogen atoms of four ELP valine and glycine residues to the oxygen atoms of the cosolvents and water. C presents the RDFs for the carbonyl oxygen atoms of five ELP residues to the nitrogen atom of glycine, the methyl carbon atoms of betaine and TMAO, or the oxygen atom of water.
In a first set of computational experiments, we assessed whether these simulation models were consistent with the experimentally observed trends for air–water interface surface tension measurements. Our simulations with the SPC/E water yielded an air–water interfacial tension value of 58.8 ± 0.15 mN/m, which is consistent with previous results for this model (37, 38), although ∼17% lower than the experimentally measured value. Importantly, the addition of 1 M betaine and 1 M glycine both significantly increased the simulated surface tension to 61.0 ± 0.15 and 60.1 ± 0.20 mN/m, respectively. The addition of 1 M TMAO, in contrast, reduced the simulated air–water surface tension to 58.2 ± 0.20 mN/m (39). Indeed, although the simulated models do not quantitatively reproduce the surface tension measurements, they seem capable of qualitatively reproducing the trend that betaine and glycine both increase the air–water surface tension, whereas TMAO reduces it.
Next, we used MD simulations to investigate the partitioning of the three osmolytes to the ELP–water interface. Accordingly, we simulated a single capped ELP repeat (Fig. 2A) in a 0.55 M solution of each osmolyte. To explore the competition between water and the various cosolvents for the surface of the polymer, we introduced a weak potential that biased the ELP to sample relatively extended conformations.
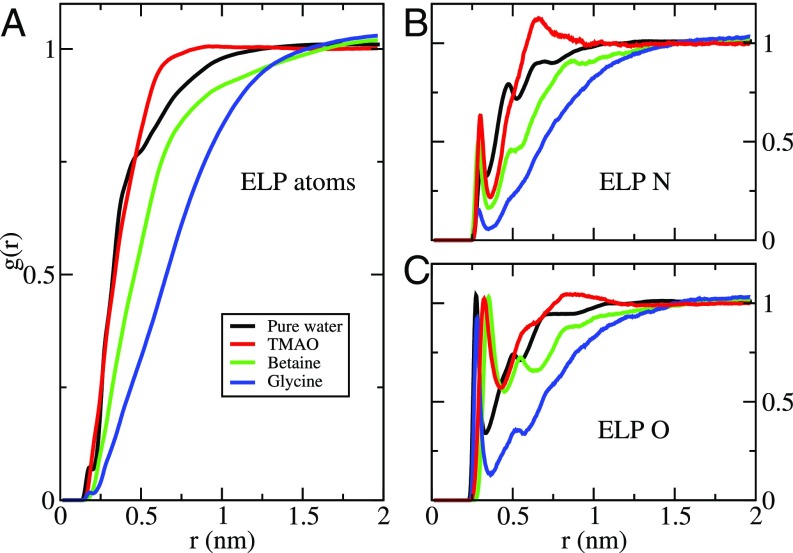
Fig. 4 presents the radial distribution functions (RDFs) quantifying the simulated density of TMAO, betaine, and glycine about the ELP repeat. Although it can form favorable interactions with the ELP backbone carbonyl groups, glycine (blue curves in Fig. 4) is strongly depleted from the ELP surface. Compared with glycine, betaine (green curves in Fig. 4) interacts slightly more favorably with the NH groups of the ELP backbone but is also significantly depleted from the ELP surface. However, Fig. 4 presents strikingly different results for TMAO (red curves in Fig. 4). Although TMAO and betaine show similar affinity for the amide groups along the peptide backbone, TMAO is not depleted from the ELP surface. Instead, as suggested by the surface tension measurements, TMAO actually accumulated slightly at the simulated ELP interface and preferentially solvated the polymer relative to water. In remarkable contrast to the expectations of simple depletion arguments, TMAO seems to stabilize collapsed conformations, despite binding to the polymer.
Fig. 4.
RDFs characterizing the solution around the ELP in pure water (black) and 0.55 M solutions of TMAO (red), betaine (green), and glycine (blue). The RDFs in A were calculated using all atoms from the ELP construct, the cosolvents, and water. B and C characterize the density of hydrogen-bonding groups around the ELP backbone NH and CO sites, respectively. B considered distances from the nitrogen atoms of four ELP valine and glycine residues to the oxygen atoms of the cosolvents and water. C considered distances from the carbonyl oxygen atoms of five ELP residues to the nitrogen atom of glycine, the methyl carbon atoms of betaine and TMAO, or the oxygen atom of water.
Next, we examined whether the influence of osmolytes on the bulk water structure correlated with changes in the relative stability of the collapsed vs. uncollapsed conformation of the ELP. Changes in the OH stretch spectra are often used to probe water structure and in particular, the water hydrogen-bonding environment (40–45). Unfortunately, interpreting the water vibrational spectrum is not straightforward because of strong inter-/intramolecular vibrational coupling. Consequently, a single uncoupled OH stretch vibration for HOD in D2O solution is often used as a hydrogen-bonding network reporter. A red shift in the OH stretch to lower frequency suggests stronger intermolecular hydrogen bonding and weaker intramolecular OH bonds. In particular, OH stretch vibrations centered at 3,200 and 3,400 cm−1 are often empirically associated with more and less structured water, respectively, by comparison with vibrational spectra of ice and liquid water (46–48).
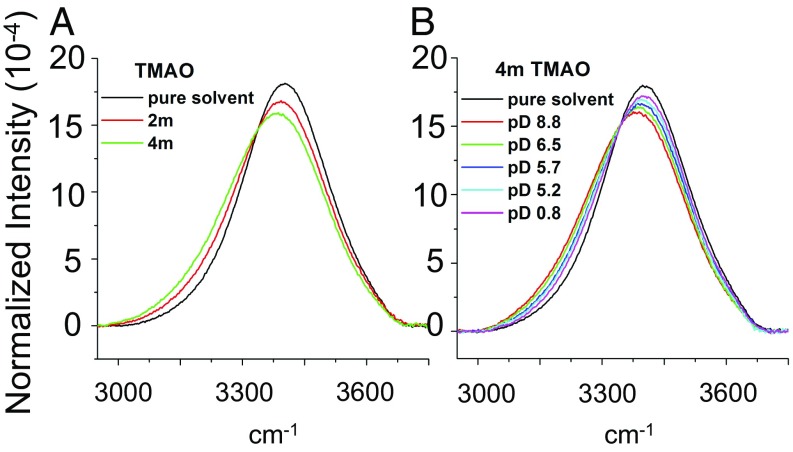
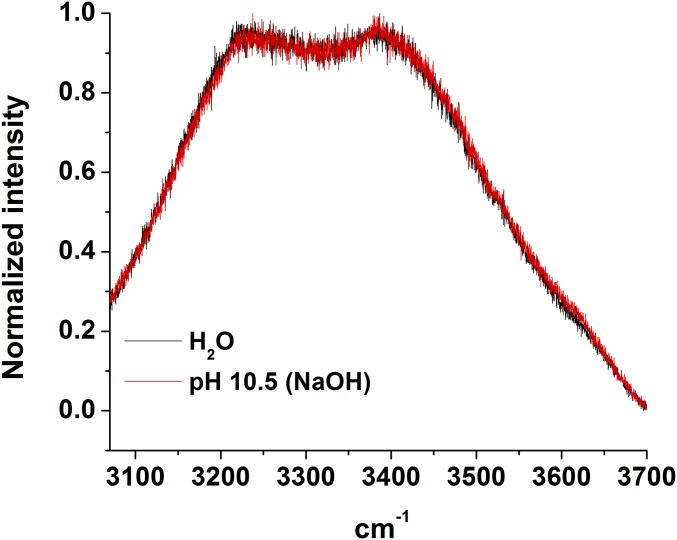
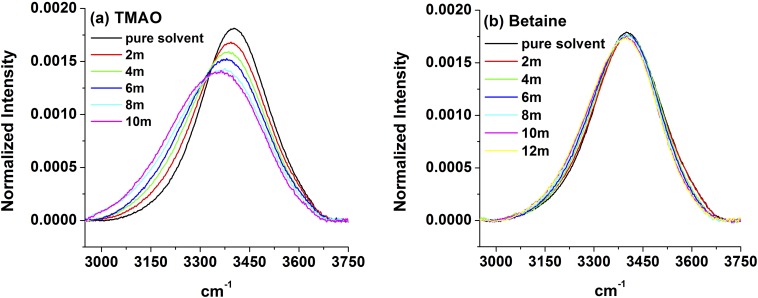
To explore the influence of TMAO on water structure, we performed FTIR measurements of samples containing 0–4 m (molality) TMAO in a 3 mol% H2O in D2O solution (Fig. 5A). As can be seen from the data, the contribution to the intensity at lower frequencies increased with increasing TMAO concentration, whereas the contribution at higher frequencies decreased. We note that, although the solution became increasingly basic as TMAO was added, control experiments with Raman spectroscopy (Fig. S8 and Table S2) indicate that this red shift is not caused by the increasing solution pH. Consequently, the red shift observed in Fig. 5A primarily reflects interactions of water with TMAO itself rather than indirect pH-induced changes that resulted from addition of the osmolyte to solution.
Fig. 5.
IR spectra of 3 mol% H2O in D2O with TMAO as (A) a function of osmolyte concentration and (B) a function of pD at 4 M TMAO. In all cases, the spectra have been normalized to have the same area under each curve. The spectrum for pure water is shown in each case as a reference. Spectra in the OH stretch range over a wider range of TMAO concentrations are provided in SI Materials and Methods (Fig. S9).
Fig. S8.
Normalized Raman spectra in the OH stretch region of pure water and an aqueous solution that was adjusted to pH 10.5 by adding NaOH. As can be seen, the two spectra completely overlap with each other within experimental error.
Table S2.
pH values of aqueous osmolyte solutions
| Concentration (M) | Glycine | Betaine | TMAO |
| 0.5 | 6.19 | 6.73 | 7.97 |
| 1 | 6.22 | 6.86 | 8.15 |
| 1.5 | 6.23 | 7.14 | 8.29 |
| 2 | 6.33 | 7.25 | 8.44 |
| 3 | 7.71 | 8.83 | |
| 4 | 8.06 | 9.22 | |
| pKa | 2.35/9.78 | 1.83 | 4.65 |
Fig. S9.
Normalized IR spectra of various osmolyte concentrations at OH stretch vibration frequency region in isotope-diluted water (3 mol% H2O:97% D2O). (A) TMAO. (B) Betaine.
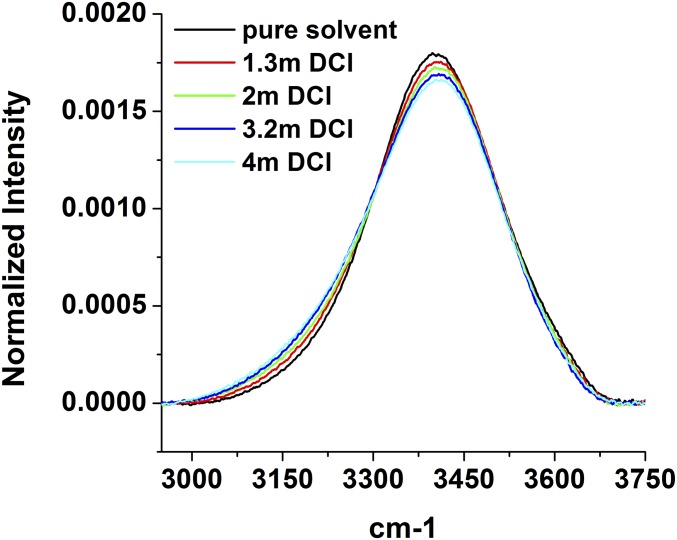
Next, we wished to determine if the changes in the OH stretch region of the IR spectra in Fig. 5A were more sensitive to the methyl groups of TMAO or the NO dipole. Accordingly, the sample at 4 M TMAO was studied as a function of pD (the scale for the negative log of the deuteriuim ion concentration in solution) from 8.8 down to 0.8 (Fig. 5B). The pD value was adjusted by adding DCl to acidify the solution. It should be noted that the pD values were determined with a standard pH meter and recorded as pD = pH + 0.4 (49). Significantly, as the pD value was decreased, the spectrum continuously blue-shifted toward the spectrum for pure water (black curve in Fig. 5B). Because the pKa of TMAO is 4.65 (50), the osmolyte became increasingly deuterated as the solution was acidified. Thus, Fig. 5B indicates that deuteration of TMAO negated the red shift because of the addition of TMAO. Consequently, we conclude that the TMAO-induced red shift in the OH spectra is very sensitive to hydrogen bonding of water to the lone pairs on TMAO’s oxygen and affected only to a minor extent by the methyl groups. Additional control experiments show that acidification caused the OH spectrum to red shift (Fig. S10). Consequently, the pronounced blue shift observed in Fig. 5B was being partially masked by a competing red shift that results from an increasingly stronger water H-bonding network as the solution was acidified. Therefore, we conclude that direct hydrogen bonds between water and the TMAO oxygen atom make the predominant contribution to the observed spectral shifts.
Fig. S10.
Normalized IR spectra of DCl at various concentrations.
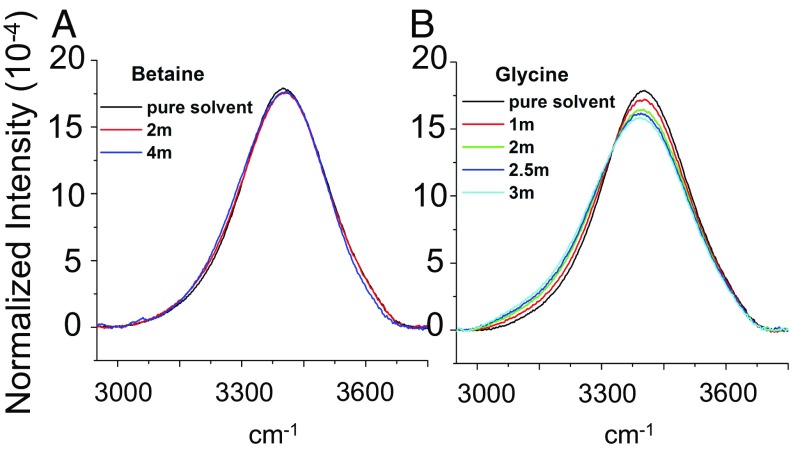
We also obtained FTIR spectra in the presence of betaine (Fig. 6A) and glycine (Fig. 6B). It should be noted that betaine causes the pH of water to rise but to a lesser extent than TMAO (Table S2). Also, because glycine is somewhat less soluble than betaine, we obtained data only up to 3.0 M glycine. Interestingly, the OH peak hardly shifted as betaine was added to solution, but glycine caused much more pronounced changes as observed for TMAO. These data provide additional evidence that the osmolyte methyl groups are not the primary origin for the observed red shift in the OH stretch spectra. Indeed, like TMAO, betaine has three methyl groups, whereas glycine has none. Nevertheless, changes in the OH stretch spectra almost certainly reflect a combination of hydrogen bonding to the oxygen lone pairs (carboxylate moieties on betaine and glycine), hydrophobic hydration of the methyl groups, and potentially, any additional very small bulk water contributions that might arise beyond the inner hydration shells. However, because glycine and TMAO cause a substantial shift in the water peak, whereas betaine does not, it would seem that changes to the OH spectrum are not well-correlated with the stabilization or destabilization of the collapsed vs. extended conformations of ELPs.
Fig. 6.
OH stretch peak from the FTIR spectra for (A) betaine and (B) glycine as a function of osmolyte concentration. The data represent 3 mol% H2O and 97% D2O.
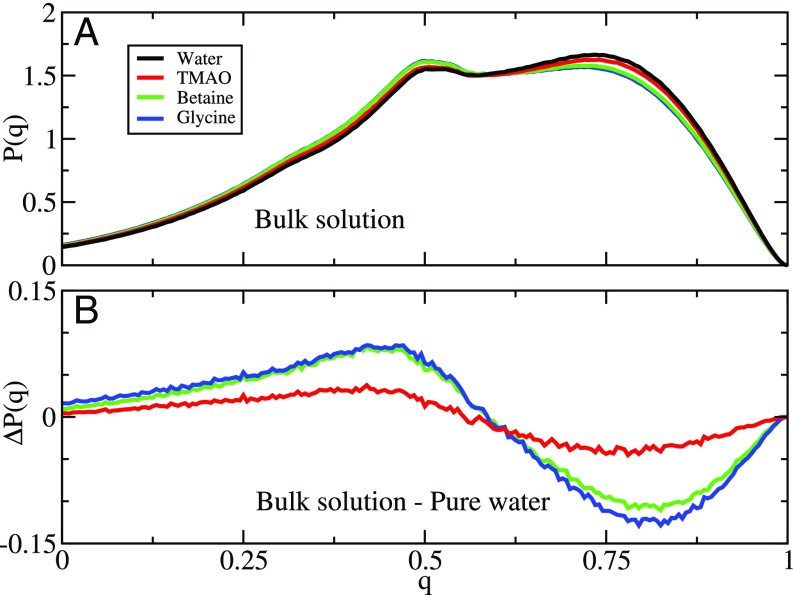
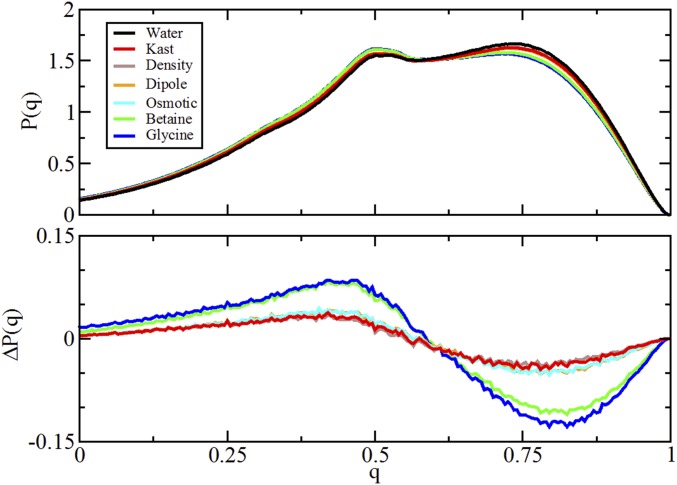
We also used MD simulations to directly examine the effect of each osmolyte on the water structure. In particular, Fig. 7 quantifies the impact of each osmolyte on the tetrahedrality of the water hydrogen-bonding network (51). Fig. 7A presents the probability distribution of tetrahedral order (q) sampled by water molecules. In each osmolyte solution, there exists a population of water molecules with a relatively ordered H-bonding solvation shell (q ∼ 0.75) and a second population of water molecules with a relatively disordered H-bonding solvation shell (q ∼ 0.5). Fig. 7B quantifies the change in P(q) caused by each osmolyte. All of the osmolytes disrupt the intermolecular hydrogen-bonding network, although they exert differing effects. TMAO seems to have relatively little impact on the H-bonding network. Betaine has a considerably larger effect, whereas glycine is most disruptive to the hydrogen-bonding network. Consequently, our MD simulations provide additional evidence that the red shifts observed in the IR spectra primarily reflect direct osmolyte–water interactions rather than indirect effects on the hydrogen-bonding network, which should, instead, blue-shift the spectra.
Fig. 7.
Characterization of the tetrahedral-order parameter, q, quantifying the hydrogen-bonding network around water molecules in pure water (black) and 0.55 M solutions of TMAO (red), betaine (green), and glycine (blue). A presents the distribution P(q) sampled by bulk water molecules in each solution. B presents the difference between the distributions sampled by the bulk solution in the absence and presence of each cosolvent. Fig. S11 presents similar results for other TMAO models.
Fig. S11.
Comparison of simulated tetrahedral-order distribution from simulations of various TMAO models and cosolvents in SPC/E water. Upper presents the distribution P(q) sampled by bulk water molecules in each solution. Lower presents the difference between the distributions sampled by the bulk solution in the absence and presence of each cosolvent.
SI Materials and Methods
Simulation Methods.
Simulation models.
Water.
All simulations reported in the text explicitly modeled water with the SPC/E potential (32). Here, we also present results from simulations using the TIP3P (transferable intermolecular potential 3 points) (55) and TIP4P(2005) [transferable intermolecular potential 4 points (2005)] (56) water models.
TMAO.
All simulations reported in the text modeled TMAO with the potential developed by Kast et al. (33). Here, we also present results from simulations using three more recent TMAO models: the osmotic model developed by Garcia and coworkers (11), the density model developed by Larini and Shea (12), and the dipole model developed by Netz and coworkers (14).
Glycine.
In all cases, glycine was modeled as a zwitterion with CHARMM27 parameters (34) as implemented in Gromacs 4.5.3 (57).
Elastin.
The elastin-like fragment, VPGVG, was capped at the N and C termini with an acetyl and an N-methyl group, respectively. All simulations reported in the text modeled this ELP fragment with parameters from the CHARMM27 force field (34) while including the CMAP correction (35). Here, we also present results from simulations using the OPLS-AA (optimized potential for liquid simulations—all atom) model (58) for the ELP fragment.
Betaine.
Ma et al. (36) previously parameterized a model for betaine that was based on the CHARMM27 force field parameters for the choline head group of POPC (1-palmitoyl-2-oleoyl-sn-glycero-3-phosphocholine) lipids. Because the choline head group lacks a carboxyl group, Ma et al. (36) initially modeled the carboxyl group of betaine with the CHARMM27 force field parameters for the carboxyl group of the glycine zwitterion. They tested this model in simulations of a ternary mixture of water, triglycine, and betaine. In these simulations, they modeled water with the TIP3P potential (55) and triglycine with the CHARMM27 force field parameters for a zwitterionic (uncapped) triglycine peptide. However, Ma et al. (36) observed that this simulation model provided a qualitatively incorrect description of the experimentally measured preferential interaction coefficient, , describing the interaction between betaine and the tripeptide. After uniformly reducing the charges of the betaine model, the simulation model qualitatively reproduced the experimental measurement for the preferential interaction coefficient (59).
SPC/E provides a significantly better description of water than the TIP3P model (60). In particular, although the SPC/E model underestimates the air–water surface tension by >10%, the TIP3P model generates a significantly lower surface tension (38). Our preliminary studies indicated that simulations with TIP3P and the betaine model by Ma et al. (36) provided a similarly poor description of the air–water surface tension for water–betaine solutions. Not surprisingly, our preliminary studies also suggested that, combined with the CHARMM27 model for triglycine and the SPC/E model for water, the betaine model by Ma et al. (36) predicted a spurious accumulation of betaine about the triglycine peptide. Accordingly, we adopted the procedure of Ma et al. (36) to reparameterize the betaine charges for consistency with the CHARMM27 peptide model and SPC/E water model.
Notably, in the model by Ma et al. (36) for betaine, the carboxyl oxygens are assigned charges that are significantly smaller (in absolute magnitude) than both the CHARMM27 charges for the carboxyl oxygens of the glycine zwitterion and the charges predicted from quantum chemical calculations performed by Ma et al. (36). Because SPC/E water shows significantly greater cohesion than TIP3P (60), we reasoned that increasing these charges would increase the solubility of betaine in SPC/E water and thus, provide a more accurate description of the preferential interaction coefficient for betaine interacting with model peptides in SPC/E water. Accordingly, we restored the charges for the betaine carboxyl oxygens to the CHARMM27 values for the carboxyl oxygens of the glycine zwitterion. To maintain overall neutrality, we adjusted the atomic charges of atoms within two bonds of these oxygens. We did not modify any other potential parameters. The following table compares the charges for the betaine model by Ma et al. (36) with the charges used in this work.
| Atom | Ma et al. (36) (e) | This work (e) |
| Nitrogen | −0.468 | −0.468 |
| CH3 carbon | −0.273 | −0.273 |
| CH2 carbon | −0.078 | −0.077 |
| Hydrogen | 0.195 | 0.195 |
| Carboxyl carbon | 0.265 | 0.559 |
| Carboxyl oxygen | −0.523 | −0.670 |
To validate these charges, we determined the preferential interaction for the interaction between betaine and a zwitterionic triglycine peptide:
In this expression, is the fluctuating instantaneous number of betaine molecules that are directly solvating the triglycine peptide in its first solvation shell, is the fluctuating instantaneous number of betaine molecules in the bulk solution (i.e., not in the first solvation shell), and is the (constant) total number of simulated betaine molecules. Similarly, and are the fluctuating instantaneous numbers of water molecules in the peptide solvation shell and the bulk solution, respectively. The angular brackets denote a canonical ensemble average evaluated as a time average over a 200-ns simulation in a 4 × 4 × 4-nm box with 52 betaine molecules, a single triglycine peptide, and 1,786 SPC/E water molecules, which corresponds to a 1.34 M solution. Ma et al. (36) defined the peptide solvation shell based on a cutoff distance R = 8 Å from the peptide surface. In principle, for sufficiently large R, should eventually converge to an R-independent value. However, given the finite duration and size of our simulation, we found that the preferential interaction coefficient varied somewhat with R. In the following table, we present the calculated preferential interaction coefficient Γ23 for three different definitions of the first solvation shell (R = 8, 10, and 12 Å). Importantly, for each definition of the solvation shell, the reparameterized model correctly predicts that betaine is depleted from the peptide. Moreover, in the case of the largest solvation shell, the reparameterized model accurately reproduces the experimental measurement .
| R (Å) | Γ23 |
| 8 | −0.01 |
| 10 | −0.11 |
| 12 | −0.16 |
We note that the calculated preferential interaction coefficients reflect the sensitivity of the peptide model to the water model. Indeed, we observed that the peptide samples different conformation ensembles in TIP3P and SPC/E water. In particular, the peptide samples conformations with larger radius of gyration, Rg, in SPC/E water than in TIP3P water. This result was not surprising, because the larger magnitude of the charges in SPC/E will better solvate the charged ends of the zwitterionic solute.
Finally, we note that, compared with the betaine model by Ma et al. (36) (combined with TIP3P water), the reparameterized betaine model (combined with SPC/E water) provides a significantly improved description of the air–water surface tension. In particular, whereas the model by Ma et al. (36) generates a surface tension of 50.71 mN/nm, the reparameterized model generates a surface tension of 61.66 mN/nm, which is considerably closer to the experimentally measured value of 71.73 mN/nm for a 1 M solution of betaine in water at 300 K.
Simulation protocols.
We report MD simulations under two different conditions. We performed simulations of a single molecule of the ELP construct in water and three different water–osmolyte solutions. Additionally, we also performed simulations of the liquid–vapor interface for each of the water–osmolyte solutions. All simulations were performed with the GROMACS 4.5.3 software package under 3D periodic boundary conditions (57). Dynamics were propagated according to the stochastic dynamics algorithm with a 2-fs time step (61). The intramolecular bonds of water were rigidly constrained with the SETTLE algorithm (62). The bond lengths of the ELP hydrogens were constrained using the LINCS (linear constraint solver) algorithm (63). The particle mesh Ewald algorithm was used to treat long-ranged electrostatic interactions with a relatively high resolution Fourier grid spacing of 0.08 nm (64). Lennard–Jones interactions and the short-range contribution to electrostatic interactions were both truncated at 1.2 nm. The initial configuration for each simulation was energy-minimized via the steepest descent algorithm. This configuration was then annealed from 0 to 500 K and then, to 298 K over the course of a 5-ns simulation at constant volume. The resulting configuration was then equilibrated at constant temperature of 298 K for an additional 5 ns.
We performed MD simulations of the ELP construct (described above) under four different solvent conditions: pure water, 0.55 M TMAO in water, 0.55 M betaine in water, and 0.55 M glycine in water. Each system was prepared in a cubic box with sides of 4.0 nm. In each simulation, the ELP construct was biased to sample relatively extended conformations by an umbrella potential (with a spring constant of 200 kJ/mol nm2) that was applied to the mass centers of the terminal caps. This potential biased the two caps to move in parallel planes that were separated by z = 12.0 Å, such that the ELP construct sampled conformations with an average end to end distance of ∼75% of its maximum extension. After equilibration according to the procedure described above, each system was simulated with the Parrinello–Rahman barostat (65) for 100 ns at a constant temperature (T) of 298 K and a constant pressure (P) of 1 atm, i.e., in the constant NPT ensemble.
We used a slightly different procedure to equilibrate the ELP system in pure water. In this case, the above equilibration and simulation protocols were first applied for the ELP construct in a cubic box with sides of 3.0 nm. This box was then resolvated in a cubic box with sides of 4.0 nm. The resulting system was equilibrated for 5 ns in the constant NPT ensemble at a temperature of 298 K and a pressure of 1 atm according to the Parrinello–Rahman barostat. This system was then simulated for 40 ns in the constant NPT ensemble as described above.
We also performed MD simulations of the liquid–vapor interface for water and each of the water–osmolyte solutions. Each liquid system was initially prepared in a cubic box with sides of 4.0 nm. This simulation box was equilibrated at constant volume (V) and temperature, i.e., in the constant NVT ensemble, according to a similar procedure as described above. The box was then equilibrated in the constant NPT ensemble, during which the box slightly contracted in each dimension. Finally, the box was expanded an additional 40 nm in the z direction and simulated for 30 ns in the constant NVT ensemble. We used the last 25 ns of these simulations to estimate the surface tension. In these simulations of the liquid–vapor interface, Lennard–Jones interactions and the short-range contributions to electrostatic interactions were both truncated at 1.3 nm, whereas long-ranged electrostatic interactions were modeled by the particle mesh Ewald algorithm with a standard Fourier grid spacing of 0.12 nm. The simulated conditions and results for the pure water system are quite similar to those previously reported by Chen and Smith (37). From these simulations, we used Gromacs utilities to determine the surface tension from the difference between normal and parallel components of the pressure tensor. We note that, although the graphical interface for Gromacs 4.5.3 provides incorrect estimates of the pressure tensor, the reported values are determined from the correct raw data.
Simulation analysis.
We used standard Gromacs utilities to compute RDFs to characterize the density of water and cosolvents (S) about the ELP construct:
In calculating the RDF for Fig. 4A, the first sum is over the atoms of the ELP construct, whereas the second sum is over the atoms of cosolvent (or water) molecules, and is the distance between each pair. The RDF is normalized by the density of water or cosolvent atoms (i.e., those included in the second sum) within the cutoff distance considered in calculating the RDF. In contrast, we used heavy atoms in defining the RDF for hydrogen-bonding groups. In particular, Fig. 4B considers the amide N atom for the valine and glycine residues (i.e., we excluded the proline N atom) of the ELP construct combined with the O atoms of the cosolvents. Similarly, Fig. 4C considers the carbonyl O atom of each ELP residue combined with the N of glycine or the methyl carbons of betaine and TMAO. Both Fig. 4 B and C use the water O atom.
Below, we present results for the preferential interaction coefficient from simulations of various osmolyte–ELP models. We calculated these preferential interaction coefficients Γ23 from RDFs according to ref. 66:
where ρ3 is the number density of the osmolyte, g3(r) is the RDF between all of the osmolyte atoms and all of the ELP atoms, and g1(r) is the RDF between all of the water atoms and all of the ELP atoms. Because r goes to infinity, both RDFs should go to one. Because our simulations reflect finite-size effects, the RDFs are close to but not exactly one at large r. The slight differences between g3 and g1 at these distances are sufficient to impact the calculation, because the difference is weighted by r2. Therefore, in practice, we evaluated the integral from zero to rx, where rx is the distance at which g1 and g3 intersect and both are close to one.
In addition, we report simulated distributions characterizing the tetrahedral hydrogen-bonding network of the solvent. For each relevant water molecule, i, the local tetrahedral-order parameter (51) is defined as
where j and k are summed over combinations of the four nearest water molecules having oxygen atoms within 3.6 Å of water molecule I, and is the angle formed by the oxygen atoms of molecules j and k with the oxygen atom of the central molecule i. The probability distributions P(q) in the text present distributions of qi sampled by water molecules in the “bulk” solution. In our calculations, water molecules are in the bulk region when their oxygen atom is more than 1 nm from any atom of the ELP fragment. Note that our definition does not treat water molecules with less than four water molecules within 3.6 Å.
Convergence analysis.
In this section, we assess the convergence of our peptide–cosolvent MD simulations. We decomposed each 100-ns trajectory into disjoint 10 blocks, with each block corresponding to 10 ns of simulation. We calculated the RDFs for each block. We then determined the uncertainty in the RDFs as the SE for these 10 estimates of the RDFs (i.e., one-third the SD in the RDF at each distance). (In the case of simulations without osmolytes, we decomposed the 40-ns trajectory into four blocks and calculated the corresponding SE.)
Fig. S1, Left presents the SE for the RDFs presented in Fig. 4A. In Fig. S1, Left, the black lines correspond to the RDFs presented in the text, which also correspond to the mean RDF estimated from 10 blocks. The colored bands in Fig. S1, Left indicate the statistical uncertainties at each point. The uncertainty in the RDF for pure water is within the width of the line. Although the RDFs show a certain amount of statistical uncertainty, they clearly are sufficiently converged to show the qualitative trend that TMAO weakly accumulates at the peptide surface.
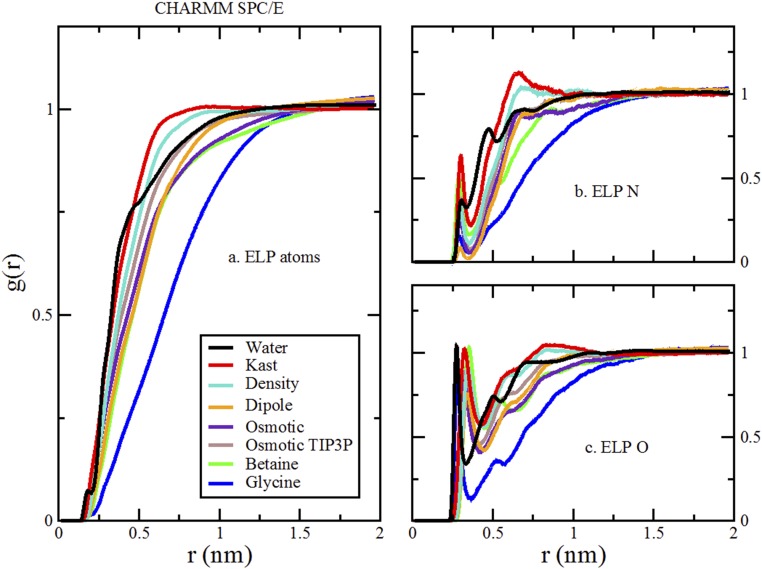
Fig. S1, Right presents a similar analysis of the statistical uncertainty in simulations with the other TMAO models. In Fig. S1, Right, all curves present results with the CHARMM ELP model. The curve labeled “osmotic TIP3P” presents results for simulations of the osmotic TMAO model with the TIP3P water model, whereas the remaining curves present results for simulations of the various TMAO models with the SPC/E water model. In Fig. S1, Right, the colored lines indicate the simulated RDFs, whereas the black error bars indicate the estimated statistical uncertainties. This panel focuses on distances 0.3 nm < r < 1.0 nm to clearly compare the relative affinity of each TMAO model with the CHARMM ELP model. The results for the density model have been deleted from Fig. S1, Right, because they significantly overlap with the Kast model results. Despite the statistical uncertainty, the simulations clearly show that the dipole and osmotic models are qualitatively depleted from the ELP surface.
Fig. S2 presents a similar statistical analysis for the RDFs corresponding to Fig. 4 B and C, which characterizes the hydrogen-bonding interactions of the various osmolyte models with the CHARMM model for the ELP fragment. As in Fig. S1, Right, all curves in Fig. S2 correspond to the SPC/E water model, except for the osmotic TIP3P curve, which corresponds to the TIP3P water model. Also, as in Fig. S1, Right, the colored curves in Fig. S2 indicate the RDFs, whereas the black bands indicate the statistical uncertainties in the RDFs at each distance.
Fig. S2.
Statistical analysis of simulated hydrogen-bonding RDFs that are presented in Fig. 4 B and C. All curves present results for the CHARMM peptide model. With the exception of the osmotic TIP3P curve, which corresponds to simulations with the TIP3P water model, all curves present results with the SPC/E water model. The colored curves present the simulated RDFs, whereas the black bands indicate estimates of the simulated uncertainty. In each case, the statistical uncertainty is obtained as the SE obtained from splitting the simulation trajectory into blocks of 10-ns duration.
In summary, Figs. S1 and S2 indicate that the simulated results presented in the text are robust with respect to the statistical uncertainty of the simulations.
Robustness of simulated results.
In this section, we assess the robustness of our simulated conclusions with respect to details of the simulation model. We have performed an array of simulations with various models for TMAO, water, and the peptide. This array of simulations leads to the following general and robust conclusion. Simulation models for osmolytes that reduce the air–water surface tension are not depleted from the peptide surface. Conversely, simulation models for osmolytes that increase the air–water surface tension are depleted from the peptide surface.
We compare results for simulations with the four TMAO models that are most commonly used in the literature—the Kast model developed by Berry and coworkers (33), the osmotic model developed by Garcia and coworkers (11), the density model developed by Larini and Shea (12), and the dipole model developed by Netz and coworkers (14). We considered both the CHARMM and OPLS-AA models for our peptide. Finally, our simulations were performed with the SPC/E, TIP3P, and TIP4P(2005) models for water.
We first consider three-site water models, because these models are almost exclusively used in TMAO simulations. More importantly, the various TMAO models were parameterized for consistency with three-site water models. We focus on the SPC/E water model, because Vega and Abascal (60) showed that it is one of the most realistic nonpolarizable water models. For each of the TMAO models, we first determined its effect on the liquid–vapor surface tension, Δγ, for the SPC/E model. We then calculated the preferential binding coefficient, Γ, for each TMAO model with both the OPLS-AA and the CHARMM models for the ELP fragment. Additionally, because the osmotic model was parameterized for consistency with the TIP3P water model, we also performed simulations of the osmotic model with TIP3P and the CHARMM force field. We present results for betaine and glycine as well.
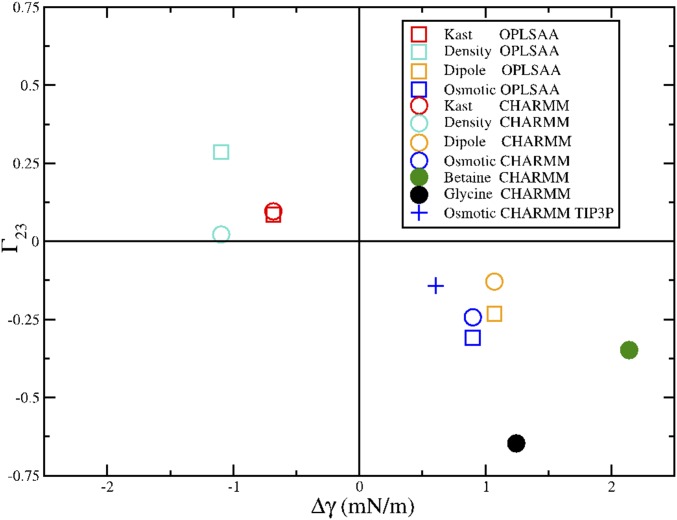
Fig. S3 presents a scatterplot of Δγ and Γ calculated from these simulations. This figure shows very strong evidence supporting our hypothesis. Every simulation model that reduces the liquid–vapor surface tension of water also preferentially binds to the peptide (top left quadrant in Fig. S3). Conversely, every simulation model that increases the liquid–vapor surface tension is depleted from the peptide (bottom right quadrant in Fig. S3). This conclusion is consistent across simulations with the SPC/E and TIP3P water models, four different TMAO models, and two different peptide models.
Fig. S3.
Scatterplot correlating the effect of various TMAO models on the liquid–vapor surface tension, Δγ, with their preferential binding coefficient, Γ, for the ELP fragment. The filled circles indicate simulations with betaine and glycine, whereas the open symbols indicate simulations with various TMAO models. Circles indicate peptide simulations with the CHARMM peptide model, which corresponds to the results in the text, whereas squares indicate simulations with the OPLS-AA peptide model. With the exception of the symbol +, which corresponds to simulations of the osmotic model with the TIP3P water model, all simulations were performed with the SPC/E water model.
To further explore the robustness of these conclusions, we have also performed simulations with the TIP4P(2005) water model. Although TIP4P(2005) is a superior model for reproducing the physical properties of pure water, none of the TMAO models have been parameterized with TIP4P(2005). Thus, we expect these simulations to provide a less realistic description of water–TMAO interactions. In particular, the TIP4P(2005) water model has much greater cohesion than typical three-site water models, such as SPC/E or TIP3P. Consequently, one expects that the TIP4P(2005) model will tend to expel molecules from bulk water unless they have been explicitly parameterized for TIP4P(2005). As shown below in Fig. S4, such expulsion is indeed the case.
Fig. S4.
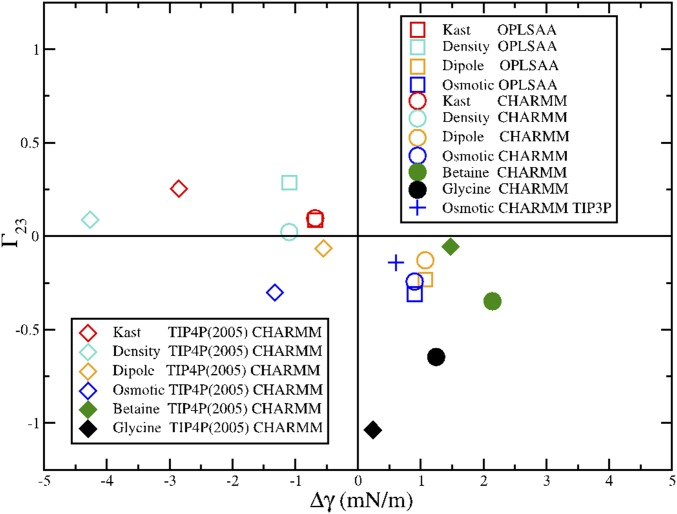
Scatterplot correlating the effect of various TMAO models on the liquid–vapor surface tension, Δγ, with their preferential binding coefficient, Γ, for the ELP fragment. The filled symbols indicate simulations with betaine and glycine, whereas the open symbols indicate simulations with various TMAO models. Diamonds indicate simulations with the CHARMM peptide model and the TIP4P(2005) water model. The remaining symbols are the same as in Fig. S3. Circles indicate peptide simulations with the CHARMM peptide model, which corresponds to the results in the text, whereas the squares indicate simulations with the OPLS-AA peptide model. The symbol + indicates simulations of the osmotic model with the TIP3P water model and the CHARMM peptide model.
Fig. S4 presents the scatterplot of Δγ and Γ from simulations with both three- and four-site water models. Each osmolyte model generates a greater reduction (or a reduced increase) in the vapor–liquid surface tension for the TIP4P(2005) water model than for the SPC/E water model [i.e., −Δγ(SPC/E) < −Δγ(TIP4P2005)]. Consequently, the dipole model and the osmotic model both reduce the vapor–liquid surface tension for TIP4P(2005) while still being slightly depleted from the peptide. Nevertheless, in the majority of cases, we still see the same correlation between Δγ and Γ in simulations with TIP4P(2005). As noted above, we consider the results for TIP4P(2005) to be less reliable, because none of the osmolyte models were parameterized for consistency with TIP4P(2005).
Finally, Figs. S5–S7 present the RDFs from the simulations with various models for comparison with Fig. 4.
Fig. S5.
Comparison of RDFs from simulations of various cosolvents and TMAO models with the SPC/E water model and CHARMM peptide model. The brown curves are distinct and present results for the osmotic model with the TIP3P water model. As in Fig. 4, A presents the RDFs for all ELP atoms to all cosolvent or water atoms. B presents the RDFs for the nitrogen atoms of four ELP valine and glycine residues to the oxygen atoms of the cosolvents and water. C presents the RDFs for the carbonyl oxygen atoms of five ELP residues to the nitrogen atom of glycine, the methyl carbon atoms of betaine and TMAO, or the oxygen atom of water.
In summary, these results show that the conclusions from our simulations are quite robust. In all simulations with three-site water models, we observe that osmolytes that reduce the air–water surface tension also preferentially bind to the ELP fragment. We also observe this correlation in almost all simulations with the TIP4P(2005) water model. Thus, we conclude that the simulations provide robust evidence that TMAO is not significantly depleted from the ELP fragment.
Materials and Experimental Methods.
TMAO (98+%) was purchased from Alfa Aesar. Glycine (>99%) and betaine (>99.0%) were purchased from Sigma-Aldrich. D2O (99.9% D) was obtained from Cambridge Isotope Laboratories, whereas HCl came from Fluka, and NaOH and DCl came from Sigma-Aldrich. Purified water was produced with a NANOpure Ultrapure Water System (Barnstead). IR measurements were made with a Nicolet 470 FTIR Spectrometer equipped with a Pike Miracle ATR attachment containing a diamond-coated single-bound ZnSe crystal (Pike Technologies) and an MCT (mercury–cadmium–telluride) detector (Thermo Electron Corp.). Surface tension measurements were made with a Force Tensiometer (Sigma 701; Biolin Scientific).
Discussion
TMAO, betaine, and glycine act as protecting osmolytes that stabilize the collapsed state of ELPs. As would be expected from prevailing preferential solvation theories for cosolvent effects, glycine and betaine are significantly depleted from the surface of the well-hydrated, uncollapsed state of the ELP. Indeed, both MD simulations and air–water surface tension measurements are consistent with this conclusion. By sharp contrast, however, these same measurements suggest that TMAO actually slightly accumulates at the surface of the uncollapsed state. Such a result is still consistent with basic statistical thermodynamics for preferential solvation as long as TMAO is even more accumulated at the surface of collapsed ELPs.
Interestingly, Berne and coworkers (17, 18) have recently observed similar results for hydrophobic polymers, such as polystyrene and simulated polymers of uncharged Lennard–Jones beads. In particular, they suggested that TMAO accumulates at the surface of extended hydrophobic polymers but still stabilizes collapsed conformations, because TMAO accumulates to an even greater extent at the surface of the collapsed polymer (17, 18). However, in contrast to the purely hydrophobic polymers studied by Berne and coworkers (17, 18), we have studied ELPs, which are polypeptides with backbone amide groups. In fact, glycine residues, which lack a hydrophobic side chain, account for 40% of the amino acids in the studied ELP systems. Thus, if TMAO is repelled from polypeptide backbones and if we assume that collapsed ELP conformations completely bury their hydrophobic groups while exposing their polar backbone, then it is rather difficult to envision why TMAO would accumulate to an even greater degree about collapsed ELP conformations. It is certainly possible, however, that ELPs adopt collapsed conformations that bury some of their polar backbone by forming beta hairpins and other hydrogen-bonding secondary structures (52). Consequently, the collapsed conformations may actually expose a relatively larger fraction of their hydrophobic surface compared with the extended conformation, which may then trigger the formation of large, insoluble ELP aggregates.
These considerations also suggest a possible mechanism for the stabilizing effect of TMAO on globular proteins by interacting more favorably with folded than unfolded conformations. First of all, protein folding generally sequesters the peptide backbone from the solvent. Because TMAO interacts unfavorably with the peptide backbone (9, 10), it will provide a stabilizing effect for any protein (19). Second, although it is generally accepted that hydrophobic forces provide the dominant driving force for protein folding (53), folded proteins do not completely sequester all hydrophobic groups from the solvent. Instead, the resulting surface of folded proteins is a heterogeneous patchwork that exposes both polar and nonpolar moieties (54). Water molecules likely outcompete TMAO for the polar features when these regions are isolated. However, because TMAO has a significant dipole and also forms favorable interactions with hydrophobic surfaces (2, 3, 9, 10, 14), it may be that amphiphilic TMAO molecules more effectively interact with the protein when polar and nonpolar regions are brought into close proximity on the surface of a folded protein. Because folded protein surfaces emerge as the coalescence of nonpolar and polar groups from many different amino acids, one can imagine that this stabilizing mechanism is both quite general for globular proteins and also, quite difficult to quantify or predict from consideration of individual amino acids, assumptions of additive behavior, short peptide constructs, or even, studies of backbone mimics.
In addition, our studies also provide insight into the effect of osmolytes on water structure. Our FTIR experiments indicate that TMAO generates a particularly large red shift in the OH spectrum, which is consistent with the strong water–TMAO interactions observed in experiments (25) and MD simulations (26). Our FTIR experiments show that glycine produces a similar red shift, whereas betaine minimally impacts the OH stretch spectra. Thus, these red shifts seem essentially uncorrelated with the stabilizing effects of osmolytes on the hydrophobic collapse of ELPs. Additionally, by varying the pH, we have shown that the TMAO-induced red shift is very sensitive to direct H-bonding interactions between water and the lone pairs of the TMAO oxygen. In particular, this red shift is not caused by the effect of the cosolvents on the solution pH. Moreover, as previously observed by Gai and coworkers (22, 23), our MD simulations indicate that the osmolytes all disrupt rather than strengthen the water tetrahedral H-bonding network, although TMAO seems the least disruptive to the water network (19, 26). Consequently, we conclude that the observed red shifts primarily reflect direct interactions between water and the osmolytes. Indeed, if the effects of the osmolytes on the water–water hydrogen-bonding network were to predominate the IR spectrum, then we would expect a blue shift in the OH stretch spectra. These results refute the notion that osmolytes indirectly stabilize proteins by altering water structure [i.e., through kosmotropic (structure-making) or chaotropic (structure-breaking) effects (21)].
Conclusions
Herein, we have shown that TMAO, like glycine and betaine, stabilizes the collapsed and aggregated structure of ELPs. Both glycine and betaine stabilize collapsed conformations via a classical preferential depletion mechanism. Namely, the osmolytes are strongly partitioned away from the polymer–water interface and thus, cause collapse and aggregation via a depletion effect. TMAO, however, drives collapse via a different mechanism. Indeed, TMAO seems to accumulate at both the hydrophobic air–water interface and also, the polymer–water interface of the extended macromolecule. Our results indicate that TMAO has less influence on water structure than the other osmolytes. As such, its mechanism of action seems to involve neither its partitioning away from the peptide–water interface nor its impact on the hydrogen-bonding network of bulk water. Instead, we suggest a nonclassical mechanism, whereby TMAO interacts with the extended state of the macromolecule but interacts even more strongly with the collapsed state. In particular, we speculate that TMAO may act as a surfactant at the interface of polar and nonpolar regions of folded protein surfaces.
Materials and Methods
SI Materials and Methods describes the IR spectrum of water in the presence of TMAO at basic pH, the effects on the water spectra at higher osmolyte concentrations, and the effects of acidification on the IR spectrum of bulk water along with additional details and analysis of the MD simulations.
Acknowledgments
Fig. 1 was made with VMD (Visual Molecular Dynamics). VMD is developed with NIH support by the Theoretical and Computational Biophysics Group at the Beckman Institute, University of Illinois at Urbana–Champaign. This work was funded by National Science Foundation Grants MCB-1053970 (to W.G.N.), CHE-1565631(to W.G.N.), and CHE-1413307 (to P.S.C.).
Footnotes
The authors declare no conflict of interest.
This article is a PNAS Direct Submission.
This article contains supporting information online at www.pnas.org/lookup/suppl/doi:10.1073/pnas.1614609114/-/DCSupplemental.
References
- 1.Yancey PH, Clark ME, Hand SC, Bowlus RD, Somero GN. Living with water stress: Evolution of osmolyte systems. Science. 1982;217(4566):1214–1222. doi: 10.1126/science.7112124. [DOI] [PubMed] [Google Scholar]
- 2.Lin T-Y, Timasheff SN. Why do some organisms use a urea-methylamine mixture as osmolyte? Thermodynamic compensation of urea and trimethylamine N-oxide interactions with protein. Biochemistry. 1994;33(42):12695–12701. doi: 10.1021/bi00208a021. [DOI] [PubMed] [Google Scholar]
- 3.Kita Y, Arakawa T, Lin T-Y, Timasheff SN. Contribution of the surface free energy perturbation to protein-solvent interactions. Biochemistry. 1994;33(50):15178–15189. doi: 10.1021/bi00254a029. [DOI] [PubMed] [Google Scholar]
- 4.Timasheff SN. Protein-solvent preferential interactions, protein hydration, and the modulation of biochemical reactions by solvent components. Proc Natl Acad Sci USA. 2002;99(15):9721–9726. doi: 10.1073/pnas.122225399. [DOI] [PMC free article] [PubMed] [Google Scholar]
- 5.Arakawa T, Timasheff SN. The stabilization of proteins by osmolytes. Biophys J. 1985;47(3):411–414. doi: 10.1016/S0006-3495(85)83932-1. [DOI] [PMC free article] [PubMed] [Google Scholar]
- 6.Felitsky DJ, Record MT., Jr Application of the local-bulk partitioning and competitive binding models to interpret preferential interactions of glycine betaine and urea with protein surface. Biochemistry. 2004;43(28):9276–9288. doi: 10.1021/bi049862t. [DOI] [PubMed] [Google Scholar]
- 7.Street TO, Bolen DW, Rose GD. A molecular mechanism for osmolyte-induced protein stability. Proc Natl Acad Sci USA. 2006;103(38):13997–14002. doi: 10.1073/pnas.0606236103. [DOI] [PMC free article] [PubMed] [Google Scholar]
- 8.Tanford C. Protein denaturation. Adv Protein Chem. 1968;23:121–282. doi: 10.1016/s0065-3233(08)60401-5. [DOI] [PubMed] [Google Scholar]
- 9.Wang A, Bolen DW. A naturally occurring protective system in urea-rich cells: Mechanism of osmolyte protection of proteins against urea denaturation. Biochemistry. 1997;36(30):9101–9108. doi: 10.1021/bi970247h. [DOI] [PubMed] [Google Scholar]
- 10.Zou Q, Bennion BJ, Daggett V, Murphy KP. The molecular mechanism of stabilization of proteins by TMAO and its ability to counteract the effects of urea. J Am Chem Soc. 2002;124(7):1192–1202. doi: 10.1021/ja004206b. [DOI] [PubMed] [Google Scholar]
- 11.Canchi DR, Jayasimha P, Rau DC, Makhatadze GI, Garcia AE. Molecular mechanism for the preferential exclusion of TMAO from protein surfaces. J Phys Chem B. 2012;116(40):12095–12104. doi: 10.1021/jp304298c. [DOI] [PMC free article] [PubMed] [Google Scholar]
- 12.Larini L, Shea JE. Double resolution model for studying TMAO/water effective interactions. J Phys Chem B. 2013;117(42):13268–13277. doi: 10.1021/jp403635g. [DOI] [PubMed] [Google Scholar]
- 13.Kokubo H, Hu CY, Pettitt BM. Peptide conformational preferences in osmolyte solutions: Transfer free energies of decaalanine. J Am Chem Soc. 2011;133(6):1849–1858. doi: 10.1021/ja1078128. [DOI] [PMC free article] [PubMed] [Google Scholar]
- 14.Schneck E, Horinek D, Netz RR. Insight into the molecular mechanisms of protein stabilizing osmolytes from global force-field variations. J Phys Chem B. 2013;117(28):8310–8321. doi: 10.1021/jp400790f. [DOI] [PubMed] [Google Scholar]
- 15.Sarma R, Paul S. Trimethylamine-N-oxide’s effect on polypeptide solvation at high pressure: A molecular dynamics simulation study. J Phys Chem B. 2013;117(30):9056–9066. doi: 10.1021/jp405202j. [DOI] [PubMed] [Google Scholar]
- 16.Cho SS, Reddy G, Straub JE, Thirumalai D. Entropic stabilization of proteins by TMAO. J Phys Chem B. 2011;115(45):13401–13407. doi: 10.1021/jp207289b. [DOI] [PMC free article] [PubMed] [Google Scholar]
- 17.Mondal J, et al. How osmolytes influence hydrophobic polymer conformations: A unified view from experiment and theory. Proc Natl Acad Sci USA. 2015;112(30):9270–9275. doi: 10.1073/pnas.1511780112. [DOI] [PMC free article] [PubMed] [Google Scholar]
- 18.Mondal J, Stirnemann G, Berne BJ. When does trimethylamine N-oxide fold a polymer chain and urea unfold it? J Phys Chem B. 2013;117(29):8723–8732. doi: 10.1021/jp405609j. [DOI] [PMC free article] [PubMed] [Google Scholar]
- 19.Athawale MV, Dordick JS, Garde S. Osmolyte trimethylamine-N-oxide does not affect the strength of hydrophobic interactions: Origin of osmolyte compatibility. Biophys J. 2005;89(2):858–866. doi: 10.1529/biophysj.104.056671. [DOI] [PMC free article] [PubMed] [Google Scholar]
- 20.Paul S, Patey GN. The influence of urea and trimethylamine-N-oxide on hydrophobic interactions. J Phys Chem B. 2007;111(28):7932–7933. doi: 10.1021/jp0733668. [DOI] [PubMed] [Google Scholar]
- 21.Wei H, Fan Y, Gao YQ. Effects of urea, tetramethyl urea, and trimethylamine N-oxide on aqueous solution structure and solvation of protein backbones: A molecular dynamics simulation study. J Phys Chem B. 2010;114(1):557–568. doi: 10.1021/jp9084926. [DOI] [PubMed] [Google Scholar]
- 22.Ma J, Pazos IM, Gai F. Microscopic insights into the protein-stabilizing effect of trimethylamine N-oxide (TMAO) Proc Natl Acad Sci USA. 2014;111(23):8476–8481. doi: 10.1073/pnas.1403224111. [DOI] [PMC free article] [PubMed] [Google Scholar]
- 23.Pazos IM, Gai F. Solute’s perspective on how trimethylamine oxide, urea, and guanidine hydrochloride affect water’s hydrogen bonding ability. J Phys Chem B. 2012;116(41):12473–12478. doi: 10.1021/jp307414s. [DOI] [PMC free article] [PubMed] [Google Scholar]
- 24.Sharp KA, Madan B, Manas E, Vanderkooi JM. Water structure changes induced by hydrophobic and polar solutes revealed by simulations and infrared spectroscopy. J Chem Phys. 2001;114(4):1791–1796. [Google Scholar]
- 25.Hunger J, Tielrooij KJ, Buchner R, Bonn M, Bakker HJ. Complex formation in aqueous trimethylamine-N-oxide (TMAO) solutions. J Phys Chem B. 2012;116(16):4783–4795. doi: 10.1021/jp212542q. [DOI] [PubMed] [Google Scholar]
- 26.Paul S, Patey GN. Structure and interaction in aqueous urea-trimethylamine-N-oxide solutions. J Am Chem Soc. 2007;129(14):4476–4482. doi: 10.1021/ja0685506. [DOI] [PubMed] [Google Scholar]
- 27.Ganguly P, Hajari T, Shea JE, van der Vegt NFA. Mutual exclusion of urea and trimethylamine N-oxide from amino acids in mixed solvent environment. J Phys Chem Lett. 2015;6(4):581–585. doi: 10.1021/jz502634k. [DOI] [PubMed] [Google Scholar]
- 28.Batchelor JD, Olteanu A, Tripathy A, Pielak GJ. Impact of protein denaturants and stabilizers on water structure. J Am Chem Soc. 2004;126(7):1958–1961. doi: 10.1021/ja039335h. [DOI] [PubMed] [Google Scholar]
- 29.Meyer DE, Chilkoti A. Purification of recombinant proteins by fusion with thermally-responsive polypeptides. Nat Biotechnol. 1999;17(11):1112–1115. doi: 10.1038/15100. [DOI] [PubMed] [Google Scholar]
- 30.Pegram LM, Record MT. Using surface tension data to predict differences in surface and bulk concentrations of nonelectrolytes in water. J Phys Chem C. 2009;113(6):2171–2174. doi: 10.1021/jp8073305. [DOI] [PMC free article] [PubMed] [Google Scholar]
- 31.Auton M, Ferreon AC, Bolen DW. Metrics that differentiate the origins of osmolyte effects on protein stability: A test of the surface tension proposal. J Mol Biol. 2006;361(5):983–992. doi: 10.1016/j.jmb.2006.07.003. [DOI] [PubMed] [Google Scholar]
- 32.Berendsen HJC, Grigera JR, Straatsma TP. The missing term in effective pair potentials. J Phys Chem. 1987;91(24):6269–6271. [Google Scholar]
- 33.Kast KM, Brickmann J, Kast SM, Berry RS. Binary phases of aliphatic N-oxides and water: Force field development and molecular dynamics simulation. J Phys Chem A. 2003;107(27):5342–5351. [Google Scholar]
- 34.MacKerell AD, et al. All-atom empirical potential for molecular modeling and dynamics studies of proteins. J Phys Chem B. 1998;102(18):3586–3616. doi: 10.1021/jp973084f. [DOI] [PubMed] [Google Scholar]
- 35.Mackerell AD, Jr, Feig M, Brooks CL., 3rd Extending the treatment of backbone energetics in protein force fields: Limitations of gas-phase quantum mechanics in reproducing protein conformational distributions in molecular dynamics simulations. J Comput Chem. 2004;25(11):1400–1415. doi: 10.1002/jcc.20065. [DOI] [PubMed] [Google Scholar]
- 36.Ma L, Pegram L, Record MT, Jr, Cui Q. Preferential interactions between small solutes and the protein backbone: A computational analysis. Biochemistry. 2010;49(9):1954–1962. doi: 10.1021/bi9020082. [DOI] [PMC free article] [PubMed] [Google Scholar]
- 37.Chen F, Smith PE. Simulated surface tensions of common water models. J Chem Phys. 2007;126(22):221101. doi: 10.1063/1.2745718. [DOI] [PubMed] [Google Scholar]
- 38.Vega C, de Miguel E. Surface tension of the most popular models of water by using the test-area simulation method. J Chem Phys. 2007;126(15):154707. doi: 10.1063/1.2715577. [DOI] [PubMed] [Google Scholar]
- 39.Rodríguez-Ropero F, Rötzscher P, van der Vegt NFA. Comparison of different TMAO force fields and their impact on the folding equilibrium of a hydrophobic polymer. J Phys Chem B. 2016;120(34):8757–8767. doi: 10.1021/acs.jpcb.6b04100. [DOI] [PubMed] [Google Scholar]
- 40.Davis JG, Gierszal KP, Wang P, Ben-Amotz D. Water structural transformation at molecular hydrophobic interfaces. Nature. 2012;491(7425):582–585. doi: 10.1038/nature11570. [DOI] [PubMed] [Google Scholar]
- 41.Rankin BM, Ben-Amotz D. Expulsion of ions from hydrophobic hydration shells. J Am Chem Soc. 2013;135(24):8818–8821. doi: 10.1021/ja4036303. [DOI] [PubMed] [Google Scholar]
- 42.Freda M, Onori G, Santucci A. Infrared study of the hydrophobic hydration and hydrophobic interactions in aqueous solutions of tert-butyl alcohol and trimethylamine-N-oxide. J Phys Chem B. 2001;105:12714–12718. [Google Scholar]
- 43.Scott JN, Nucci NV, Vanderkooi JM. Changes in water structure induced by the guanidinium cation and implications for protein denaturation. J Phys Chem A. 2008;112(43):10939–10948. doi: 10.1021/jp8058239. [DOI] [PMC free article] [PubMed] [Google Scholar]
- 44.Scatena LF, Brown MG, Richmond GL. Water at hydrophobic surfaces: Weak hydrogen bonding and strong orientation effects. Science. 2001;292(5518):908–912. doi: 10.1126/science.1059514. [DOI] [PubMed] [Google Scholar]
- 45.Ota ST, Richmond GL. Chilling out: A cool aqueous environment promotes the formation of gas-surface complexes. J Am Chem Soc. 2011;133(19):7497–7508. doi: 10.1021/ja201027k. [DOI] [PubMed] [Google Scholar]
- 46.Bertie JE, Labbé HJ, Whalley E. Absorptivity of ice I in the range 4000–30 cm−1. J Chem Phys. 1969;50:4501–4520. [Google Scholar]
- 47.Shen YR, Ostroverkhov V. Sum-frequency vibrational spectroscopy on water interfaces: Polar orientation of water molecules at interfaces. Chem Rev. 2006;106(4):1140–1154. doi: 10.1021/cr040377d. [DOI] [PubMed] [Google Scholar]
- 48.Wei X, Shen YR. Vibrational spectroscopy of ice interfaces. Appl Phys B. 2002;74(7-8):617–620. [Google Scholar]
- 49.Krezel A, Bal W. A formula for correlating pKa values determined in D2O and H2O. J Inorg Biochem. 2004;98(1):161–166. doi: 10.1016/j.jinorgbio.2003.10.001. [DOI] [PubMed] [Google Scholar]
- 50.Dawson RMC, Elliott DC, Elliott WH, Jones KM. Data for Biochemical Research. Oxford Science Publications; Clarendon, Oxford: 1986. [Google Scholar]
- 51.Kumar P, Buldyrev SV, Stanley HE. A tetrahedral entropy for water. Proc Natl Acad Sci USA. 2009;106(52):22130–22134. doi: 10.1073/pnas.0911094106. [DOI] [PMC free article] [PubMed] [Google Scholar]
- 52.Yao XL, Hong M. Structure distribution in an elastin-mimetic peptide (VPGVG)3 investigated by solid-state NMR. J Am Chem Soc. 2004;126(13):4199–4210. doi: 10.1021/ja036686n. [DOI] [PubMed] [Google Scholar]
- 53.Dill KA. Dominant forces in protein folding. Biochemistry. 1990;29(31):7133–7155. doi: 10.1021/bi00483a001. [DOI] [PubMed] [Google Scholar]
- 54.Moelbert S, Emberly E, Tang C. Correlation between sequence hydrophobicity and surface-exposure pattern of database proteins. Protein Sci. 2004;13(3):752–762. doi: 10.1110/ps.03431704. [DOI] [PMC free article] [PubMed] [Google Scholar]
- 55.Jorgensen WL. Quantum and statistical mechanical studies of liquids. 10. Transferable intermolecular potential functions for water, alcohols, and ethers - application to liquid water. J Am Chem Soc. 1981;103(2):335–340. [Google Scholar]
- 56.Abascal JLF, Vega C. A general purpose model for the condensed phases of water: TIP4P/2005. J Chem Phys. 2005;123(23):234505. doi: 10.1063/1.2121687. [DOI] [PubMed] [Google Scholar]
- 57.Pronk S, et al. GROMACS 4.5: A high-throughput and highly parallel open source molecular simulation toolkit. Bioinformatics. 2013;29(7):845–854. doi: 10.1093/bioinformatics/btt055. [DOI] [PMC free article] [PubMed] [Google Scholar]
- 58.Jorgensen WL, Maxwell DS, Tirado Rives J. Development and testing of the OPLS all-atom force field on conformational energetics and properties of organic liquids. J Am Chem Soc. 1996;118(45):11225–11236. [Google Scholar]
- 59.Capp MW, et al. Interactions of the osmolyte glycine betaine with molecular surfaces in water: Thermodynamics, structural interpretation, and prediction of m-values. Biochemistry. 2009;48(43):10372–10379. doi: 10.1021/bi901273r. [DOI] [PMC free article] [PubMed] [Google Scholar]
- 60.Vega C, Abascal JLF. Simulating water with rigid non-polarizable models: A general perspective. Phys Chem Chem Phys. 2011;13(44):19663–19688. doi: 10.1039/c1cp22168j. [DOI] [PubMed] [Google Scholar]
- 61.Bussi G, Donadio D, Parrinello M. Canonical sampling through velocity rescaling. J Chem Phys. 2007;126(1):014101. doi: 10.1063/1.2408420. [DOI] [PubMed] [Google Scholar]
- 62.Miyamoto S, Kollman PA. Settle - an analytical version of the shake and rattle algorithm for rigid water models. J Comput Chem. 1992;13(8):952–962. [Google Scholar]
- 63.Hess B, Bekker H, Berendsen HJC, Fraaije JGEM. LINCS: A linear constraint solver for molecular simulations. J Comput Chem. 1997;18(12):1463–1472. [Google Scholar]
- 64.Darden T, York D, Pedersen L. Particle mesh Ewald - an N.Log(N) method for Ewald sums in large systems. J Chem Phys. 1993;98(12):10089–10092. [Google Scholar]
- 65.Parrinello M, Rahman A. Crystal-structure and pair potentials - a molecular-dynamics study. Phys Rev Lett. 1980;45(14):1196–1199. [Google Scholar]
- 66.Shukla D, Shinde C, Trout BL. Molecular computations of preferential interaction coefficients of proteins. J Phys Chem B. 2009;113(37):12546–12554. doi: 10.1021/jp810949t. [DOI] [PubMed] [Google Scholar]


