Significance
Glucagon supports glucose homeostasis by stimulating hepatic glucose output. Inhibition of glucagon signaling has drawn much attention because of potential implications for diabetes treatment. It is well established that inhibition of glucagon signaling effectively lowers blood glucose but results in compensatory glucagon hypersecretion and expansion of pancreatic α-cell mass. It was recently proposed that Angptl4, an inhibitor of lipoprotein lipase-mediated plasma triglyceride clearance, links glucagon receptor inhibition to α-cell proliferation. Here we confirm that Angptl4 is a powerful regulator of plasma triglycerides, but not of hyperglucagonemia or α-cell hyperplasia. We observed an increase in plasma amino acids in humans following administration of a glucagon receptor-blocking antibody, confirming preclinical findings indicate that amino acids mediate the compensatory α-cell response.
Keywords: Angptl4, glucagon receptor, antibody, α-cell mass
Abstract
Genetic disruption or pharmacologic inhibition of glucagon signaling effectively lowers blood glucose but results in compensatory glucagon hypersecretion involving expansion of pancreatic α-cell mass. Ben-Zvi et al. recently reported that angiopoietin-like protein 4 (Angptl4) links glucagon receptor inhibition to hyperglucagonemia and α-cell proliferation [Ben-Zvi et al. (2015) Proc Natl Acad Sci USA 112:15498–15503]. Angptl4 is a secreted protein and inhibitor of lipoprotein lipase-mediated plasma triglyceride clearance. We report that Angptl4−/− mice treated with an anti-glucagon receptor monoclonal antibody undergo elevation of plasma glucagon levels and α-cell expansion similar to wild-type mice. Overexpression of Angptl4 in liver of mice caused a 8.6-fold elevation in plasma triglyceride levels, but did not alter plasma glucagon levels or α-cell mass. Furthermore, administration of glucagon receptor-blocking antibody to healthy individuals increased plasma glucagon and amino acid levels, but did not change circulating Angptl4 concentration. These data show that Angptl4 does not link glucagon receptor inhibition to compensatory hyperglucagonemia or expansion of α-cell mass, and that it cannot be given to induce such secretion and growth. The reduction of plasma triglyceride levels in Angptl4−/− mice and increase following Angptl4 overexpression suggest that changes in plasma triglyceride metabolism do not regulate α-cells in the pancreas. Our findings corroborate recent data showing that increased plasma amino acids and their transport into α-cells link glucagon receptor blockage to α-cell hyperplasia.
Glucagon is secreted from α-cells in the pancreas and stimulates hepatic glucose output. Increased plasma glucagon levels and hepatic glucose production are key contributing factors to the development and progression of diabetes (1–3). For this reason, glucagon receptor (GCGR) antagonists have drawn a significant amount of attention as potential antidiabetic drugs. It is well established that GCGR deficiency or inhibition effectively lowers blood glucose in animal models of type 1 (4, 5) and type 2 diabetes (6–9). GCGR antagonism also blunts glucagon-stimulated glucose production in humans (10, 11) and lowers blood glucose in healthy individuals and persons with type 2 diabetes (12–15).
These studies have provided evidence for clinically significant improvements in blood glucose levels without displaying overt hypoglycemia. Additional preclinical studies also have revealed the existence of a feedback loop between GCGR in the liver and the α-cells in the pancreas. Specifically, it has been shown that inhibition of the glucagon signaling pathway invariably triggers hyperglucagonemia and α-cell hyperplasia. α-Cell hyperplasia has been observed in GCGR knockout mice (16), glucagon knockout mice (17), prohormone convertase 2 knockout mice (18), liver-specific GCGR knockout mice (19) and liver-specific Gsα knockout mice (20). Pharmacologic knockdown of hepatic GCGR using antisense oligonucleotides (21, 22) or administration of GCGR-blocking antibodies (6, 23) also increased α-cell mass in rodents. Furthermore, glucagon cell hyperplasia has been observed in patients with inactivating mutations in GCGR (24, 25).
The mechanism triggering pancreatic α-cell hyperplasia in response to glucagon signaling blockade has been studied previously. Solloway et al. (26) showed that GCGR antagonism increased plasma amino acid levels, which stimulated α-cell hyperplasia in an mTOR-dependent manner. However, another recent study claimed that Angptl4, an inhibitor of lipoprotein lipase-dependent plasma triglyceride metabolism (27), links GCGR inhibition to hyperglucagonemia and α-cell proliferation (28). Here we used overexpression studies and Angptl4−/− mice to determine whether Angptl4 promotes hypersecretion of glucagon and α-cell proliferation, as has been reported by Ben-Zvi et al. (28). We also measured circulating Angptl4 levels in humans dosed with a specific and highly efficacious GCGR-blocking antibody.
Results
Angptl4−/− Mice Show Normal Hyperglucagonemia and α-Cell Hyperplasia in Response to GCGR Blockade.
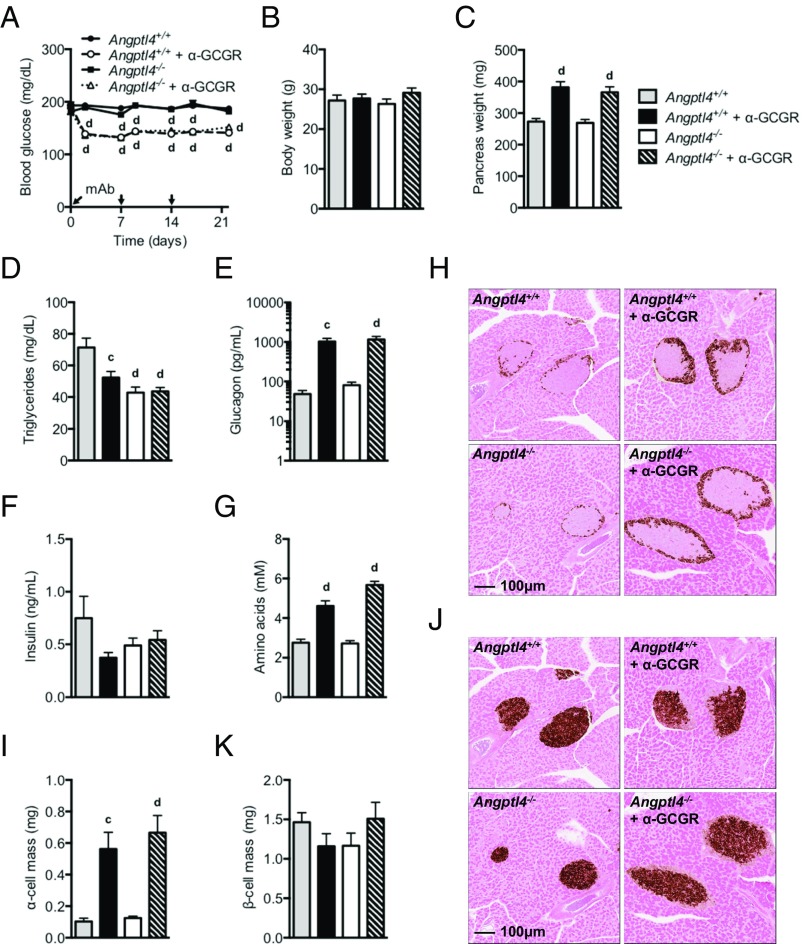
We used a recently described fully human GCGR-blocking antibody (α-GCGR) (6) derived using VelocImmune technology (29, 30) to explore whether Angptl4 controls glucagon secretion and α-cell growth following GCGR inhibition. We treated chow-fed male Angptl4−/− and littermate control mice with GCGR or control antibody (10 mg/kg) for 22 d. The Angptl4−/− mice had normal blood glucose levels (190 mg/dL), which did not change with control antibody treatment (Fig. 1A). α-GCGR administration similarly lowered blood glucose levels in the Angptl4−/− and control mice (Fig. 1A). Body weight did not change in either of the treatment groups (Fig. 1B). α-GCGR promoted increased pancreas weight, which was similar in the Angptl4−/− (34%) and control mice (40%) (Fig. 1C). As expected (31, 32), Angptl4−/− mice had nearly one-half of the circulating triglycerides of wild-type mice (Fig. 1D). Plasma glucagon levels were dramatically increased and to the same extent in α-GCGR–treated Angptl4−/− and control mice (Fig. 1E). Plasma insulin levels were similar in the two groups (Fig. 1F).
Fig. 1.
GCGR-blocking antibody promotes normal hyperglucagonemia and α-cell growth in Angptl4−/− male mice. (A) Fed blood glucose from chow-fed Angptl4−/− and control mice before and at multiple time points following s.c. injections of α-GCGR or control antibodies (10 mg/kg; n = 7–8/group). (B and C) Body weights (B) and pancreas weights (C) from the treatment groups described in A. The mice were killed on 22 d after dosing. (D–G) Plasma levels of triglycerides (D), glucagon (E), insulin (F), and total amino acids (G) from mice dosed as described in A. (H–K) Representative immunohistochemistry images of pancreas section from a mouse from each of the four treatment groups stained for glucagon (H) or insulin (J), and α-cell mass (I) and β-cell mass (K) for the four treatment groups. Values are mean ± SEM. Statistical analysis was conducted by one- or two-way ANOVA with Bonferroni posttest. P values are comparisons to the Angptl4+/+ group. cP < 0.001; dP < 0.0001. The study was repeated in female mice and the results were similar (Fig. S1).
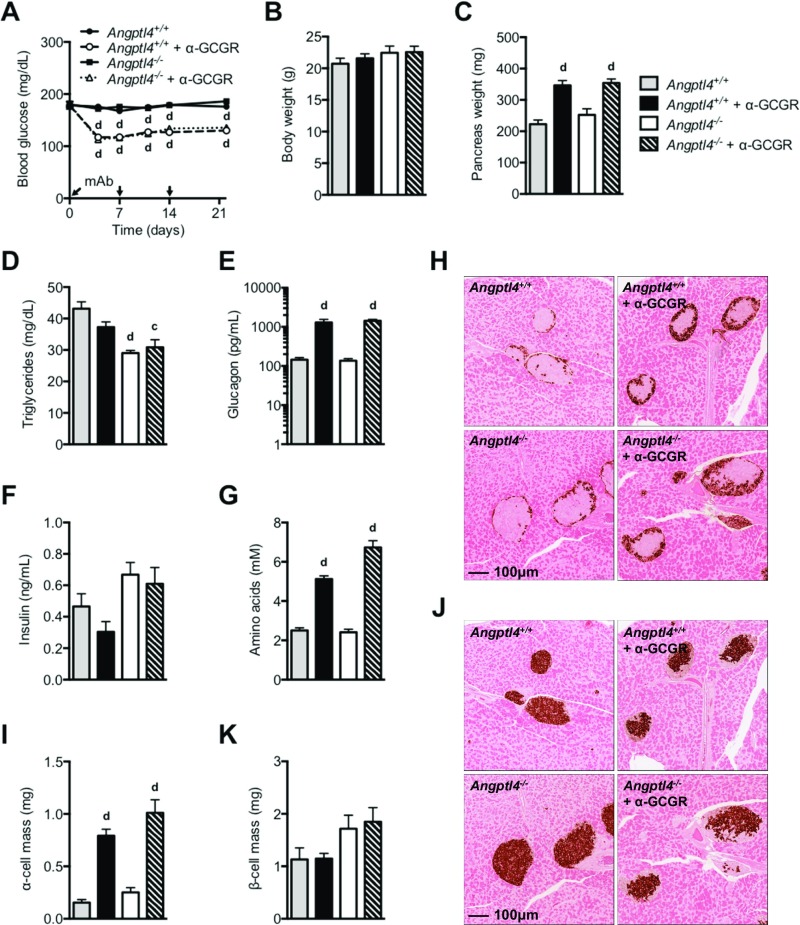
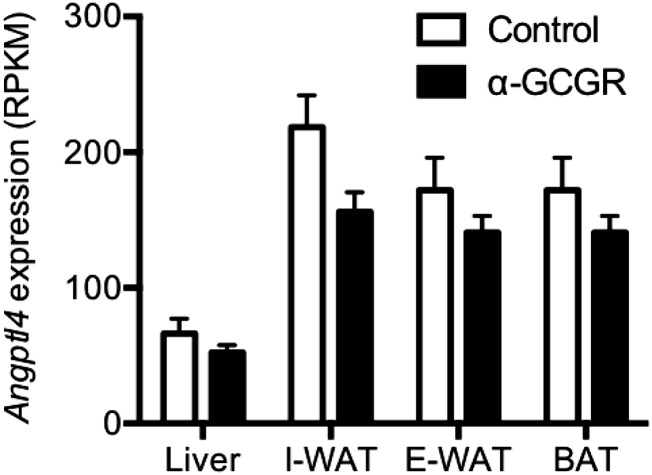
Consistent with our previous data (6), plasma amino acid levels were significantly increased in the Angptl4−/− and control mice receiving α-GCGR (Fig. 1G). Baseline α-cell mass was similar in the two groups and increased to the same extent (5.4-fold) following α-GCGR administration (Fig. 1 H and I). β-cell mass was unchanged by treatment and similar in the Angptl4−/− and control mice (Fig. 1 J and K). Similar data were observed in a study conducted in female Angptl4−/− and control mice (Fig. S1). Consistent with the lack of involvement of Angptl4 in regulating glucagon secretion and α-cell mass, we found no changes in Angptl4 expression in liver, inguinal and epididymal white adipose tissue (WAT), or brown adipose tissue (BAT) from mice administered with α-GCGR (Fig. S2). These data show that GCGR antibody-mediated increase in plasma glucagon and α-cell hyperplasia is independent of Angptl4, and support previous studies indicating that GCGR inhibition increases plasma amino acid levels (6, 8, 26).
Fig. S1.
GCGR-blocking antibody promotes normal hyperglucagonemia and α-cell growth in Angptl4−/− female mice. (A) Fed blood glucose from chow-fed Angptl4−/− and control mice before and at multiple time points following s.c. injections of α-GCGR or control antibodies (10 mg/kg; n = 8/group). (B and C) Body weights (B) and pancreas weights (C) from the treatment groups described in A. The mice were killed on 22 d after dosing. (D–G) Plasma levels of triglycerides (D), glucagon (E), insulin (F), and total amino acids (G) from mice dosed as described in (A). (H–K) Representative immunohistochemistry images of pancreas section from a mouse from each of the four treatment groups stained for glucagon (H) or insulin (J), and α-cell mass (I) and β-cell mass (K) for the four treatment groups. Values are mean ± SEM. Statistical analysis was conducted by one- or two-way ANOVA with Bonferroni posttest. P values are comparisons to the Angptl4+/+ group. cP < 0.001; dP < 0.0001.
Fig. S2.
GCGR-blocking antibody does not change Angptl4 expression levels in mice. Angptl4 expression levels were determined by RNAseq in liver, inguinal WAT (I-WAT), epididymal WAT (E-WAT), and BAT from chow-fed C57BL/6 mice given with α-GCGR or control antibodies (10 mg/kg; n = 4–6/group) once weekly for 21 d. Values are mean ± SEM. RPKM, reads per kilobase per million.
Angptl4 Overexpression Does Not Increase Circulating Glucagon or α-Cell Hyperplasia in Mice.
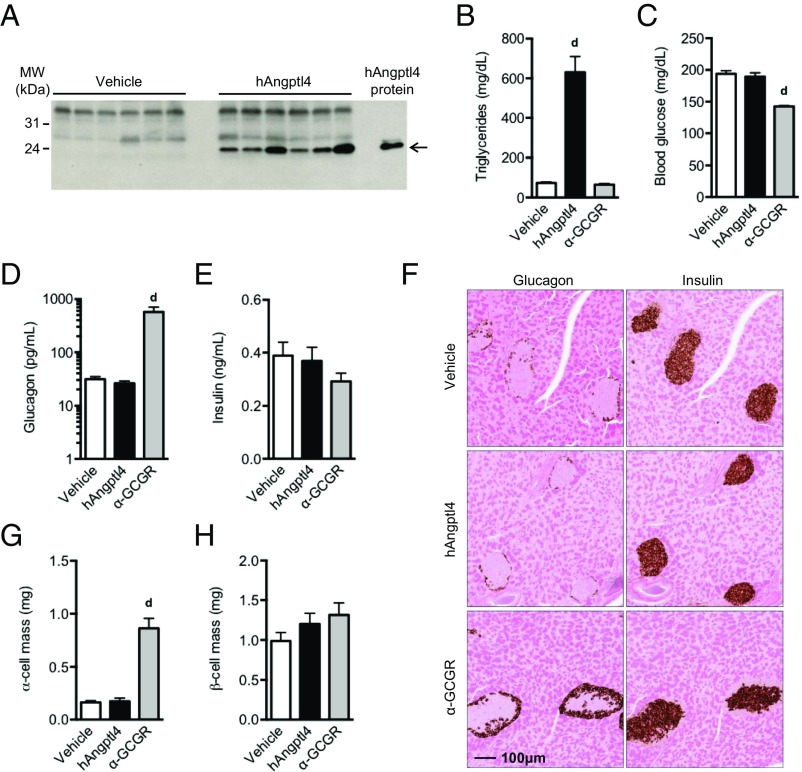
Hydrodynamic delivery of Angptl4 expression construct to livers of chow-fed mice resulted in high circulating levels of Angptl4 (Fig. 2A). Angptl4 overexpression for 14 d increased plasma triglycerides by 8.6-fold (Fig. 2B), but did not affect blood glucose or circulating levels of glucagon or insulin (Fig. 2 C–E). α-cell mass and β-cell mass were measured at 22 d after the start of the study and were similar in Angptl4-overexpressing and control mice (Fig. 2 F–H). Importantly, hydrodynamic delivery of α-GCGR antibody expression construct did not affect plasma triglyceride levels (Fig. 2B), but lowered blood glucose levels (Fig. 2C), increased plasma glucagon levels (Fig. 2D), and increased α-cell mass (Fig. 2 F and G). No changes were observed in plasma insulin levels or β-cell mass (Fig. 2 E, F, and H). The magnitude of change induced by the α-GCGR expression construct was comparable to that obtained with α-GCGR antibody treatment (Fig. 1), and served as a positive control for the Angptl4-overexpression study. Consistent with the data in Angptl4−/− mice, these overexpression data do not support a role for Angptl4 in the regulation of α-cell function or growth, but do confirm its involvement in triglyceride clearance.
Fig. 2.
Overexpression of Angptl4 does not increase glucagon secretion and α-cell mass in mice. (A) Western blot analysis of plasma following hydrodynamic delivery (HDD) via tail vein injection of cDNA encoding a C-terminal MycMycHis6 human Angptl4 (G25-A160). The control animals were injected with empty vector. (B–E) A Myc antibody was used for detection of Angptl4. Plasma triglyceride levels (B), fed blood glucose (C), plasma glucagon (D), and insulin (E) in mice injected with control (vehicle), Angptl4, or α-GCGR DNA at 14 d after HDD. (F) Representative immunohistochemistry images of pancreas section from a mouse from each treatment group stained for glucagon or insulin. The mice were scarified at 22 d after HDD. (G and H) α-cell mass (G) and β-cell mass (H) for the treatment groups. Overexpression of the α-GCGR blocking antibody served as positive control. Values are mean ± SEM. Statistical analysis was conducted by one-way ANOVA with Bonferroni posttest. P values are comparisons to the Vehicle group. dP < 0.0001.
Angptl4 Plasma Levels Do Not Change with α-GCGR Administration in Humans.
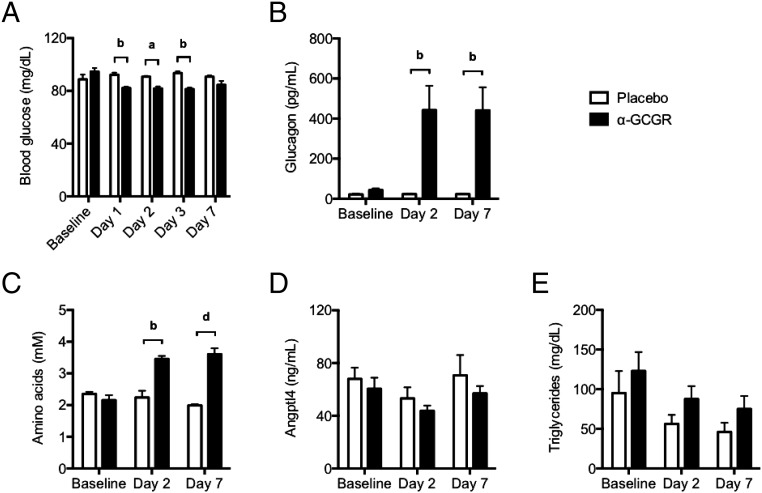
Administration of a single dose of α-GCGR antibody (0.3 and 0.6 mg/kg dose levels were combined) to human volunteers lowered fasting blood glucose by 13–14% for up to 3 d (Fig. 3A). The reduction in blood glucose was accompanied by a pronounced increase in plasma glucagon level (Fig. 3B), as well as a 60–67% increase in circulating amino acid levels (Fig. 3C). Importantly, plasma Angptl4 or triglyceride levels did not change with α-GCGR treatment (Fig. 3 D and E). These data show that GCGR antibody blockade in healthy euglycemic humans produced the expected increase in circulating levels of glucagon and amino acids, without a change in Angptl4. These results support the preclinical findings indicating that Angptl4 is not a mediator of the feedback loop between GCGR inhibition in the liver and glucagon secretion in the pancreas.
Fig. 3.
GCGR blocking antibody does not affect circulating Angptl4 levels in humans. (A) Changes in fasting blood glucose levels in healthy volunteers dosed once with α-GCGR (0.3 or 0.6 mg/kg; n = 6) or placebo (n = 4). (B–E) Corresponding changes in plasma glucagon (B), total amino acids (C), Angptl4 (D), and triglycerides (E) before and on days 2 and 7 after administration of α-GCGR, as described in A. Values are mean ± SEM. Statistical analysis was conducted by two-way ANOVA with Bonferroni posttest. P values are comparisons to the Placebo group. aP < 0.05; bP < 0.01; dP < 0.0001.
Discussion
We report here that (i) Angptl4 is not required for improved glycemic control, compensatory glucagon secretion, or the α-cell growth response to GCGR blocking antibody treatment; (ii) Angptl4 overexpression did not increase plasma glucagon, increase α-cell mass, or improve glycemia; (iii) GCGR-blocking antibody increased plasma glucagon and amino acids in humans without affecting circulating Angptl4 levels; and (iv) Angptl4 is a negative regulator of plasma triglyceride levels.
Ben-Zvi et al. (28) reported that Angptl4 mediates compensatory glucagon secretion and increases α-cell proliferation in mice treated with a GCGR antagonist. This was supported by the observation that GCGR antagonism improved glycemia in Angptl4−/− mice without increasing plasma glucagon or α-cell proliferation (28). Angptl4 is a circulating factor produced primarily by the liver and adipose tissue. Accumulating evidence indicates that Angptl4 is important for the controlling the physiological fluctuations in lipoprotein lipase activity during fasting (27). Our results contradict the findings of Ben-Zvi et al. (28), showing completely normal glucagon hypersecretion and α-cell growth response in Angptl4−/− mice following GCGR blockade with a monoclonal antibody. We also demonstrate that humans dosed with the GCGR-blocking antibody had elevated glucagon levels but no change in plasma Angptl4 levels. Finally, the lack of involvement of Angptl4 in the regulation of α-cell function and proliferation is supported by our hydrodynamic-overexpression studies. In these studies, high circulating levels of Angptl4 were associated with a dramatic increase in plasma triglyceride levels but no changes in plasma glucagon levels, blood glucose levels, or α-cell mass.
We do not know the reason for the discrepancy between our data and the findings reported by Ben-Zvi et al. (28); however, an important difference between the studies is that we measured α-cell mass following 22 d of treatment with a highly potent and efficacious monoclonal antibody (6), whereas Ben-Zvi et al. measured α-cell proliferation at 7 d after administration of a GCGR peptide antagonist with low affinity (33, 34). Short-term GCGR antagonism has been shown to lower blood glucose without severe α-cell hypertrophy (35). We can exclude differences in diet, because we have observed pronounced α-cell hyperplasia in both chow-fed and high-fat diet-fed mice treated with the α-GCGR antibody (6). Similar to the finding reported by Ben-Zvi et al. (28) that Angptl4 controls glucagon secretion and α-cell mass, the same group previously made the initial claim that Angptl8 was the long–sought-after “betatrophin” that induces β-cell growth (36). That study was discounted by an independent group (37) and eventually by the original authors (36, 38).
It was recently shown that amino acids are responsible for the hyperglucagonemia and α-cell hyperplasia that occur on inhibition of glucagon signaling (26). Elevated circulating amino acid levels arise from reduced uptake and conversion of amino acids into gluconeogenic precursors in livers of mice with inhibited GCGR signaling (8, 26). We have confirmed and expanded these findings to humans, in whom we observed robust increases in plasma amino acid levels following the administration of α-GCGR. The increased plasma amino acid levels were associated with elevated circulating glucagon levels. This is consistent with marked hyperglucagonemia and α-cell hyperplasia observed in carriers with inactivating mutations in GCGR (24, 25). The increase in plasma amino acid level in the α-cells is sensed by mTOR, a central regulator of cell growth and proliferation in response to amino acids (39). Thus, accumulating evidence suggests that amino acids and mTOR are components of a tightly controlled circuit between the liver and the α-cells in the pancreas to ensure reliable and sufficient glucagon secretion to maintain glucose homeostasis.
In conclusion, the present data do not support a role for Angptl4 in the control of α-cell function or growth. Our findings that plasma triglyceride levels are markedly increased following Angptl4 overexpression and reduced by Angptl4 deletion further suggest that triglycerides do not affect α-cells in the pancreas. Our data confirm that Angptl4 inhibition lowers plasma triglyceride levels, which may represent a therapeutic strategy for hypertriglyceridemia and could reduce the risk for coronary artery disease (40).
Materials and Methods
Constructs.
A cDNA coding for a C-terminal MycMycHis6 epitope-tagged human Angptl4 (G25-A160) was generated by PCR using the primers 5′-atactagctcttcagcaggcggacccgtgcagtccaag-3′ and 5′-tagtatgctcttcattcggcaggcttggccacctcatggtc-3′, with a DNA plasmid clone harboring untagged human Angptl4 (UBC reference sequence NM_139314.2) as the template. The resulting cDNA was cloned into a mammalian expression vector pRG977, equipped with the Ror1 signal sequence (NM_001312690.1) and the C-terminal tag. The clone was confirmed by DNA sequencing. The expression and secretion were evaluated by Western blot analysis of transfected HEK293 cell culture medium using an anti-Myc antibody (Cell Signaling Technology).
To generate constructs for the production of the monoclonal α-GCGR antibody, REGN1193, cDNAs for the heavy and light chains were cloned into the pRG977 vector, under the control of the human ubiquitin promoter (UBC reference sequence NG_027722.2). Expression was confirmed by analyzing culture media from transiently transfected CHO cells, using anti–hIgG-HRP (Pierce).
In Vivo Studies.
All procedures were conducted in compliance with protocols approved by the Regeneron Pharmaceuticals Institutional Animal Care and Use Committee. We previously described the in vitro and in vivo characteristics of α-GCGR (REGN1193), a potent monoclonal GCGR blocking antibody (6). This antibody was used in all studies reported in this paper. The GCGR antibody and isotype control antibody were diluted with sterile PBS.
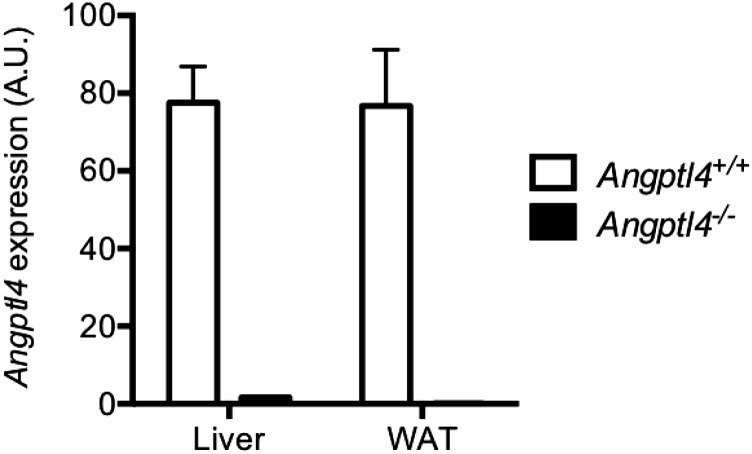
Angptl4−/− mice (99.9% C57BL/6NTac background) were generated using Regeneron’s VelociGene technology (41) (VelociGene allele identification no. VG120). No expression of Angptl4 was detected in liver and WAT of Angptl4−/− mice (Fig. S3). Both male and female mice were used for the study. Mice were housed (five mice per cage) in a controlled environment (12-h light/dark cycle, 22 ± 1 °C, 60–70% humidity) and fed ad libitum with standard chow (PicoLab Rodent Diet 20 EXT IRR 5R53; LabDiet). Mice were assigned to study groups (n = 7–8) based on baseline fed blood glucose levels. Mice were injected s.c. with GCGR or control antibodies (10 mg/kg). For the duration of the study, GCGR or control antibodies were administered once weekly. Blood was collected from the tail for glucose measurements without fasting. Plasma samples were collected via submandibular bleeds on day 21 after dosing for analysis of triglycerides, hormones, and total amino acid levels.
Fig. S3.
Angptl4 expression is absent in liver and WAT of Angptl4−/− mice. Angptl4 expression levels were determined by microarray in liver and WAT from chow-fed Angptl4+/+ and Angptl4−/− mice (n = 4/group). Values are mean ± SEM. A.U., arbitrary units.
Hydrodynamic DNA Delivery.
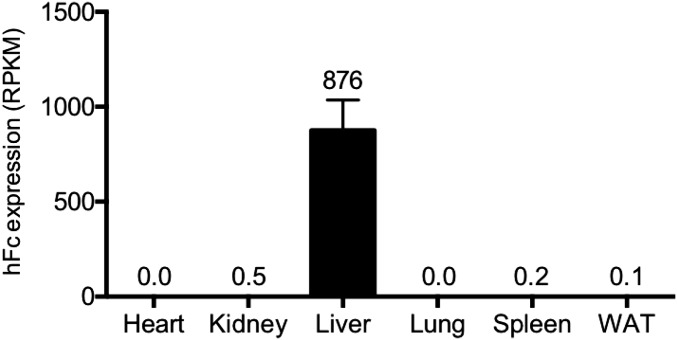
On study day 0, mice were assigned at random to one of three groups (n = 7–12/group). The mice were anesthetized with isoflurane and injected with plasmid at 50 μg of DNA in sterile saline via the tail vein at 10% of body weight. Plasma was collected at day 14 to assess lipid and hormone levels. Blood glucose was measured from the tail tip using an Accu-Chek glucometer (Roche). Angptl4 expression in plasma was confirmed by Western blot analysis. Mice were scarified at day 22, and pancreata were harvested and prepared for determination of α- and β-cell masses by histology. In a separate study, human Fc was overexpressed and its expression measured in six tissues by RNA sequencing. Human Fc was highly expressed in liver, but not in heart, kidney, lung, spleen, or WAT (Fig. S4). These data confirm that hydrodynamic DNA delivery is restricted to liver.
Fig. S4.
Hydrodynamic DNA delivery (HDD) is restricted to liver. Seven days post-HDD of human Fc (hFc) in chow-fed C57BL/6 mice (n = 4), hFc expression levels were determined by RNAseq in heart, kidney, liver, lung, spleen, and WAT. Values are mean ± SEM.
Blood Chemistry for Mouse Studies.
Blood glucose was determined using ACCU-CHEK Compact Plus blood glucose monitoring system (Roche Diagnostics). Plasma triglyceride levels were assayed in a Beckman Coulter UniCelDxC 800 Synchron Clinical System (Beckman Coulter). Plasma glucagon and insulin levels were determined using Mercodia glucagon and insulin ELISA. Plasma amino acid was quantified using the L-Amino Acid Quantification Kit (Sigma-Aldrich).
Western Blot Analysis.
Here, 1.0 μL of plasma from each animal was resolved by SDS/PAGE using Criterion TGX 4–20% precast gel (Bio-Rad) under reducing conditions and transferred to nitrocellulose membranes. The membranes were probed with an anti–Myc-HRP–conjugated antibody (Cell Signaling Technology) and detected using an enhanced chemiluminescent detection system.
Histology.
Pancreata were fixed in 10% neutral buffered formalin solution for 48 h and then embedded in paraffin. Two sections of the pancreas from each animal were stained with an anti-glucagon (REGN745, an α-glucagon monoclonal antibody generated in-house) or an α-insulin (Dako) antibody, and areas of glucagon and insulin positive cells were measured using Halo digital imaging analysis software (Indica Labs). The percent of glucagon- and insulin-positive areas in proportion to the whole pancreas area were calculated. α- and β-cell mass was calculated by multiplying the α- and β-cell areas for each animal by its corresponding pancreas weight.
Expression Analysis.
Total RNA was purified from all samples using the MagMAX-96 for Microarrays Total RNA Isolation Kit (Life Technologies), according to the manufacturer’s specifications. Genomic DNA was removed using MagMAXTurboDNase Buffer and TURBO DNase from the MagMAX Kit (Life Technologies). mRNA was purified from total RNA using the Dynabeads mRNA Purification Kit (Invitrogen). Strand-specific RNA-seq libraries were prepared using KAPA mRNA-Seq Library Preparation Kit (Kapa Biosystems). Twelve-cycle PCR was performed to amplify libraries. Sequencing was performed using an Illumina HiSeq2000 Sequencing System by a multiplexed single-read run with 33 cycles. Raw sequence data (BCL files) were converted to FASTQ format using Illumina Casava 1.8.2. Reads were decoded based on their barcodes, and read quality was evaluated with FastQC (www.bioinformatics.babraham.ac.uk/projects/fastqc/). Reads were mapped to the mouse transcriptome (NCBI GRCm38) using ArrayStudio software (OmicSoft), allowing two mismatches. Microarray analysis was performed as described previously (42).
Human Studies.
Blood samples for glucose, glucagon, Angptl4, triglycerides, and amino acids were collected from the 0.3 and 0.6 mg/kg dose groups as part of a single-center, phase I, single ascending dose, randomized, double-blind study to assess the pharmacokinetics, pharmacodynamics, safety, and tolerability of REGN1193. The full report of the study is in preparation. Each patient provided written informed consent, and the study was conducted in accordance with the International Conference on Harmonization’s Good Clinical Practice guidelines and all applicable local regulatory requirements and laws. Eligible subjects were healthy men and women, 18–45 y of age (inclusive), with a body mass index ranging from 18 to 30 kg/m2 (inclusive), and with no history of change in body weight >10% over the 6 mo before screening. Other key inclusion criteria were hemoglobin A1c ≤5.5% and fasting plasma glucose 70–110 mg/dL.
After overnight fasting, blood was drawn for evaluation of glucose at baseline and on days 1, 2, 3, and 7 after i.v. administration of antibody or placebo and for evaluation of glucagon, total amino acids, Angptl4, and triglycerides at baseline and on days 2 and 7 after the administration. Glucagon levels were assessed using a validated assay at Pacific Biomarkers. Amino acids were measured using the L-Amino Acid Quantification Kit (Sigma-Aldrich). Angptl4 levels were determined using human Angptl4 DuoSet ELISA (R&D Systems). Triglyceride levels were measured using a validated assay at Medpace Reference Laboratories. Data for the 0.3 and 0.6 mg/kg dose groups were combined for analysis.
Data Analyses.
Data are reported as mean ± SEM. Statistical analyses were performed using Prism 6.0 (GraphPad Software). All parameters were analyzed by one- or two-way ANOVA; a threshold of P < 0.05 was considered statistically significant. If a significant F ratio was obtained, then post hoc analysis was conducted with Bonferroni posttests.
Acknowledgments
We thank Myrianne Dure for help with plasma Angptl4, Angelos Papatheodorou for help with the lipid analysis, Yurong Xin and Weikeat Lim for bioinformatics support, Maria del Pilar Molina-Portela for her contributions to the hydrodynamic DNA delivery control study, and Samantha Intriligator for manuscript editing. We also thank the investigators, study coordinators, and study subjects at the Covance Clinical Research Unit, Dallas, TX, who participated in the trial.
Footnotes
Conflict of interest statement: All authors are employees and shareholders of Regeneron Pharmaceuticals, Inc.
This article contains supporting information online at www.pnas.org/lookup/suppl/doi:10.1073/pnas.1620989114/-/DCSupplemental.
References
- 1.Ahrén B. Beta- and alpha-cell dysfunction in subjects developing impaired glucose tolerance: Outcome of a 12-year prospective study in postmenopausal Caucasian women. Diabetes. 2009;58(3):726–731. doi: 10.2337/db08-1158. [DOI] [PMC free article] [PubMed] [Google Scholar]
- 2.Müller WA, Faloona GR, Aguilar-Parada E, Unger RH. Abnormal alpha-cell function in diabetes: Response to carbohydrate and protein ingestion. N Engl J Med. 1970;283(3):109–115. doi: 10.1056/NEJM197007162830301. [DOI] [PubMed] [Google Scholar]
- 3.Reaven GM, Chen YD, Golay A, Swislocki AL, Jaspan JB. Documentation of hyperglucagonemia throughout the day in nonobese and obese patients with noninsulin-dependent diabetes mellitus. J Clin Endocrinol Metab. 1987;64(1):106–110. doi: 10.1210/jcem-64-1-106. [DOI] [PubMed] [Google Scholar]
- 4.Damond N, et al. Blockade of glucagon signaling prevents or reverses diabetes onset only if residual β-cells persist. eLife. 2016;5(5):e13828. doi: 10.7554/eLife.13828. [DOI] [PMC free article] [PubMed] [Google Scholar]
- 5.Wang MY, et al. Glucagon receptor antibody completely suppresses type 1 diabetes phenotype without insulin by disrupting a novel diabetogenic pathway. Proc Natl Acad Sci USA. 2015;112(8):2503–2508. doi: 10.1073/pnas.1424934112. [DOI] [PMC free article] [PubMed] [Google Scholar]
- 6.Okamoto H, et al. Glucagon receptor blockade with a human antibody normalizes blood glucose in diabetic mice and monkeys. Endocrinology. 2015;156(8):2781–2794. doi: 10.1210/en.2015-1011. [DOI] [PubMed] [Google Scholar]
- 7.Yan H, et al. Fully human monoclonal antibodies antagonizing the glucagon receptor improve glucose homeostasis in mice and monkeys. J Pharmacol Exp Ther. 2009;329(1):102–111. doi: 10.1124/jpet.108.147009. [DOI] [PubMed] [Google Scholar]
- 8.Mu J, et al. Anti-diabetic efficacy and impact on amino acid metabolism of GRA1, a novel small-molecule glucagon receptor antagonist. PLoS One. 2012;7(11):e49572. doi: 10.1371/journal.pone.0049572. [DOI] [PMC free article] [PubMed] [Google Scholar]
- 9.Kim WD, et al. Human monoclonal antibodies against glucagon receptor improve glucose homeostasis by suppression of hepatic glucose output in diet-induced obese mice. PLoS One. 2012;7(12):e50954. doi: 10.1371/journal.pone.0050954. [DOI] [PMC free article] [PubMed] [Google Scholar]
- 10.Petersen KF, Sullivan JT. Effects of a novel glucagon receptor antagonist (Bay 27-9955) on glucagon-stimulated glucose production in humans. Diabetologia. 2001;44(11):2018–2024. doi: 10.1007/s001250100006. [DOI] [PubMed] [Google Scholar]
- 11.van Dongen MG, et al. First proof of pharmacology in humans of a novel glucagon receptor antisense drug. J Clin Pharmacol. 2015;55(3):298–306. doi: 10.1002/jcph.396. [DOI] [PubMed] [Google Scholar]
- 12.Kelly RP, et al. Short-term administration of the glucagon receptor antagonist LY2409021 lowers blood glucose in healthy people and in those with type 2 diabetes. Diabetes Obes Metab. 2015;17(4):414–422. doi: 10.1111/dom.12446. [DOI] [PubMed] [Google Scholar]
- 13.Kazierad DJ, et al. Effects of multiple ascending doses of the glucagon receptor antagonist PF-06291874 in patients with type 2 diabetes mellitus. Diabetes Obes Metab. 2016;18(8):795–802. doi: 10.1111/dom.12672. [DOI] [PubMed] [Google Scholar]
- 14.Kazda CM, et al. Evaluation of efficacy and safety of the glucagon receptor antagonist LY2409021 in patients with type 2 diabetes: 12- and 24-week phase 2 studies. Diabetes Care. 2016;39(7):1241–1249. doi: 10.2337/dc15-1643. [DOI] [PubMed] [Google Scholar]
- 15.Vajda EG, et al. Pharmacokinetics and pharmacodynamics of single and multiple doses of the glucagon receptor antagonist LGD-6972 in healthy subjects and subjects with type 2 diabetes mellitus. Diabetes Obes Metab. 2017;19(1):24–32. doi: 10.1111/dom.12752. [DOI] [PMC free article] [PubMed] [Google Scholar]
- 16.Gelling RW, et al. Lower blood glucose, hyperglucagonemia, and pancreatic alpha cell hyperplasia in glucagon receptor knockout mice. Proc Natl Acad Sci USA. 2003;100(3):1438–1443. doi: 10.1073/pnas.0237106100. [DOI] [PMC free article] [PubMed] [Google Scholar]
- 17.Hayashi Y, et al. Mice deficient for glucagon gene-derived peptides display normoglycemia and hyperplasia of islet alpha-cells but not of intestinal L-cells. Mol Endocrinol. 2009;23(12):1990–1999. doi: 10.1210/me.2009-0296. [DOI] [PMC free article] [PubMed] [Google Scholar]
- 18.Webb GC, Akbar MS, Zhao C, Swift HH, Steiner DF. Glucagon replacement via micro-osmotic pump corrects hypoglycemia and alpha-cell hyperplasia in prohormone convertase 2 knockout mice. Diabetes. 2002;51(2):398–405. doi: 10.2337/diabetes.51.2.398. [DOI] [PubMed] [Google Scholar]
- 19.Longuet C, et al. Liver-specific disruption of the murine glucagon receptor produces α-cell hyperplasia: Evidence for a circulating α-cell growth factor. Diabetes. 2013;62(4):1196–1205. doi: 10.2337/db11-1605. [DOI] [PMC free article] [PubMed] [Google Scholar]
- 20.Chen M, et al. Increased glucose tolerance and reduced adiposity in the absence of fasting hypoglycemia in mice with liver-specific Gs alpha deficiency. J Clin Invest. 2005;115(11):3217–3227. doi: 10.1172/JCI24196. [DOI] [PMC free article] [PubMed] [Google Scholar]
- 21.Sloop KW, et al. Hepatic and glucagon-like peptide-1-mediated reversal of diabetes by glucagon receptor antisense oligonucleotide inhibitors. J Clin Invest. 2004;113(11):1571–1581. doi: 10.1172/JCI20911. [DOI] [PMC free article] [PubMed] [Google Scholar]
- 22.Liang Y, et al. Reduction in glucagon receptor expression by an antisense oligonucleotide ameliorates diabetic syndrome in db/db mice. Diabetes. 2004;53(2):410–417. doi: 10.2337/diabetes.53.2.410. [DOI] [PubMed] [Google Scholar]
- 23.Gu W, et al. Long-term inhibition of the glucagon receptor with a monoclonal antibody in mice causes sustained improvement in glycemic control, with reversible alpha-cell hyperplasia and hyperglucagonemia. J Pharmacol Exp Ther. 2009;331(3):871–881. doi: 10.1124/jpet.109.157685. [DOI] [PubMed] [Google Scholar]
- 24.Zhou C, Dhall D, Nissen NN, Chen CR, Yu R. Homozygous P86S mutation of the human glucagon receptor is associated with hyperglucagonemia, alpha cell hyperplasia, and islet cell tumor. Pancreas. 2009;38(8):941–946. doi: 10.1097/MPA.0b013e3181b2bb03. [DOI] [PMC free article] [PubMed] [Google Scholar]
- 25.Sipos B, et al. Glucagon cell hyperplasia and neoplasia with and without glucagon receptor mutations. J Clin Endocrinol Metab. 2015;100(5):E783–E788. doi: 10.1210/jc.2014-4405. [DOI] [PubMed] [Google Scholar]
- 26.Solloway MJ, et al. Glucagon couples hepatic amino acid catabolism to mTOR-dependent regulation of α-cell mass. Cell Reports. 2015;12(3):495–510. doi: 10.1016/j.celrep.2015.06.034. [DOI] [PubMed] [Google Scholar]
- 27.Dijk W, Kersten S. Regulation of lipoprotein lipase by Angptl4. Trends Endocrinol Metab. 2014;25(3):146–155. doi: 10.1016/j.tem.2013.12.005. [DOI] [PubMed] [Google Scholar]
- 28.Ben-Zvi D, et al. Angptl4 links α-cell proliferation following glucagon receptor inhibition with adipose tissue triglyceride metabolism. Proc Natl Acad Sci USA. 2015;112(50):15498–15503. doi: 10.1073/pnas.1513872112. [DOI] [PMC free article] [PubMed] [Google Scholar]
- 29.Macdonald LE, et al. Precise and in situ genetic humanization of 6 Mb of mouse immunoglobulin genes. Proc Natl Acad Sci USA. 2014;111(14):5147–5152. doi: 10.1073/pnas.1323896111. [DOI] [PMC free article] [PubMed] [Google Scholar]
- 30.Murphy AJ, et al. Mice with megabase humanization of their immunoglobulin genes generate antibodies as efficiently as normal mice. Proc Natl Acad Sci USA. 2014;111(14):5153–5158. doi: 10.1073/pnas.1324022111. [DOI] [PMC free article] [PubMed] [Google Scholar]
- 31.Köster A, et al. Transgenic angiopoietin-like (angptl)4 overexpression and targeted disruption of angptl4 and angptl3: Regulation of triglyceride metabolism. Endocrinology. 2005;146(11):4943–4950. doi: 10.1210/en.2005-0476. [DOI] [PubMed] [Google Scholar]
- 32.Adachi H, et al. Angptl4 deficiency decreases serum triglyceride levels in low-density lipoprotein receptor knockout mice and streptozotocin-induced diabetic mice. Biochem Biophys Res Commun. 2011;409(2):177–180. doi: 10.1016/j.bbrc.2011.04.110. [DOI] [PubMed] [Google Scholar]
- 33.Post SR, Rubinstein PG, Tager HS. Mechanism of action of des-His1-[Glu9]glucagon amide, a peptide antagonist of the glucagon receptor system. Proc Natl Acad Sci USA. 1993;90(5):1662–1666. doi: 10.1073/pnas.90.5.1662. [DOI] [PMC free article] [PubMed] [Google Scholar]
- 34.Unson CG, Gurzenda EM, Iwasa K, Merrifield RB. Glucagon antagonists: Contribution to binding and activity of the amino-terminal sequence 1-5, position 12, and the putative alpha-helical segment 19-27. J Biol Chem. 1989;264(2):789–794. [PubMed] [Google Scholar]
- 35.Mu J, et al. Chronic treatment with a glucagon receptor antagonist lowers glucose and moderately raises circulating glucagon and glucagon-like peptide 1 without severe alpha cell hypertrophy in diet-induced obese mice. Diabetologia. 2011;54(9):2381–91. doi: 10.1007/s00125-011-2217-2. [DOI] [PubMed] [Google Scholar]
- 36.Yi P, Park JS, Melton DA. Retraction notice to: Betatrophin: A hormone that controls pancreatic β cell proliferation. Cell. 2017;168(1-2):326. doi: 10.1016/j.cell.2016.12.017. [DOI] [PMC free article] [PubMed] [Google Scholar]
- 37.Gusarova V, et al. ANGPTL8/betatrophin does not control pancreatic beta cell expansion. Cell. 2014;159(3):691–696. doi: 10.1016/j.cell.2014.09.027. [DOI] [PMC free article] [PubMed] [Google Scholar]
- 38.Yi P, Park JS, Melton DA. Perspectives on the activities of ANGPTL8/betatrophin. Cell. 2014;159(3):467–468. doi: 10.1016/j.cell.2014.09.028. [DOI] [PubMed] [Google Scholar]
- 39.Laplante M, Sabatini DM. mTOR signaling in growth control and disease. Cell. 2012;149(2):274–293. doi: 10.1016/j.cell.2012.03.017. [DOI] [PMC free article] [PubMed] [Google Scholar]
- 40.Dewey FE, et al. Inactivating variants in ANGPTL4 and risk of coronary artery disease. N Engl J Med. 2016;374(12):1123–1133. doi: 10.1056/NEJMoa1510926. [DOI] [PMC free article] [PubMed] [Google Scholar]
- 41.Valenzuela DM, et al. High-throughput engineering of the mouse genome coupled with high-resolution expression analysis. Nat Biotechnol. 2003;21(6):652–659. doi: 10.1038/nbt822. [DOI] [PubMed] [Google Scholar]
- 42.Li Z, et al. Embryonic stem cell tumor model reveals role of vascular endothelial receptor tyrosine phosphatase in regulating Tie2 pathway in tumor angiogenesis. Proc Natl Acad Sci USA. 2009;106(52):22399–22404. doi: 10.1073/pnas.0911189106. [DOI] [PMC free article] [PubMed] [Google Scholar]


