Significance
Speculation about the role of division plane orientation in the growth of a plant has hinged on two conflicting ideas. The first idea is that the plant body is specified at the tissue level and cells divide merely to fill in the space, making the orientation of division unimportant to the overall growth. The second idea is that the orientation of the division plane is critical for tissue-level patterning and therefore also impacts growth. This study suggests that misorientation of the division plane together with cell-cycle delays cannot be compensated for. Therefore, division plane orientation is a critical but potentially indirect factor for growth.
Keywords: maize, division, phragmoplast, TANGLED, cell cycle
Abstract
How growth, microtubule dynamics, and cell-cycle progression are coordinated is one of the unsolved mysteries of cell biology. A maize mutant, tangled1, with known defects in growth and proper division plane orientation, and a recently characterized cell-cycle delay identified by time-lapse imaging, was used to clarify the relationship between growth, cell cycle, and proper division plane orientation. The tangled1 mutant was fully rescued by introduction of cortical division site localized TANGLED1-YFP. A CYCLIN1B destruction box was fused to TANGLED1-YFP to generate a line that mostly rescued the division plane defect but still showed cell-cycle delays when expressed in the tangled1 mutant. Although an intermediate growth phenotype between wild-type and the tangled1 mutant was expected, these partially rescued plants grew as well as wild-type siblings, indicating that mitotic progression delays alone do not alter overall growth. These data indicate that division plane orientation, together with proper cell-cycle progression, is critical for plant growth.
Plant cells are surrounded by a cell wall that together with other cellular factors, controls cell growth and restricts cell movement. According to cell theory, the orientation of the division plane sets the ultimate placement of cells and is therefore key for the overall organization of the plant body. Alternately, according to organismal theory, cell partitioning merely fills in space, and therefore division plane orientation plays no role in overall plant organization (1). Multiple examples exist that support one theory or the other, but a combined theory whereby overall growth is regulated at the organ level, but executed by cells, may be the most accurate (2). Cell walls are positioned during the cell cycle with the involvement of characteristic microtubule arrays: a preprophase band (PPB), which assembles in late interphase (G2) and predicts the future division site (3); a spindle in metaphase and anaphase; and a phragmoplast during telophase and cytokinesis that directs the formation of the new cell wall to the cortical division site (4–6). The PPB is not required for cytokinesis but is critical for division plane orientation and may be required for timely cell-cycle progression (7, 8). The PPB disassembles before cytokinesis, raising the fundamental question of how the premitotic location of the PPB specifies the position of the future new wall (9).
Mutants with general division plane defects often have significant alterations in both microtubule organization and overall growth (10–12). Alternatively, mutants may have defective specific asymmetric divisions leading to developmental defects (13–19). Many mutants with general division plane defects have mutations in genes that encode microtubule-associated proteins that disrupt both mitotic and interphase microtubule dynamics. In these cases, it is difficult to separate the relative contribution of mitotic versus interphase functions in wall placement. The division plane mutant tangled1 (tan1) is particularly informative because the TAN1 protein is observed only in mitotic cells (20, 21) and binds microtubules in vitro (22). Analysis of the tan1 mutant is therefore used here to elucidate the specific contribution of microtubule dynamics during mitosis. Similar to mutants with defects in both interphase and mitotic microtubule dynamics, maize tan1 mutants have short stature and misoriented cell patterns (23), as do mutants of TAN1-interacting partners phragmoplast orienting kinesin-1;2 (24). TAN1 is similar to the microtubule binding domain of adenomapolyposis coli (22), a multifunctional protein that promotes proper division orientation in animal cells (25–27). In Arabidopsis thaliana, AtTAN1 fused to yellow fluorescent protein (YFP) was the first identified positive marker of the cortical division site, remaining at the site after PPB disassembly (20). AtTAN1-YFP division site recruitment occurs via several independent mechanisms during different cell-cycle stages (21), but AtTAN1 function is still unclear. Because of the mild tan mutant phenotype in A. thaliana (20), it was impossible to determine whether AtTAN-YFP could rescue the tan mutant phenotype.
Fully functional maize TAN1 fused to YFP (TAN1–YFP) and TAN1–YFP lines described below were examined using live-cell imaging to assess TAN1 function. One TAN1–YFP line with the destruction box from CYCLIN1B fused to TAN1–YFP (D-TAN1-13–YFP), showed partial rescue of the tan1 mutant. D-TAN1-13–YFP in the tan1 mutant background exhibited significant delays in mitotic progression, but only minor defects in division plane orientation. Analysis of this variant allowed us to assess the relative importance of mitotic delays and phragmoplast guidance to the division site. D-TAN1-13–YFP in the tan1 mutant background grew to the same size as wild-type, suggesting that compensatory mechanisms could rescue growth impacted by mitotic delays but not a combination of mitotic delays and division plane orientation defects.
Results and Discussion
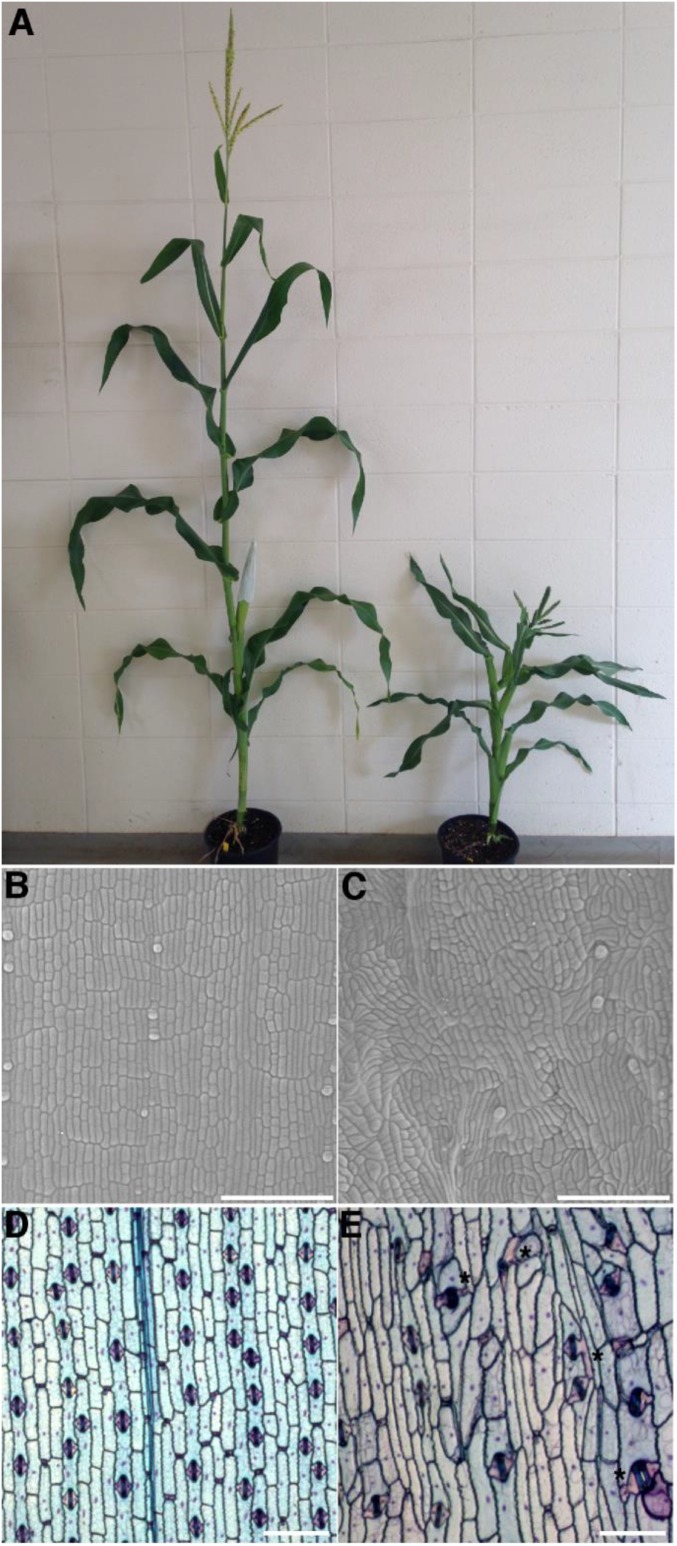
Maize tan1 mutants have short stature and rough textured leaves with disordered cell patterning and shapes (28) (Fig. S1 A–C) but did not have cytokinesis defects, such as incomplete cell-wall stubs or multinucleate cells (Fig. S1E) (23). Moreover, cells derived from both symmetric and asymmetric divisions were abnormally shaped (Fig. S1E), indicating that TAN1 function is required for proper division plane orientation in symmetrically and asymmetrically dividing cells.
Fig. S1.
Wild-type and tan1 mutant. (A) Photograph of 9-wk-old sibling plants, wild-type plant (Left), and tan mutant (Right) grown under standard greenhouse conditions in the A619 inbred background. Scanning electron micrographs were taken from the adaxial leaf blade directly above a 2-mm ligule in (B) nonmutant and (C) sibling tan mutant showing disordered cell patterning. TBO staining of abaxial epidermal peels from the mature blade from leaf 8 of (D) nonmutant and (E) sibling tan mutant. TBO staining shows that tan1 mutant cells are larger than wild-type sibling cells and that cell divisions are aberrant in both asymmetrically divided and asymmetrically divided (asterisk) cells. (Scale bars, 50 µm.)
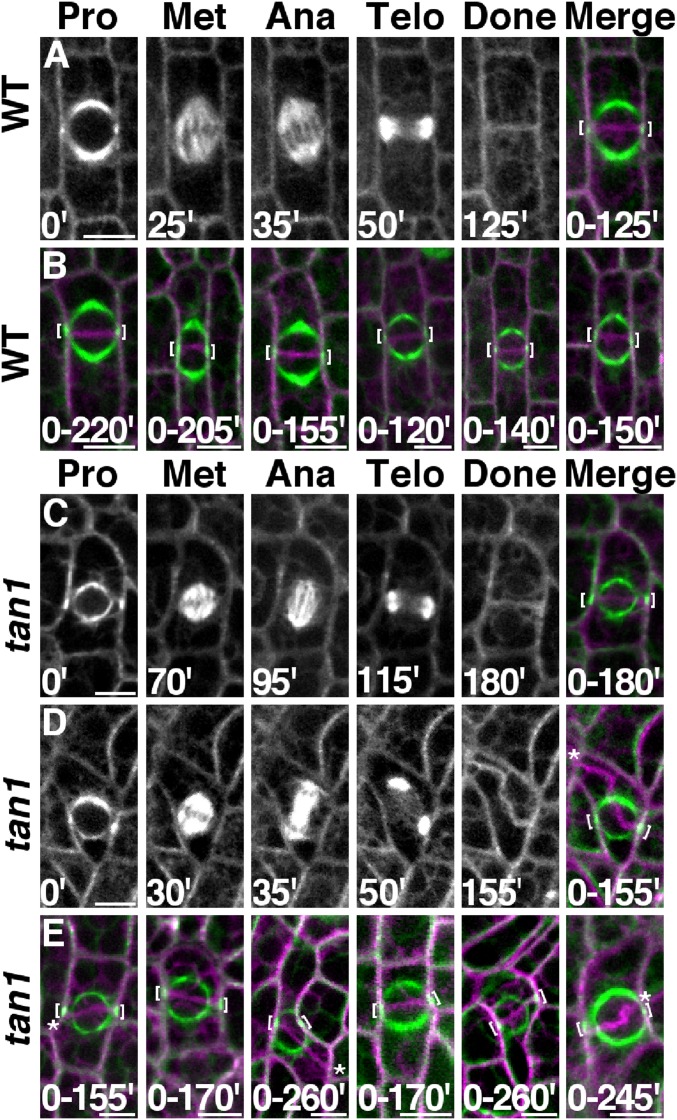
Previous studies suggested that tan1 mutants have division plane defects caused by the inability of phragmoplasts to track back to the division site (29). However, these experiments were conducted with fixed cells: it was not possible to compare the location of the PPB to the final orientation of the completed division. YFP-TUBULIN (30) was crossed into tan1 mutants to directly test the hypothesis that tan1 mutants had a phragmoplast guidance defect using time-lapse imaging. Wild-type and tan1 mutant cells expressing YFP-TUBULIN were imaged from prophase until the end of cytokinesis and compiled into a single time-lapse to compare PPB location to the final division plane (Fig. 1A, six other examples in Fig. 1B, and Movie S1). In wild-type cells all completed divisions displayed normal division orientation: the new cell wall aligned with the former location of the PPB (n = 87). When tan1 mutant cells were observed 62.5% (n = 30 of 48) of new cell walls returned to the division site previously occupied by the PPB (Fig. 1C and Movie S2), whereas 37.5% of new cell walls displayed an aberrant location (Fig. 1 D and E and Movie S3). These data provide direct evidence that tan1 mutant cells have defects in division plane orientation because of a phragmoplast guidance defect.
Fig. 1.
Time-lapse and division-time quantification. Merged images show before (green) and after (magenta) division. (A) Wild-type cell division. (B) Six representative wild-type cells. (C) Correctly oriented tan1 cell division. (D) Misoriented tan1 division. (E) Six representative tan1 cells. Brackets mark PPB location. Misplaced cell walls indicated by asterisks. Time (minutes) at the bottom of the image. (Scale bars, 10 μm.)
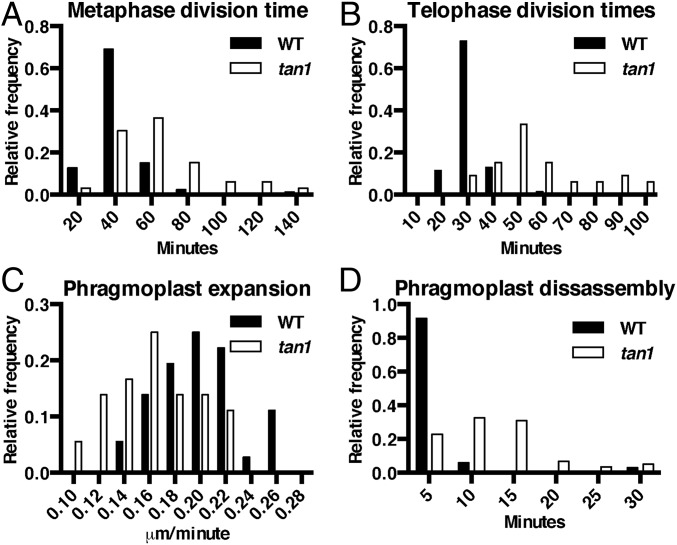
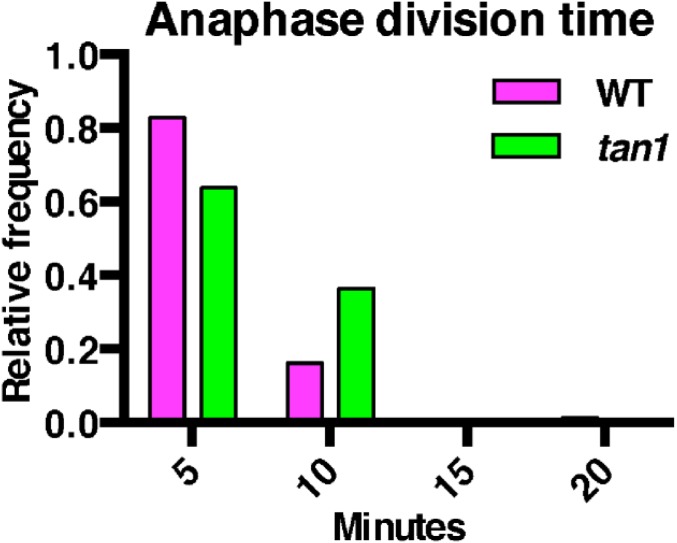
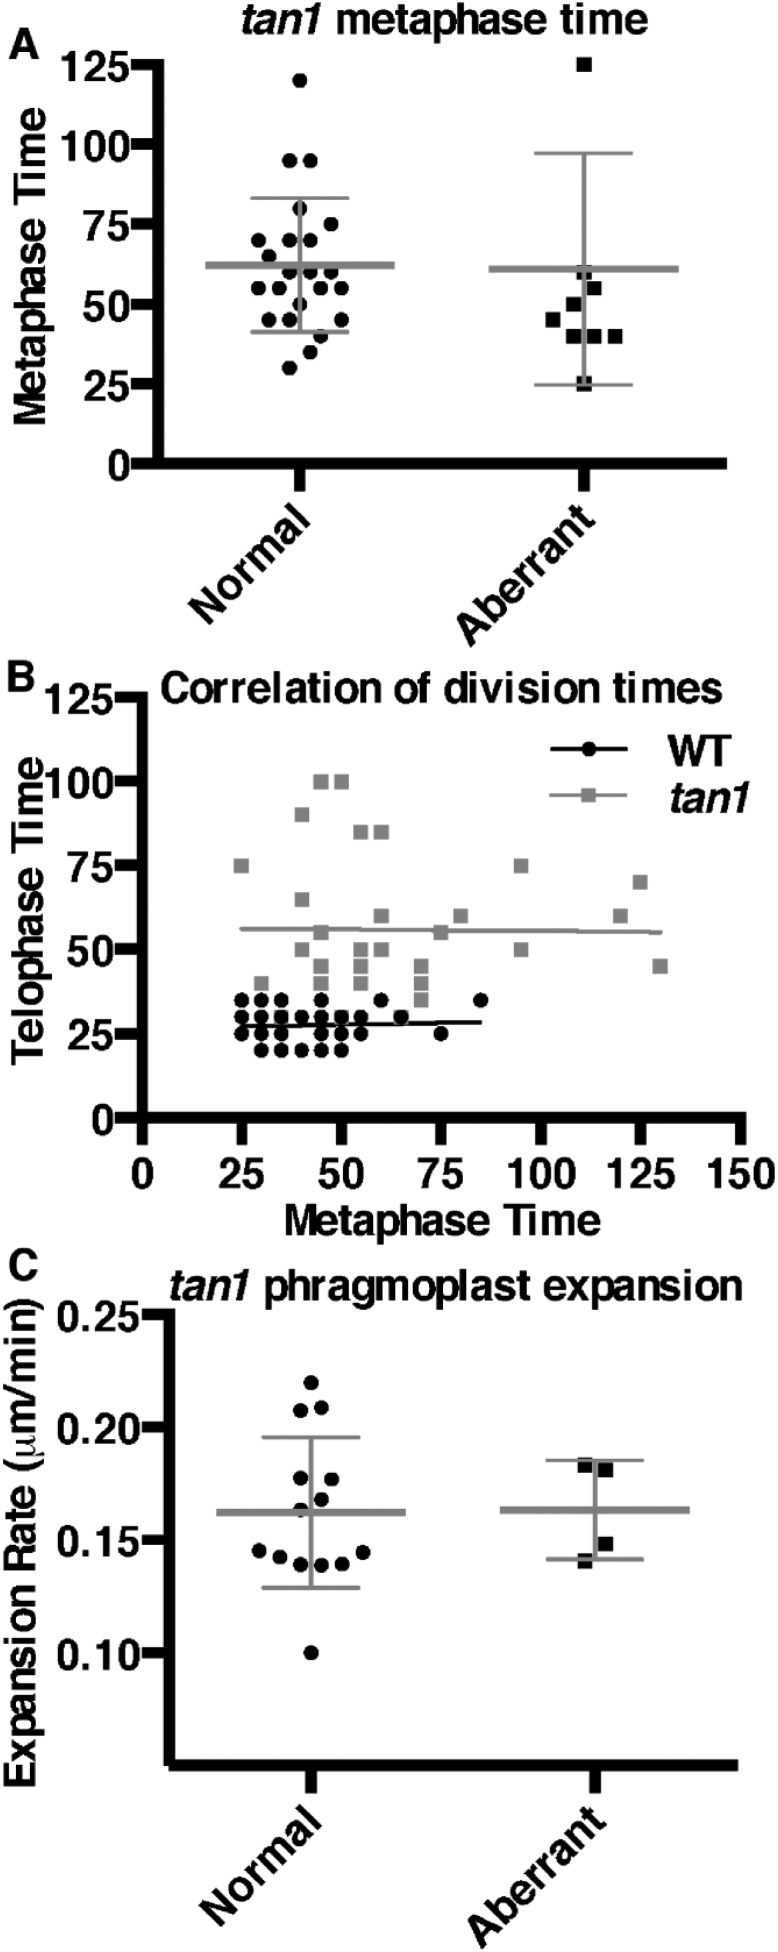
While performing temperature controlled time-lapse imaging (31), we observed that tan1 mutant cells were delayed in both metaphase (Fig. 2A) and telophase (Fig. 2B), but not anaphase compared with wild-type siblings (Fig. S2). Time-lapse imaging was performed by taking a Z-stack every 5 min and assessing at each time the morphology of the mitotic structure. The start of metaphase was counted from the first time the spindle was observed until the anaphase spindle was observed. This time-point became the first time-point for anaphase. Telophase timing was measured from the first time-point a phragmoplast was observed until the phragmoplast was completely disassembled (31). There was no correlation between metaphase delay and defects in phragmoplast guidance to the division site (Fig. S3A), and no correlation between metaphase and telophase delays (Fig. S3B). Next, phragmoplast dynamics were analyzed during telophase to determine whether delays in telophase were a result of slower phragmoplast expansion rates in addition to failure to return to the division site. Phragmoplast expansion (Fig. 2C) and disassembly (Fig. 2D) were slower in tan1 mutant cells versus wild-type, but there was no correlation between slow phragmoplast expansion and misoriented phragmoplast orientation (Fig. S3C) [Kolmogorov–Smirnov (KS) test, P > 0.1]. The delays in metaphase and telophase suggest that TAN1 may alter microtubule stability or dynamics in mitotic microtubule arrays. Lack of correlation between mitotic delays and misguided phragmoplast orientation suggest that mitotic progression and proper division plane orientation may be separate.
Fig. 2.
Histograms of time required to complete mitotic stages of wild-type and tan1 mutant cells. (A) Metaphase times: wild-type (39 min, n = 87) and tan1 (61 min, n = 33), KS test P < 0.0001. (B) Transverse telophase times: wild-type (29 min, n = 70) and tan1 (56 min, n = 33), KS test, P < 0.0001. (C) Phragmoplast expansion rates of wild-type (0.20 ± 0.01 μm/min, n = 18 cells) and tan1 (0.16 ± 0.01 μm/min, n = 18 cells, KS test, P < 0.001). (D) Phragmoplast disassembly times for wild-type (6 min, n = 70) and tan1 (12.5 min, n = 31), KS test, P < 0.0001.
Fig. S2.
Anaphase division time of wild-type and tan1. Histogram of time cells spent in anaphase measured every 5 min. No statistically significant delays are seen between wild-type (6 min, n = 87) and tan1 (6.8 min, n = 33) mutants with this time interval (KS test P = 0.34).
Fig. S3.
Correlation of division dynamics. (A) Metaphase division times for tan1 mutants are not different for correctly oriented division when the new cell wall is in the location predicted by the PPB (62 min, n = 23) or misplaced walls when the new cell wall is not in the location predicted by the PPB (61 min, n = 10) cell. (KS test, P = 0.5761). (B) A longer metaphase division time is not correlated with a longer telophase division time in wild-type (Pearson correlation, P = 0.65) or tan1 (Pearson correlation, P = 0.944). Outliers (ROUT method, Q2) were removed from wild type, and a nonlinear regression fit is shown. (C) Phragmoplast expansion rates for correctly (0.16 µm/min, n = 14 cells) or misplaced (0.16 µm/min, n = 4 cells) cell walls are not significantly different (KS test, P = 0.9163).
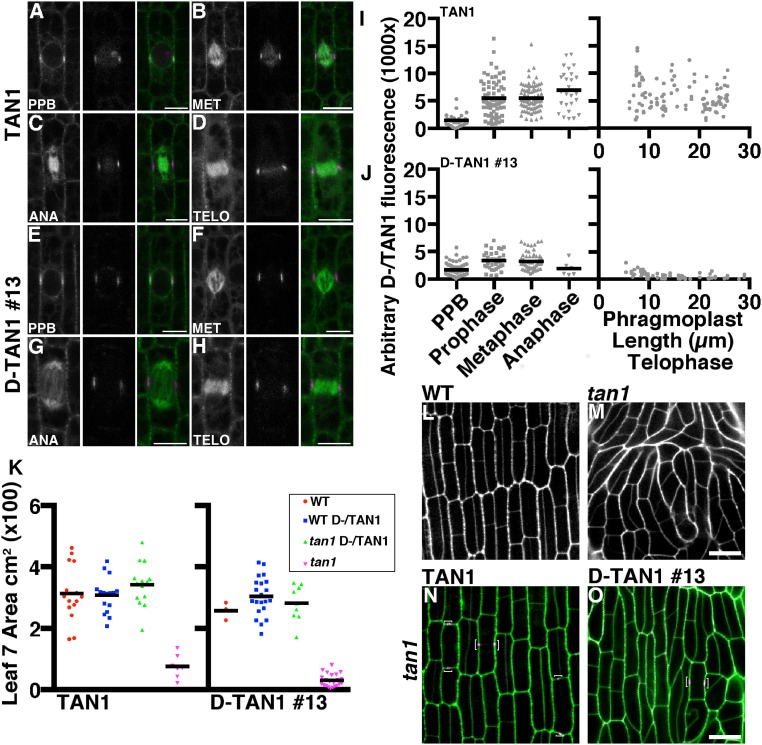
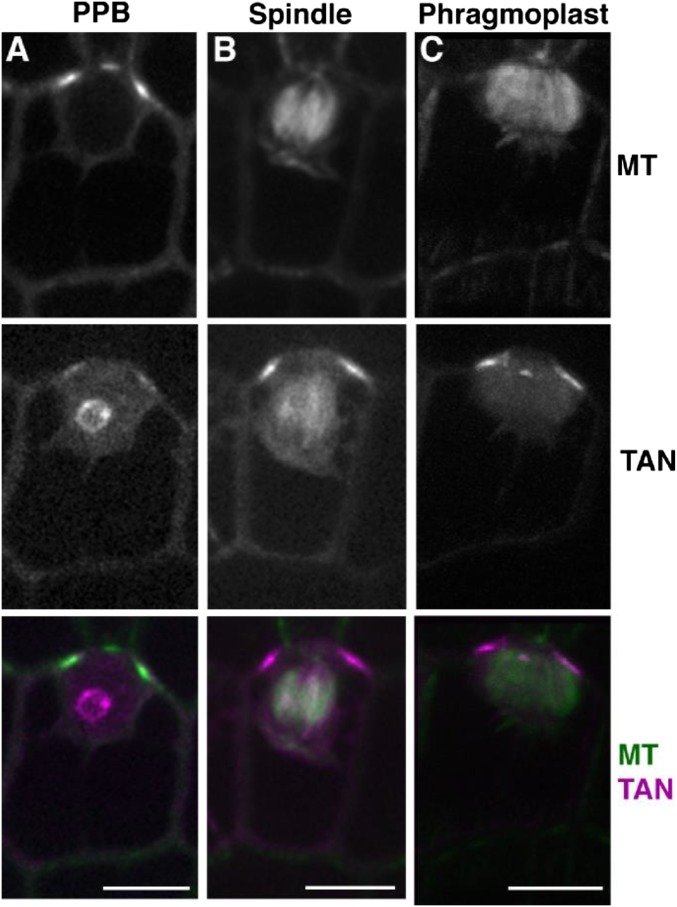
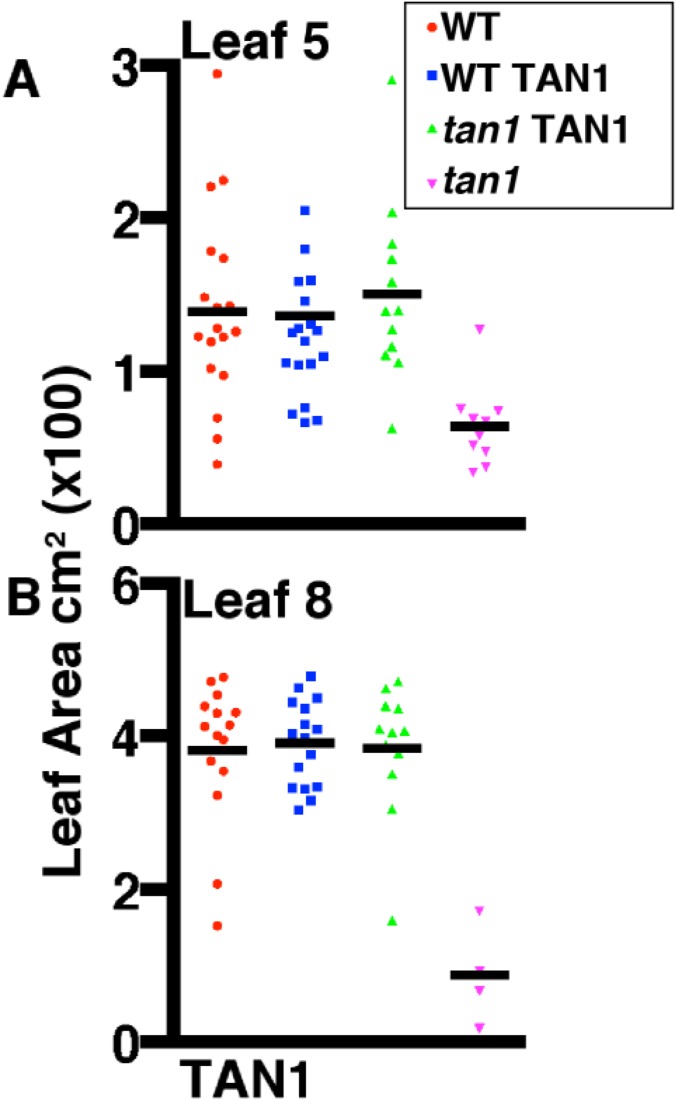
TAN1 driven by its own promoter was fused to YFP and transformed into maize (32): TAN1–YFP fully rescued the mutant phenotype (Fig. 3N) and was observed only in mitotic or late G2 cells. TAN1–YFP localized to the cortical division site in symmetrically (Fig. 3 A–D) and asymmetrically (Fig. S4) dividing cells. Low TAN1–YFP fluorescence intensity was often observed during G2 (Fig. 3I), suggesting that TAN1–YFP was recruited to the division site after PPB formation. After prophase, TAN1–YFP accumulated at the cortical division site and stayed at the same level until the end of telophase (Fig. 3 A–D and I). In addition to cortical division site localization, TAN1–YFP faintly colocalized with the metaphase spindle (Fig. 3B) (∼23% fluorescence intensity compared with TAN1–YFP at the cortical division site, n = 25), anaphase spindle (Fig. 3C) (∼10% fluorescence intensity compared with TAN1–YFP at cortical division site, n = 6), and phragmoplast microtubules (Fig. 3D) (∼15% fluorescence intensity compared with TAN1–YFP at the cortical division site, n = 21). Spindle and phragmoplast localization of TAN1–YFP together with in vitro TAN1–microtubule interaction (22) is consistent with the hypothesis that TAN1 directly alters microtubule dynamics in these structures. AtTAN–YFP did not appear to colocalize with the spindle or phragmoplast in A. thaliana (20, 21). The faint nucleolar localization of TAN1–YFP (Fig. 3A) was similar to that observed in AtTAN–YFP cells (21). TAN1–YFP was crossed into the tan1 mutant to determine if it rescued the mutant phenotype. A population segregating for tan1/+ (Fig. 3L), tan1/tan1 (Fig. 3M), and the TAN1–YFP transgene (Fig. 3N) was assessed for growth by measuring the area of several leaf blades (leaf 7 in Fig. 3K and leaves 5 and 8 in Fig. S5). TAN1–YFP; tan1/tan1 displayed both wild-type growth (Fig. 3K) (KS test, P = 0.16) and cell-wall patterning similar to wild-type (Fig. 3N) (n = 13 individual plants), indicating that TAN1–YFP fully rescued the mutant phenotype.
Fig. 3.
Localization and rescue of TAN1–YFP and D-TAN1-13–YFP during mitosis and cytokinesis. TAN1–YFP (magenta) localization during prophase (A), metaphase (B), anaphase (C), and telophase (D) indicated by CFP–TUBULIN (green). Channels are separated CFP–TUBULIN followed by TAN1–YFP and then merged. D-TAN1-13–YFP (magenta) localization during prophase (E), metaphase (F), anaphase (G), and telophase (H) indicated by CFP–TUBULIN (green). Channels are separated CFP–TUBULIN followed by TAN1–YFP and then merged. Arbitrary fluorescence intensities measured at the division site for TAN1–YFP (I) and D-TAN1 (J) using identical imaging conditions. (K) Leaf 7 area measurements of wild-type and tan1 segregating with TAN1–YFP and D-TAN1-13–YFP. Leaf areas between wild-type and tan1 TAN1–YFP are not statistically different (KS test, P = 0.1994) and are not different between wild-type and tan1 D-TAN1-13–YFP (KS test, P = 0.7091). (L) Wild-type and (M) tan1 epidermal cells stained with propidium iodide (green). (N) TAN1–YFP (magenta) expressed in tan1 mutant background stained with propidium iodide (green). (O) D-TAN1-13–YFP (magenta) in the tan1 mutant background stained with propidium iodide (green). (Scale bars, 10 μm.)
Fig. S4.
(A) Localization of TAN1 in asymmetric dividing cells. TAN1–YFP and the PPB were colocalized during preprophase/prophase in an asymmetrically dividing cell. (B) During metaphase, the TAN1–YFP signal is still present at the cortical division site and (C) localized at the cortex during telophase. This localization matches what is seen in symmetrically dividing cells. (Scale bars, 10 μm.)
Fig. S5.
Leaf 5 and 8 measurements for TAN1–YFP. Maize plants were grown for 28 d: siblings segregating wild-type and tan1 locus with TAN1–YFP were measured to assess rescue. (A) Leaf 5 area measurements are not different between wild-type and tan1 TAN1 plants (KS test, P = 0.9483). (B) Leaf 8 area measurements between wild-type and tan1 TAN1–YFP (KS test, P = 0.9912) are not statistically different from each other, indicating a rescue of the tan1 mutant dwarf phenotype.
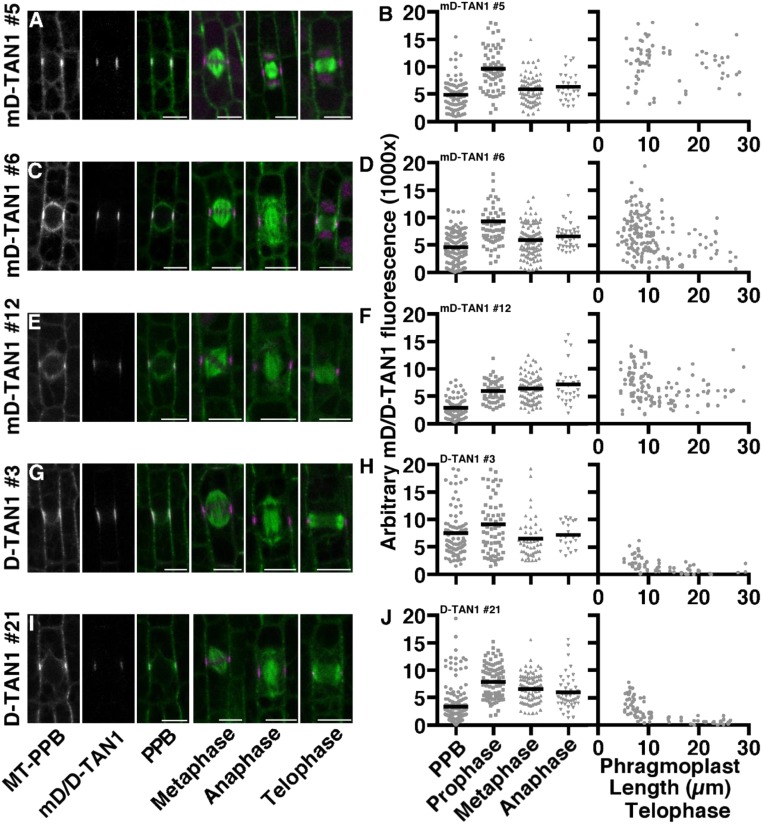
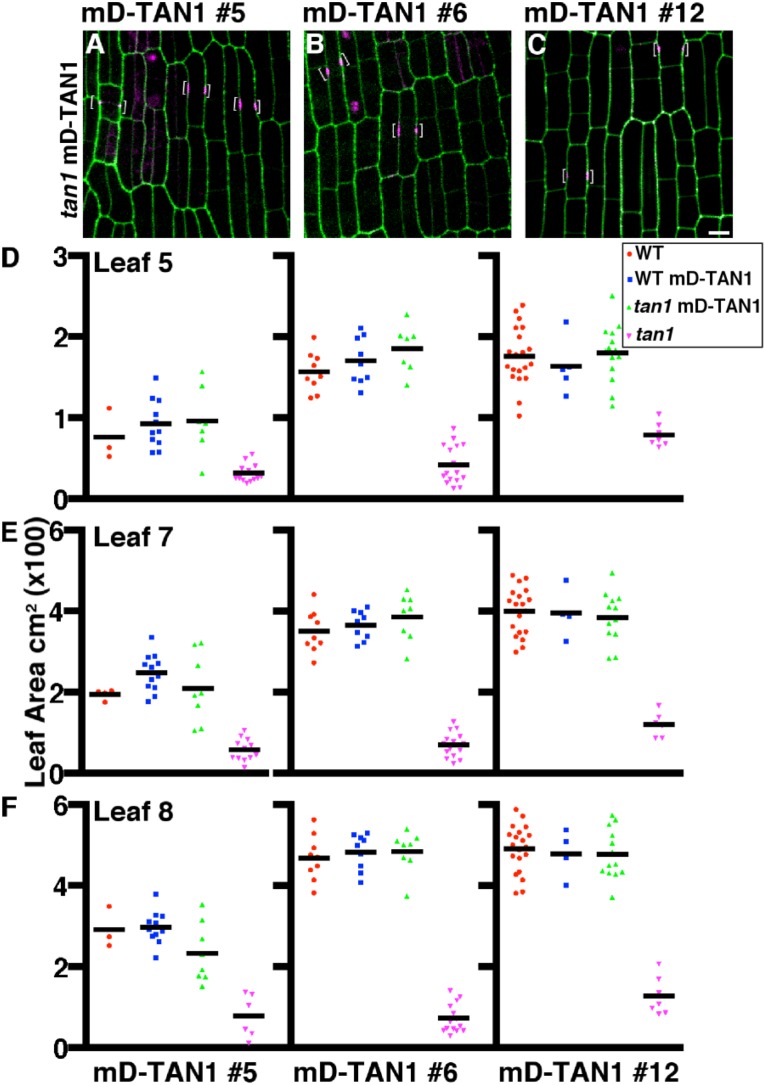
The phragmoplast guidance defect observed in the tan1 mutant (Fig. 1), together with temporally separate AtTAN recruitment to the division site during both prophase and telophase (21), suggested that TAN1 has a critical function during telophase. We used a TAN1–YFP fusion containing the CYCLIN1B (GRMZM2G034647) destruction box (D-TAN1–YFP) to assess the function of TAN1 after anaphase. Maize CYCLIN1B is degraded in anaphase (33) and A. thaliana CYCLIN1B homolog has been used to degrade proteins during anaphase (34, 35). A negative control with a mutated destruction box was also created (mD-TAN1–YFP). Three independently transformed D-TAN1–YFP and mD-TAN1–YFP lines were crossed into lines expressing cyan-fluorescent protein (CFP)–TUBULIN and the tan1 mutant to assess localization and rescue. mD-TAN1–YFP localized to the division site similar to TAN1–YFP and had similar fluorescent intensities (Fig. S6 A–F), indicating that adding a sequence to the N terminus does not alter division site localization or relative fluorescence intensities. All mD-TAN1 lines completely rescued the short stature of the tan1 mutant and had leaves with the same size quantified through measurement of leaf areas (Fig. S7 D–F). D-TAN1–YFP also localized to the division site, but fluorescence signal significantly decreased at the division site as telophase progressed (D-TAN1-13–YFP in Fig. 3 E–H, and J and D-TAN1-3–YFP and D-TAN1-21–YFP in Fig. S6 G–J). Quantification of fluorescence intensities at the division site indicated that D-TAN1–YFP from three independently transformed lines was eliminated in telophase only when the phragmoplast >10 μm and after the majority of transverse divisions were completed (D-TAN1-13–YFP in Fig. 3J D-TAN1-3–YFP and D-TAN1-21–YFP in Fig. S6 H and J). Therefore, the destruction box, although it eventually led to D-TAN1–YFP elimination from the division site, did not eliminate D-TAN1–YFP completely before the majority of cells finished cytokinesis.
Fig. S6.
Localization and expression of mD-/D-TAN1–YFP during mitosis and cytokinesis. (A, C, E, G, and I) Representative images of maize epidermal cells in multiple stages of mitosis expressing CFP–tubulin (green) and mD-TAN1–YFP #5, mD-TAN1–YFP #6, mD-TAN1–YFP #12, D-TAN1–YFP #3, or D-TAN1–YFP #21 (magenta), respectively. Plots for the arbitrary fluorescence intensity values at the CDS for each mD-/D-TAN1–YFP line during individual stages of division are shown in B, D, F, H, and J. Identical imaging conditions were used to measure fluorescence intensity values. Telophase CDS mD-/D-TAN1–YFP intensity values are plotted against phragmoplast length as a proxy for time. (Scale bars, 10 μm.)
Fig. S7.
Rescue of tan1 mutant phenotype using multiple mD-TAN1–YFP lines. Maize epidermal cells from tan1 mutants expressing an individual mD-TAN1–YFP are represented in A–C. Cell walls are stained with propidium iodide (green). Brackets indicate the localization of mD-TAN1–YFP (magenta). Maize plants were grown for 28 d: siblings segregating wild-type and tan1 locus with mD-TAN1–YFP events were measured to assess rescue. Area measurements for each event and genotype are shown for leaf 5 (D), leaf 7 (E), and leaf 8 (F). Measurements for all leaves show that plants which are tan1 mD-TAN1 are not statistically different from wild-type indicating a rescue of the tan1 mutant dwarf phenotype (KS test, P > 0.1732, for all events). (Scale bar, 10 μm.)
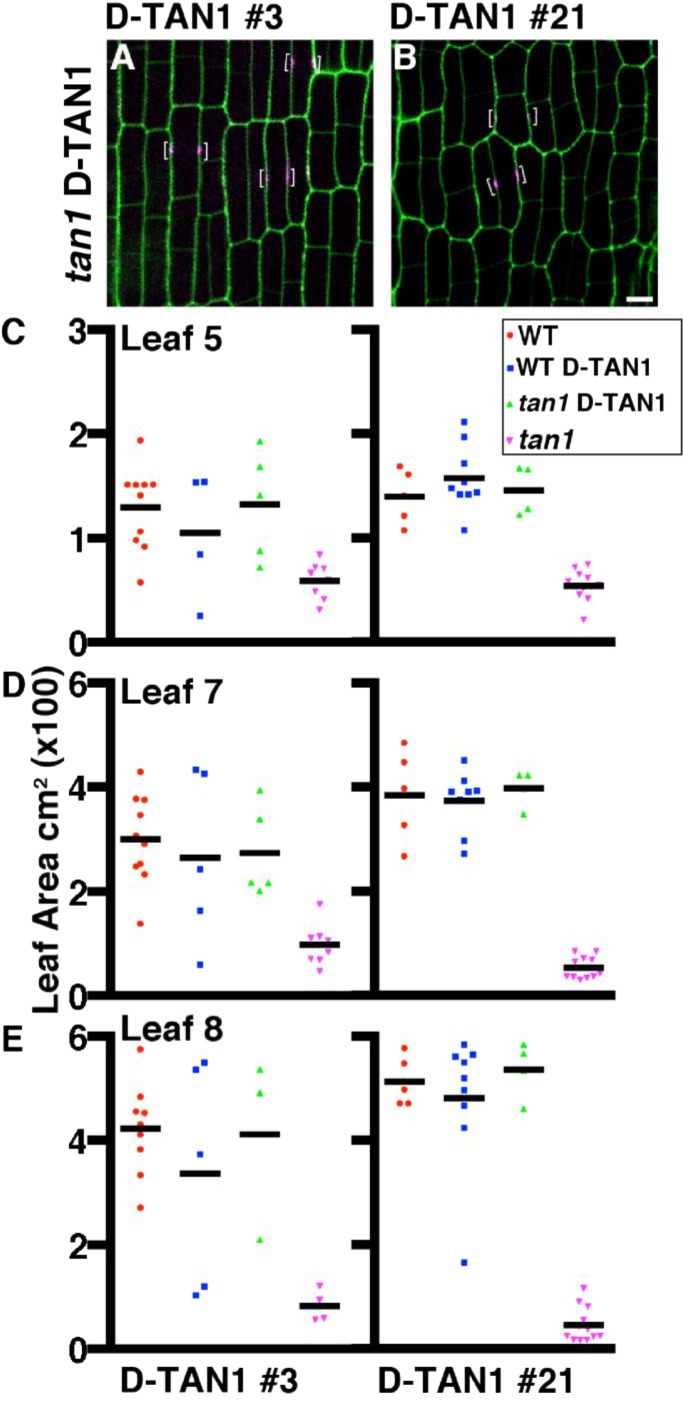
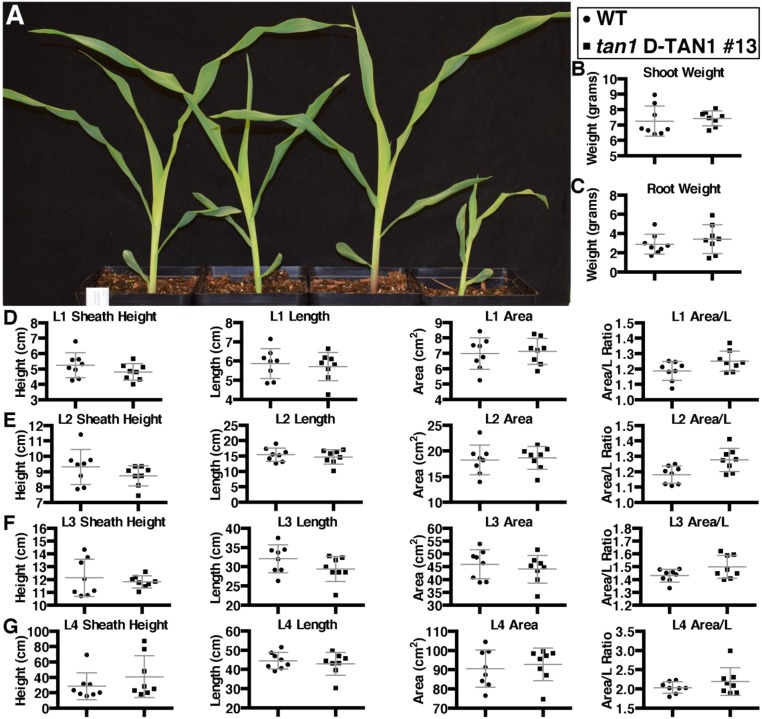
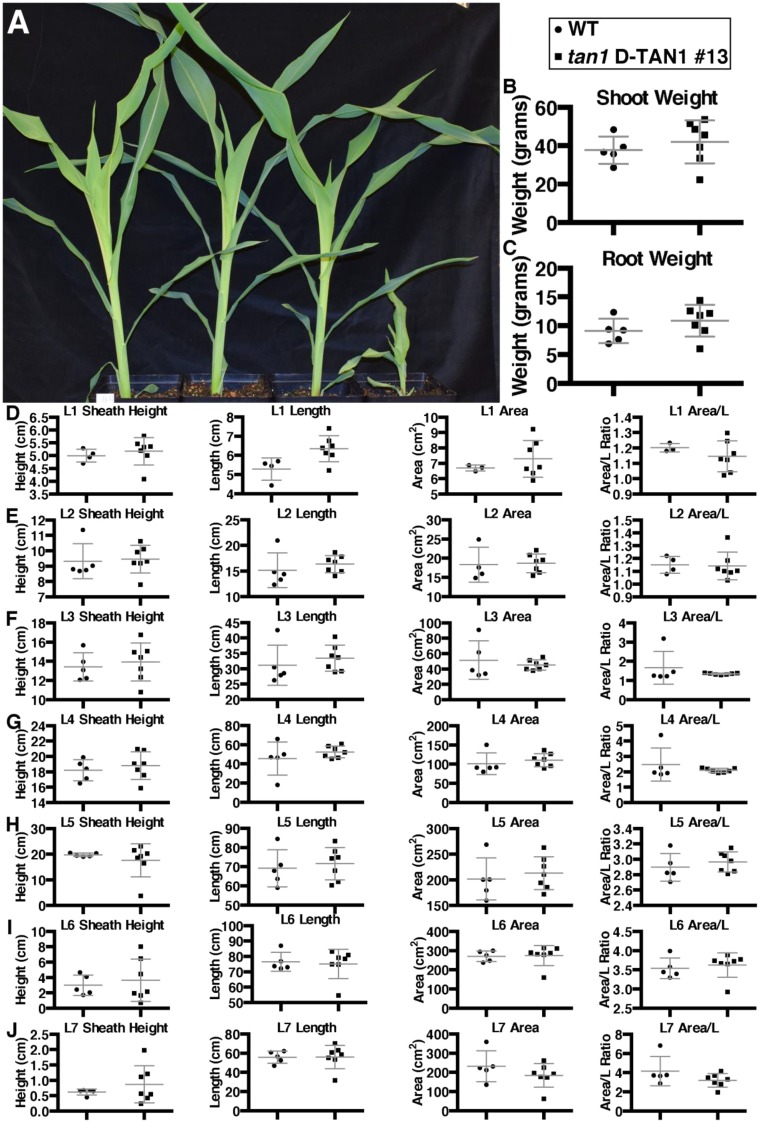
One line containing the D-box-TAN1–YFP fusion, D-TAN1–YFP-13 (Fig. 3 E–H), had low fluorescent intensity at the division site during all mitotic stages, but had exceptionally low intensity during telophase (quantified in Fig. 3J) and had no detectable signal in spindles (Fig. 3 F and G) or phragmoplasts (Fig. 3H). Although all of the mD-TAN1–YFP and two other D-TAN1–YFP transgenes fully rescued the tan1 mutant division plane defects (mD-TAN1–YFP in Fig. S7 A–C and D-TAN1–YFP in Fig. S8 A and B), D-TAN1-13–YFP tan1/tan1, had minor division plane defects first observed by cell-wall staining (Fig. 3O) and then quantified by time-lapse imaging of D-TAN1-13–YFP tan1/tan1 dividing cells (described below). All three of the D-TAN1 lines completely rescued the growth defect of the tan1 mutant quantified via multiple leaf area measurements made at 28 d after planting (D-TAN1 lines #3 and #21 in Fig. S8 C–E). D-TAN1-13–YFP plant development was additionally compared with wild-type siblings at 1 wk (Fig. S9), 2 wk (Fig. S10), and 3 wk (Fig. S11) after planting.
Fig. S8.
Rescue of tan1 mutant phenotype using multiple D-TAN1–YFP lines. (A and B) Maize epidermal cells from tan1 mutants expressing D-TAN1–YFP events. Cell walls are stained with propidium iodide (green). Brackets indicate the localization of D-TAN1–YFP (magenta). Maize plants were grown for 28 d: siblings segregating the tan1 locus and D-TAN1–YFP events were measured to assess rescue. Area measurements for each event and genotype are shown for leaf 5 (C), leaf 7 (D), and leaf 8 (E). Measurements for all leaves show that plants which are tan1 D-TAN1 are not statistically different from wild type, indicating a rescue of the tan1 mutant dwarf phenotype (KS test, P > 0.3506, for all events). (Scale bar, 10 μm.)
Fig. S9.
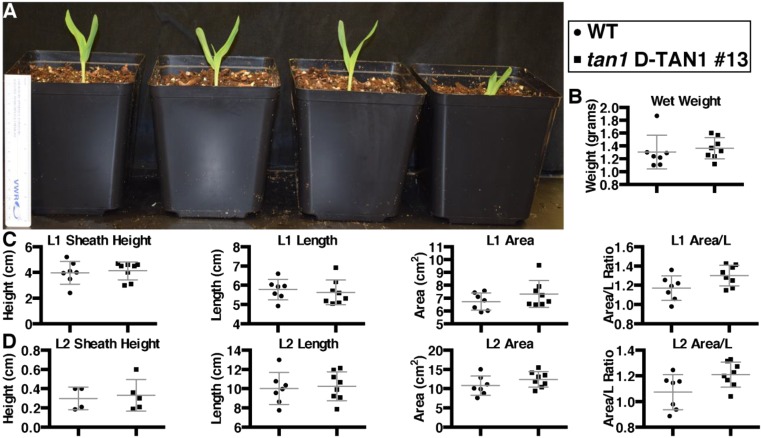
Rescue of tan1 mutant phenotype using D-TAN1-13–YFP after 1 wk of growth. (A) Sibling plants (from left to right) wild type, tan1 D-TAN1-13, wild-type D-TAN1-13, tan1. P value presented corresponds to that from KS test. (B) Total wet weight for wild-type and tan1 D-TAN1-13 is not significantly different (KS test, P = 0.2522). (C) Leaf 1 measurements for sheath height, length, area, and area/length are not different between wild-type and tan1 D-TAN1-13 (KS test, P > 0.2522). (D) Leaf 2 measurements for sheath height, length, area, and area/length are not different between wild-type and tan1 D-TAN1-13 (KS test, P > 0.087).
Fig. S10.
Rescue of tan1 mutant phenotype using D-TAN1-13–YFP after 2 wk of growth. (A) Sibling plants (from left to right) WT, tan1 D-TAN1-13, wild-type D-TAN1-13, tan1. (B) Shoot wet weight for wild-type and tan1 D-TAN1-13 is not significantly different (KS test, P = 0.2827). (C) Root wet weight for wild-type and tan1 D-TAN1-13 is not significantly different (KS test, P = 0.6601). (D) Leaf 1 measurements for sheath height, length, area, and area/length are not different between wild-type and tan1 D-TAN1-13 (KS test, P > 0.2827). (E) Leaf 2 measurements for sheath height, length, area, and area/length are not different between wild-type and tan1 D-TAN1-13 (KS test, P > 0.0870). (F) Leaf 3 measurements for sheath height, length, area, and area/length are not different between wild-type and tan1 D-TAN1-13 (KS test, P > 0.2199). (G) Leaf 4 measurements for sheath height, length, area, and area/length are not different between wild-type and tan1 D-TAN1-13 (KS test, P > 0.6601).
Fig. S11.
Rescue of tan1 mutant phenotype using D-TAN1-13–YFP after 3 wk of growth. (A) Sibling plants (from left to right) wild type, tan1 D-TAN1-13, wild-type D-TAN1-13, tan1. (B) Shoot wet weight for wild-type and tan1 D-TAN1-13 is not significantly different (KS test, P = 0.5455). (C) Root wet weight for wild-type and tan1 D-TAN1-13 is not significantly different (KS test, P = 0.3283). (D) Leaf 1 measurements for sheath height, area, and area/length are not different between wild-type and tan1 D-TAN1-13 (KS test, P > 0.1667); however, length is significantly different (KS test, P = 0.0303). (E) Leaf 2 measurements for sheath height, length, area, and area/length are not different between wild-type and tan1 D-TAN1-13 (KS test, P > 0.0909). (F) Leaf 3 measurements for sheath height, length, area, and area/length are not different between wild-type and tan1 D-TAN1-13 (KS test, P > 0.1414). (G) Leaf 4 measurements for sheath height, length, area, and area/length are not different between wild-type and tan1 D-TAN1-13 (KS test, P > 0.0909). (H) Leaf 5 measurements for sheath height, length, area, and area/length are not different between wild-type and tan1 D-TAN1-13 (KS test, P > 0.4343). (I) Leaf 6 measurements for sheath height, length, area, and area/length are not different between wild-type and tan1 D-TAN1-13 (KS test, P > 0.0909). (J) Leaf 7 measurements for sheath height, length, area, and area/length are not different between wild-type and tan1 D-TAN1-13 (KS test, P > 0.3283).
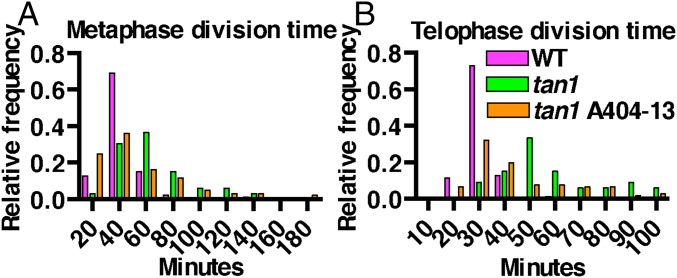
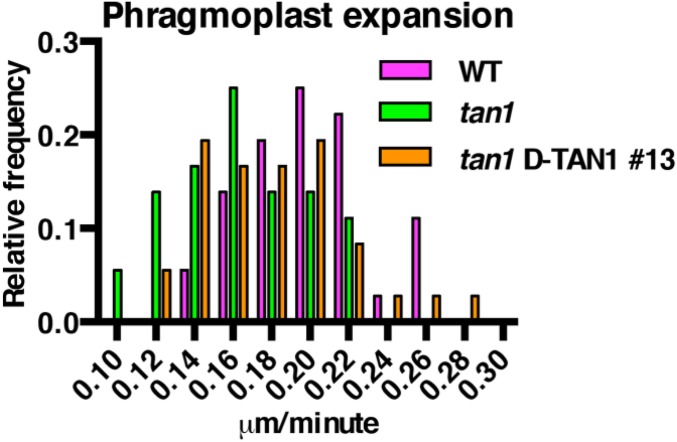
Two hypotheses could explain the division plane defects in D-TAN1-13–YFP tan1/tan1 line: (i) overall low expression of D-TAN1-13–YFP provided insufficient protein to fully rescue the mutant phenotype during all stages; or (ii) low levels of D-TAN1-13–YFP during telophase caused the division plane defect observed. If loss of TAN1 exclusively during telophase caused division plane defects, metaphase division times would be the same as wild-type, whereas telophase times would be longer. In contrast, live-cell imaging indicated that both metaphase and telophase times in D-TAN1-13–YFP tan1/tan1 cells were intermediate between wild-type and tan1 mutants (Fig. 4). During this time-lapse analysis, one aberrant division was observed (n = 1 of 106, < 1%) indicating that D-TAN1-13–YFP tan1/tan1 cells have minor defects in division plane orientation (Movie S4). Phragmoplast expansion rates of tan1 D-TAN1-13 were significantly slower than wild-type, and similar to phragmoplast expansion rates observed in the tan1 mutant (Fig. S12). Total division time of measured mitotic stages (metaphase, anaphase, telophase) for tan1 (average 123 min, n = 33 from Fig. 2 dataset) are delayed by 66% compared with wild-type (average 74 min, n = 70), whereas the D-TAN1-13–YFP tan1/tan1 partial rescue plants (average 94 min, n = 90) have 40% of the mitotic delay seen in the tan1 mutant. Minor division plane orientation defects were observed in D-TAN1-13–YFP tan1/tan1lines (<1%, n = 1 misoriented division of 106 completed divisions) compared with tan1 mutants (∼37%, n = 48). This finding suggested that D-TAN1-13–YFP tan1/tan1 represents a partial loss of function mutant because of low expression rather than a telophase-specific defect. In addition, undetectably low D-TAN1–YFP fluorescent intensities at spindles or phragmoplasts together with observed mitotic delays in D-TAN1-13–YFP tan1/tan1 lines is consistent with a role of TAN1 in altering microtubule dynamics at mitotic structures. Therefore, D-TAN1-13–YFP tan1/tan1 represented a partial loss-of-function mutant, where significant mitotic delays were observed but division plane defects were infrequent.
Fig. 4.
Partial rescue during metaphase and telophase of D-TAN1-13–YFP in the tan1 mutant background. Data for wild-type and tan1 is the same as presented in Fig. 2 A and B, graphed alongside the tan1 D-TAN1-13 data for direct comparison. (A) Metaphase division time for tan1 D-TAN1-13–YFP cells (51 ± 6.4 min, 95% CI, n = 106). Metaphase times are significantly different from wild-type (KS test, P = 0.0027) and from tan1 (KS test, P = 0.0002). (B) Telophase times (36.3 ± 3 min 95% CI n = 90) for transverse cell divisions. Telophase times are significantly different from wild-type (KS test, P < 0.0001) and from tan1 (KS test, P = 0.0007).
Fig. S12.
Phragmoplast expansion rates of wild-type, tan1, and tan1 D-TAN1-13. Phragmoplast expansion rates for wild type and tan1 are presented previously in Fig. 2C. Here, they are included with tan1 D-TAN1-13 values for direct comparison. tan1 D-TAN1-13 expansion rate is 0.17 ± 0.016 μm/min, 95% CI (n = 18). This rate is significantly different from wild type (KS test, P = 0.0183) but not from tan1 (KS test, P = 0.5041).
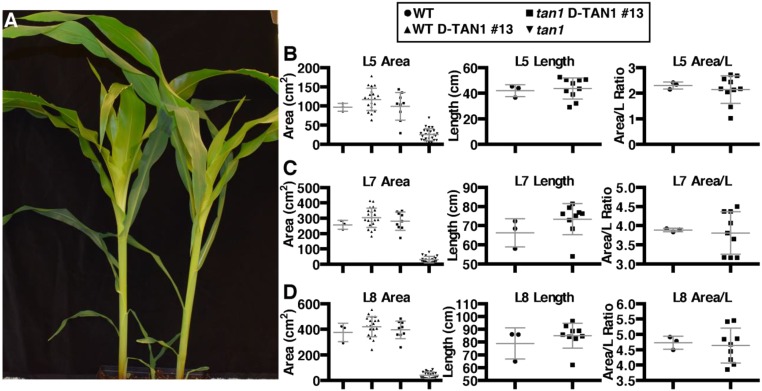
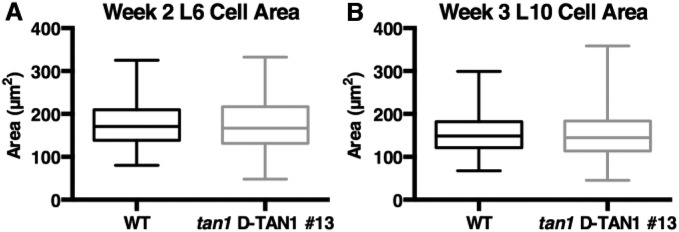
We predicted that the poorly expressed D-TAN1–YFP partial rescue line would have growth defects intermediate to the tan1 mutant and wild-type siblings because it had intermediate cell-cycle delays. However, D-TAN1-13–YFP tan1/tan1 plants grew as well as wild-type siblings. Growth and development of sibling plants was assessed by taking pictures of plants, measuring shoot and root wet weight, and determining length, area and average width of the leaves (Figs. S9–S13). Completely rescued growth of plants with cell-cycle delays and minor division plane defects suggested that defects in cell-cycle progression and minor division plane orientation were corrected, potentially by expansion or by another compensatory mechanism (36). We measured cell area in the proliferative division zone of the maize blade, but no significant difference was observed between sibling wild-type and D-TAN1-13–YFP cells, suggesting either that another compensatory mechanism is used or that the cells compensate by expansion in another part of the leaf (Fig. S14). In some cases, cell-cycle delays do not noticeably alter overall plant (37) or animal (38) growth, but other cell-cycle delays alter embryonic or root patterning in A. thaliana (39, 40). More severe cell-cycle delays using overexpression of cyclin-dependent kinase inhibitor, ICK1, demonstrated that cell expansion could partially compensate for mitotic delays. However, slow cell-cycle progression still led to abnormal growth and development (41).
Fig. S13.
Rescue of tan1 mutant phenotype using D-TAN1-13–YFP after 4 wk of growth. (A) Representative image of sibling wild-type and tan1 D-TAN1-13 28-d-old plants. The plants pictured were not used for the quantification of growth. Leaf areas were measured for wild type, wild-type D-TAN1-13, tan1 D-TAN1-13, and tan1. Length and area/length were measured for wild-type and tan1 D-TAN1-13. (B) Leaf 5 measurements for area, length, and area/length are not different between wild-type and tan1 D-TAN1-13 (KS test, P > 0.4930). Data for leaf 7 area measurement is presented in Fig. 3K. (C) Leaf 7 measurements for area, length, and area/length are not different between wild-type and tan1 D-TAN1-13 (KS test, P > 0.3333). (D) Leaf 8 measurements for area, length, and area/length are not different between wild-type and tan1 D-TAN1-13 (KS test, P > 0.7091).
Fig. S14.
Cell area measurements in dividing leaf tissue. (A) Cell area measurements for leaf 6 after 2 wk of growth is not significantly different (KS test, P = .3429) between wild-type (n = 401 cells) and tan1 D-TAN1-13–YFP (n = 265 cells). (B) Cell area measurements for leaf 10 after 3 wk of growth is not different (KS test, P = .3685) between wild-type (n = 282 cells) and tan1 D-TAN1-13–YFP (n = 192 cells).
The small stature of tan1 mutants suggested that division orientation and proper cell-cycle timing are important aspects of plant growth. The simplest interpretation of the small stature of the tan1mutant compared with the normal growth of the partially rescued D-TAN-13–YFP tan1 line is that proper division orientation is directly required for plant growth. Alternatively, the short stature of the tan1 mutant might indicate slowed growth in response to altered cell shape. Indeed, cell shape and corresponding mechanical constraints influence growth, even in the absence of cell division (36). Another interpretation is that altered cell-wall placement causes unexpected mechanical strain, which then activates a biochemical response, such as the cell-wall integrity pathway, to slow growth (42). These hypotheses are not mutually exclusive.
Most division plane orientation mutants likely also have mitotic delays, although this phenotype has only rarely been assessed (24, 43). In addition, many symmetric division plane orientation mutants have defects in both interphase and mitotic microtubule dynamics, making it impossible to address mitotic and interphase function independently (10–12, 43–47). There are a few mutants that represent intriguing exceptions to highly pleiotropic mutants. One example is the sabre mutant, which has misplaced PPBs rather than defective or absent PPBs, leading to defects in establishing the proper division plane orientation in A. thaliana (48). Another example is a quintupule myosinVIII mutant generated in Physcomitrella patens. These mutants display division plane defects in cells that undergo PPB-independent divisions (49). The MYOSINVIII protein promotes proper phragmoplast guidance while localizing to the spindle, phragmoplast midzone, and the division site. The proposed model is that MYOSINVIII moves along actin filaments to properly translocate the microtubules in the phragmoplast toward the division site (50). TAN1 is only present during mitosis, so mutant analysis provides understanding of mitotic specific division plane orientation and cell-cycle progression. This study highlights the importance of correct division plane orientation and timely cell-cycle progression to maintain proper growth.
Materials and Methods
Plants were grown in standard greenhouse conditions. Transgenic maize lines were generated as part of the maize cell genomics project (maize.jcvi.org/cellgenomics/index.php), including YFP variant Citrine fused to α-TUBULIN (YFP–TUBULIN, GRMZM2G153292) and cyan-fluorescent protein fused to β-TUBULIN (CFP–TUBULIN, GRMZM2G164696) (30). A.L. created the TANGLED1 transgene through translational fusion with the YFP variant Citrine (TAN1–YFP, GRMZM2G039113) described in SI Materials and Methods. Construction of D-TAN1–YFP and mD-TAN1–YFP fused wild-type or mutated CYCLIN1B coding sequence from maize GRMZM2G034647 to the N-terminal end of TAN1 is described in SI Materials and Methods.
All time-lapse and quantitative fluorescent imaging was done using a custom-built spinning disk system (Solamere Technology) described in SI Materials and Methods. Time-lapse imaging experiments were performed using standardized imaging conditions. Four-week-old plants were used and leaves were removed until the ligule height was <2 mm. Adaxial symmetrically dividing blade samples were mounted in water, surrounded by vacuum grease on a coverslip, and loaded with another coverslip placed carefully on top of the sample into a Rose chamber (51) and held at constant temperature (21 °C) (31). Z-stacks of cells in late prophase were taken every 5 min for up to 6 h. Only cells that completed a division from prophase until the new cell wall was formed were used to analyze the timing of cell-cycle stages to ensure that the cells used in the analysis were not damaged during sample preparation. Morphology of mitotic structures labeled with YFP–TUBULIN was assessed to infer mitotic stage. Metaphase timing included first time the spindle was observed until the anaphase spindle was observed. This time-point became the first time-point for anaphase. Anaphase spindles rapidly transitioned to phragmoplasts in telophase. Telophase timing was measured from the first time-point a phragmoplast was observed until the phragmoplast was completely disassembled (31).
For quantification of fluorescence intensities, micrographs were taken of TAN1–YFP, mD-TAN1–YFP, and D-TAN1–YFP lines using standardized imaging conditions. Plants coexpressing CFP–TUBULIN were used to identify each stage of mitosis. Z-stacks were transformed into maximum projections in ImageJ or FIJI (fiji.sc/) using two or more Z slices. Sample movement was corrected using the StackReg Plugin in FIJI. Micrographs for Fig. 3 A–H and Fig. S6 C, E, G, and I were taken with a point scanning confocal microscope (SP5, Leica) with HyD detector with Argon 514-nm laser emission 510–601 nm for each mD- or D-TAN1–YFP and 458 with emission 505–510 nm for CFP–TUBULIN using a 40× NA 1.1 water objective.
Table S1 for primers used in this study.
Table S1.
Primers used for this study
| Primer name | Gene (GRMZM) | Sequence | Purpose |
| TAN-LSP1 | 2G039113 | ACGACCGTTAGCACAGAACC | Differentiate native tan locus from D-box-TAN–YFP |
| ZmTAN- REV2937 | 2G039113 | CGGCAAGAGTCAGAGTAAGAGACAG | Differentiate native tan locus from D-box-TAN–YFP |
| TANR13802 | 2G039113 | GCTTGCTTCCAAGTCCAAGTCTC | Differentiate native tan locus from TAN–YFP |
| ZmTUB-α_RP1 | 2G153292 | GGTTTCGGGTGATCCCTATT | Amplify YFP–TUBULIN |
| Tub B FP1 | 2G164696 | CGAATTTTCGAATCCTCAGC | Amplify CFP–TUBULIN |
| BTUBR3187 | 2G164696 | GACAGGCGGGCATAAGATCC | Amplify CFP–TUBULIN |
SI Materials and Methods
Plant Growth and Genotyping.
Maize plants were grown in 10 cm2 or 7.6 L (2 gallon) pots in standard greenhouse conditions, 16-h light, 8-h dark at the University of Wyoming Agriculture Experiment Station or at University of California, Riverside Agricultural Operations (agops.ucr.edu). Seeds were planted, and grown to two to four leaves and then they were tested the transgenes by applying 4 g/L glufosinate (Finale, Bayer) in 0.1% Tween 20 (Sigma) to leaves. Resistance to glufosinate was assessed after 2–5 d. If genotyping was necessary, DNA was extracted using a TissueLyser (Qiagen) and PCR was performed using KOD Hot Start or Extreme Hot start polymerase (EMD Millipore) using the manufacturer’s conditions supplemented with 7% (vol/vol) DMSO. Primers are listed in the Table S1. Seed genotyping followed protocol described previously (52).
Toluidine Blue O Staining and Analysis.
Toluidine Blue O (TBO, Fisher Scientific) staining was performed on mature leaf number 8 of 3- to 5-wk-old tan1 mutant and wild-type sibling maize epidermal peels, as previously described (12). Briefly, adult leaf 8 leaves were harvested, cut into ∼1-cm2 squares and then fixed in 3.7% (vol/vol) paraformaldehyde for 1 to 3 h, washed, digested with 0.1% Pectolyase (Sigma Aldrich) for 2 h, and washed in water. Using forceps, the epidermis was gently removed and stained in 0.1% TBO in 0.1 M sodium acetate buffer pH 4 for 10 min, then washed in water for two 10-min washes. Color micrographs were taken of adaxial and abaxial adult leaf peels using an Arcturus XT Laser Capture Microdissection Microscope (Arcturus, IIGB Microscopy Facility). Then, four tan1 mutant and five sibling wild-type micrographs were randomly chosen to analyze cells. All of the cells in each micrograph were counted, categorized by type, and observed for the presence of multiple nuclei or cell-wall stubs. These micrographs were used to quantify the subsidiary cell division plane defect. Subsidiary cells were identified by their location and pink color. Each subsidiary cell in the micrographs were categorized as normally or abnormally shaped.
Construction of TAN1–YFP, mD-TAN1–YFP, and D-TAN1–YFP.
A full-length, native promoter-driven TAN1–YFP translational fusion was created by A.L. with 2,489 bp native promoters and 1,440 native terminator (32). The TAN1 native promoter sequence was obtained by subcloning and sequencing of an EcoRI fragment from ZMMBLc-3L9 (Arizona Genomics Institute). The construction of the CYCLIN1b destruction box TANGLED–YFP fusion (D-TAN1–YFP) used to eliminate the TAN1 protein during anaphase. First, the CYCLIN1B coding sequence from maize GRMZM2G034647 was aligned with the coding sequence of the Arabidopsis thaliana cyclin1b homolog AT5G06150. The homologous N-terminal region containing the D-box used to eliminate the kinesin RUNKEL during anaphase (34) and Aurora kinase (35) was identified for maize cyclin1b. The maize Cyclin1b sequence was fused in frame to the N terminus of TAN1–YFP using overlap PCR (53) and ligated into pGEMT (Promega). The DNA sequence was verified by sequencing (University of California, Davis sequencing, http:dnaseq.ucdavis.edu/) and then cloned via restriction endonuclease KpnI (New England Biolabs) digest into the TAN1–YFP in pENTR221 (Gateway, Invitrogen) to create D-TAN1–YFP. LR recombination was performed according to the manufacturer’s instructions to insert D-TAN1–YFP into the pAM1006 binary vector (54). Subsequently, sequence-verified plasmids were transformed into Agrobacterium tumefaciens strain EHA101 (55). For the control, the same sequence used for construction of the D-TAN1–YFP fusion was made, except two critical amino acids were mutated by overlap PCR (53) in the destruction box region of the CYCLIN1b portion to inactivate the ability of the destruction box to bind to CDK (GXXV). The mutated D-TAN1–YFP construct was verified by sequencing and called mD-TAN1–YFP.
Transgenic plantlets were generated by Iowa State Plant Transformation Facility in the hybrid HiII background (B73 X A188, PTF; Kan Wang, Iowa State University, Ames, IA) and sent to the University of California, San Diego or University of Wyoming, where they were screened by microscopy or glufosinate resistance for expression of the transgene, and then crossed to tan1/tan1 mutants or into lines expressing CFP–TUBULIN.
Analysis of TAN1–YFP and mD-TAN1–YFP and D-TAN1–YFP Arbitrary Fluorescence Intensities.
The TAN1–YFP and mD- or D-TAN1–YFP fluorescence intensity was measured with an average area of 0.7 μm2 at the cortical division site. The recorded values were taken from the highest intensity signal in one Z plane (0.5-μm steps) for each side of the cell cortex. Intensity values of the TAN1–YFP, mD-TAN1–YFP, and D-TAN1–YFP signal in cells during preprophase were recorded when the PPB had condensed to a width of 2 μm or less. In lines expressing D-TAN1–YFP, when cells in telophase did not contain detectable D-TAN1–YFP signal at the cortex, the intensity was measured at the expected site of TAN1–YFP localization based on the trajectory of the phragmoplast. Average arbitrary background fluorescence across samples under standard imaging conditions was 4,650 AU; this value was subtracted from measured values for analysis and figures. Quantification of fluorescence intensities at the division site indicated that D-TAN1–YFP was eliminated during telophase only after the majority of transverse divisions were completed when the phragmoplast > 10 μm (main text, Fig. 3J, and Fig. S6 H and J).
Analysis of TAN1-YFP and mD/D-TAN1-YFP Rescue of the tan1 Mutant.
In addition to observing TAN1–YFP, mD-TAN1–YFP, and D-TAN1–YFP at the division site by microscopy, the function of TAN1–YFP, mD-TAN1–YFP, and D-TAN1–YFP was assessed by backcrossing lines expressing TAN1–YFP or mD-/D-TAN1–YFP into the tan1 mutant twice. Three independent transformed lines of mD-TAN1–YFP and D-TAN1–YFP were used to assess their ability to rescue the tan1 mutant phenotype. In this crossing scheme, the first cross produced tan1/+ progeny that were then painted with glufosinate to identify plants containing the transgene. Those that contained the transgene (tan1/+; TAN1–YFP, mD-TAN1–YFP, or D-TAN1–YFP) were crossed to tan1/tan1 to create progeny which are 25% tan1/tan1; TAN1–YFP mD- TAN1–YFP, or D-TAN1–YFP, 25% tan1/+ TAN1–YFP, mD-TAN1–YFP or D-TAN1–YFP, 25% tan/tan1, and 25% tan1/+. To confirm that TAN1–YFP, mD-TAN1–YFP, and D-TAN1–YFP proteins rescued the mutant phenotype, the glufosinate-resistant plants were genotyped by PCR for the absence of the wild-type tan1 locus and the presence of the transgene. If the tan1 locus was wild-type or heterozygous, the primers amplified a small band corresponding to the native tan1 locus in addition to the 1.2-kb larger mD- or D-TAN1–YFP transgene or 1.7-kb band for TAN1–YFP. However, in tan1 mutants, a 6.7-kb Cinful-Zeon type retrotransposon disrupts the tan1 locus and prevents PCR amplification, allowing unique identification of TAN1–YFP, mD-TAN1–YFP, or D-TAN1–YFP tan1/tan1 plants.
Plant Measurements.
For TAN1–YFP and all mD-/D-TAN1–YFP, leaf area measurements were made to compare 28-d-old wild-type siblings, those that were tan1 mutants expressing TAN1–YFP, mD-TAN1–YFP, or D-TAN1–YFP and those that were tan1 mutants. Leaf area measurements were done by removing the blade of a specified leaf at the ligule, scanning it on a flatbed scanner (Cannon) together with a ruler. The images were imported into FIJI and thresholding performed to extract leaf area measurements. For D-TAN1-13–YFP and wild-type siblings, additional measurements were taken by measuring all of the tissues for weeks 1, 2, and 3 after planting. Plants were weighed immediately after washing debris and soil from roots on a digital scale (Mettler Toledo). Leaf sheath and leaf length was measured from the plants with a ruler or digital calipers. Leaf blades were scanned on a flatbed scanner (Cannon) for area measurements. Statistical analysis was performed using KS test for all measurements through the program PRISM 6 (GraphPad).
Confocal Microscopy.
All time-lapse imaging was performed using a custom-built spinning disk (Solamere Technology) with a Yokagawa W1 spinning disk (Yokagawa), EM-CCD camera (Hamamatsu 9100c), and a Nikon Eclipse TE (Nikon) inverted stand. A 40× water immersion lens (1.15 NA) or 60× water immersion lens (1.2 NA) were used with perfluorcarbon immersion liquid (RIAAA-678, Cargille). The stages is fully motorized and controlled by Micromanager software (www.micromanager.org) with ASI Peizo (300-μm range) and 3 axis DC servo motor controller. Solid-state lasers (Obis from 40 to 100 mW) and standared emission filters (Chroma Technology) were used. For YFP–TUBULIN, TAN1–YFP, mD-TAN1–YFP, or D-TAN1–YFP, a 514 laser with emission filter 540/30 was used. For CFP–TUBULIN, a 445 laser with emission filter 480/40 was used. For propidium iodide, a 561 laser with emission filter 620/60 was used.
Scanning Electron Microscopy.
Leaves were sequentially removed from 28-d-old tan1 mutant and wild-type sibling maize plants until a sheath height of ∼2 mm was observed. The adaxial blade region just above the ligule toward the margin was freshly dissected and mounted onto a piece of double-sided tape then loaded into the tabletop scanning electron microscope (Hitachi TM-1000). Micrographs were taken using Hitachi software.
Supplementary Material
Acknowledgments
We thank Professors Laurie Smith (University of California, San Diego) for initial TAN1–YFP crosses, Thomas Eulgem (University of California, Riverside), J. Gatlin (University of Wyoming), Zhaojie Zhang (University of Wyoming), and Dr. David Carter (University of California, Riverside) for microscope use. We also thank the University of Wyoming Agriculture Experiment Station and University of California, Riverside Agricultural Operations for greenhouse and field space; the Plant Transformation Facility (Dr. Kan Wang and Bronwyn Frame, Iowa State University) for maize transformation; and Leslie Z. Aranda, McKenzie R. Pickle, Victoria H. Morris, Leticia Meza, and Lindy A. Allsman for help with measuring leaf areas. A.S. is appreciative of the collaborative interactions with the maize cell genomics group. A.S. provided field space, funds, and reagents to create and transform mD-TAN1-YFP and D-TAN1-YFP into maize and supported initial analysis and imaging of the lines. An IDeA-National Institute of General Medical Sciences-NIH Grant P30-GM103398 (to the University of Wyoming) supplemented use of scanning electron microscope. This work was supported by National Science Foundation Grants DBI-0501862 and MCB-1027445 (to A.S.) and National Science Foundation Grants NSF-MCB-1505848, NSF-MCB-1244202, and US Department of Agriculture Grant USDA-NIFA-CA-R-BPS-5108-H (to C.G.R.).
Footnotes
The authors declare no conflict of interest.
This article is a PNAS Direct Submission.
This article contains supporting information online at www.pnas.org/lookup/suppl/doi:10.1073/pnas.1619252114/-/DCSupplemental.
References
- 1.Kaplan DR, Hagemann W. The relationship of cell and organism in vascular plants. Bioscience. 1991;41(10):693–703. [Google Scholar]
- 2.Beemster GTS, Fiorani F, Inzé D. Cell cycle: The key to plant growth control? Trends Plant Sci. 2003;8(4):154–158. doi: 10.1016/S1360-1385(03)00046-3. [DOI] [PubMed] [Google Scholar]
- 3.Rasmussen CG, Wright AJ, Müller S. The role of the cytoskeleton and associated proteins in determination of the plant cell division plane. Plant J. 2013;75(2):258–269. doi: 10.1111/tpj.12177. [DOI] [PubMed] [Google Scholar]
- 4.Murata T, et al. Mechanism of microtubule array expansion in the cytokinetic phragmoplast. Nat Commun. 2013;4:1967. doi: 10.1038/ncomms2967. [DOI] [PMC free article] [PubMed] [Google Scholar]
- 5.Jürgens G. Cytokinesis in higher plants. Annu Rev Plant Biol. 2005;56:281–299. doi: 10.1146/annurev.arplant.55.031903.141636. [DOI] [PubMed] [Google Scholar]
- 6.Van Damme D. Division plane determination during plant somatic cytokinesis. Curr Opin Plant Biol. 2009;12(6):745–751. doi: 10.1016/j.pbi.2009.09.014. [DOI] [PubMed] [Google Scholar]
- 7.Chan J, Calder G, Fox S, Lloyd C. Localization of the microtubule end binding protein EB1 reveals alternative pathways of spindle development in Arabidopsis suspension cells. Plant Cell. 2005;17(6):1737–1748. doi: 10.1105/tpc.105.032615. [DOI] [PMC free article] [PubMed] [Google Scholar]
- 8.Ambrose JC, Cyr R. Mitotic spindle organization by the preprophase band. Mol Plant. 2008;1(6):950–960. doi: 10.1093/mp/ssn054. [DOI] [PubMed] [Google Scholar]
- 9.Buschmann H, et al. Microtubule-associated AIR9 recognizes the cortical division site at preprophase and cell-plate insertion. Curr Biol. 2006;16(19):1938–1943. doi: 10.1016/j.cub.2006.08.028. [DOI] [PubMed] [Google Scholar]
- 10.Camilleri C, et al. The Arabidopsis TONNEAU2 gene encodes a putative novel protein phosphatase 2A regulatory subunit essential for the control of the cortical cytoskeleton. Plant Cell. 2002;14(4):833–845. doi: 10.1105/tpc.010402. [DOI] [PMC free article] [PubMed] [Google Scholar]
- 11.Azimzadeh J, et al. Arabidopsis TONNEAU1 proteins are essential for preprophase band formation and interact with centrin. Plant Cell. 2008;20(8):2146–2159. doi: 10.1105/tpc.107.056812. [DOI] [PMC free article] [PubMed] [Google Scholar]
- 12.Wright AJ, Gallagher K, Smith LG. discordia1 and alternative discordia1 function redundantly at the cortical division site to promote preprophase band formation and orient division planes in maize. Plant Cell. 2009;21(1):234–247. doi: 10.1105/tpc.108.062810. [DOI] [PMC free article] [PubMed] [Google Scholar]
- 13.De Smet I, Beeckman T. Asymmetric cell division in land plants and algae: The driving force for differentiation. Nat Rev Mol Cell Biol. 2011;12(3):177–188. doi: 10.1038/nrm3064. [DOI] [PubMed] [Google Scholar]
- 14.Kajala K, et al. Omics and modelling approaches for understanding regulation of asymmetric cell divisions in Arabidopsis and other angiosperm plants. Ann Bot (Lond) 2014;113(7):1083–1105. doi: 10.1093/aob/mcu065. [DOI] [PMC free article] [PubMed] [Google Scholar]
- 15.Facette MR, Smith LG. Division polarity in developing stomata. Curr Opin Plant Biol. 2012;15(6):585–592. doi: 10.1016/j.pbi.2012.09.013. [DOI] [PubMed] [Google Scholar]
- 16.Fisher AP, Sozzani R. Uncovering the networks involved in stem cell maintenance and asymmetric cell division in the Arabidopsis root. Curr Opin Plant Biol. 2016;29:38–43. doi: 10.1016/j.pbi.2015.11.002. [DOI] [PubMed] [Google Scholar]
- 17.Shao W, Dong J. Polarity in plant asymmetric cell division: Division orientation and cell fate differentiation. Dev Biol. 2016;419(1):121–131. doi: 10.1016/j.ydbio.2016.07.020. [DOI] [PMC free article] [PubMed] [Google Scholar]
- 18.van Dop M, Liao C-Y, Weijers D. Control of oriented cell division in the Arabidopsis embryo. Curr Opin Plant Biol. 2015;23:25–30. doi: 10.1016/j.pbi.2014.10.004. [DOI] [PubMed] [Google Scholar]
- 19.Han S-K, Torii KU. Lineage-specific stem cells, signals and asymmetries during stomatal development. Development. 2016;143(8):1259–1270. doi: 10.1242/dev.127712. [DOI] [PubMed] [Google Scholar]
- 20.Walker KL, Müller S, Moss D, Ehrhardt DW, Smith LG. Arabidopsis TANGLED identifies the division plane throughout mitosis and cytokinesis. Curr Biol. 2007;17(21):1827–1836. doi: 10.1016/j.cub.2007.09.063. [DOI] [PMC free article] [PubMed] [Google Scholar]
- 21.Rasmussen CG, Sun B, Smith LG. Tangled localization at the cortical division site of plant cells occurs by several mechanisms. J Cell Sci. 2011;124(Pt 2):270–279. doi: 10.1242/jcs.073676. [DOI] [PubMed] [Google Scholar]
- 22.Smith LG, Gerttula SM, Han S, Levy J. Tangled1: A microtubule binding protein required for the spatial control of cytokinesis in maize. J Cell Biol. 2001;152(1):231–236. doi: 10.1083/jcb.152.1.231. [DOI] [PMC free article] [PubMed] [Google Scholar]
- 23.Smith LG, Hake S, Sylvester AW. The tangled-1 mutation alters cell division orientations throughout maize leaf development without altering leaf shape. Development. 1996;122(2):481–489. doi: 10.1242/dev.122.2.481. [DOI] [PubMed] [Google Scholar]
- 24.Lipka E, et al. The phragmoplast-orienting kinesin-12 class proteins translate the positional information of the preprophase band to establish the cortical division zone in Arabidopsis thaliana. Plant Cell. 2014;26(6):2617–2632. doi: 10.1105/tpc.114.124933. [DOI] [PMC free article] [PubMed] [Google Scholar]
- 25.Feng Y, et al. Sox9 induction, ectopic Paneth cells, and mitotic spindle axis defects in mouse colon adenomatous epithelium arising from conditional biallelic Apc inactivation. Am J Pathol. 2013;183(2):493–503. doi: 10.1016/j.ajpath.2013.04.013. [DOI] [PMC free article] [PubMed] [Google Scholar]
- 26.Yamashita YM, Jones DL, Fuller MT. Orientation of asymmetric stem cell division by the APC tumor suppressor and centrosome. Science. 2003;301(5639):1547–1550. doi: 10.1126/science.1087795. [DOI] [PubMed] [Google Scholar]
- 27.Poulton JS, Mu FW, Roberts DM, Peifer M. APC2 and Axin promote mitotic fidelity by facilitating centrosome separation and cytoskeletal regulation. Development. 2013;140(20):4226–4236. doi: 10.1242/dev.094425. [DOI] [PMC free article] [PubMed] [Google Scholar]
- 28.Mitkovski M, Sylvester AW. Analysis of cell patterns in developing maize leaves: Dark-induced cell expansion restores normal division orientation in the mutant tangled. Int J Plant Sci. 2003;164(1):113–124. [Google Scholar]
- 29.Cleary AL, Smith LG. The Tangled1 gene is required for spatial control of cytoskeletal arrays associated with cell division during maize leaf development. Plant Cell. 1998;10(11):1875–1888. doi: 10.1105/tpc.10.11.1875. [DOI] [PMC free article] [PubMed] [Google Scholar]
- 30.Mohanty A, et al. Advancing cell biology and functional genomics in maize using fluorescent protein-tagged lines. Plant Physiol. 2009;149(2):601–605. doi: 10.1104/pp.108.130146. [DOI] [PMC free article] [PubMed] [Google Scholar]
- 31.Rasmussen CG. Using live-cell markers in maize to analyze cell division orientation and timing. In: Caillaud M-C, editor. Plant Cell Division. Springer; New York: 2016. pp. 209–225. [DOI] [PubMed] [Google Scholar]
- 32.Wu Q, Luo A, Zadrozny T, Sylvester A, Jackson D. Fluorescent protein marker lines in maize: Generation and applications. Int J Dev Biol. 2013;57(6-8):535–543. doi: 10.1387/ijdb.130240qw. [DOI] [PubMed] [Google Scholar]
- 33.Mews M, et al. Mitotic cyclin distribution during maize cell division: Implications for the sequence diversity and function of cyclins in plants. Protoplasma. 1997;200(3):128–145. [Google Scholar]
- 34.Krupnova T, et al. Microtubule-associated kinase-like protein RUNKEL needed [corrected] for cell plate expansion in Arabidopsis cytokinesis. Curr Biol. 2009;19(6):518–523, erratum in Curr Biol 2009, 19(6):536. doi: 10.1016/j.cub.2009.02.021. [DOI] [PubMed] [Google Scholar]
- 35.Van Damme D, et al. Arabidopsis α Aurora kinases function in formative cell division plane orientation. Plant Cell. 2011;23(11):4013–4024. doi: 10.1105/tpc.111.089565. [DOI] [PMC free article] [PubMed] [Google Scholar]
- 36.Bassel GW, et al. Mechanical constraints imposed by 3D cellular geometry and arrangement modulate growth patterns in the Arabidopsis embryo. Proc Natl Acad Sci USA. 2014;111(23):8685–8690. doi: 10.1073/pnas.1404616111. [DOI] [PMC free article] [PubMed] [Google Scholar]
- 37.Hemerly A, et al. Dominant negative mutants of the Cdc2 kinase uncouple cell division from iterative plant development. EMBO J. 1995;14(16):3925–3936. doi: 10.1002/j.1460-2075.1995.tb00064.x. [DOI] [PMC free article] [PubMed] [Google Scholar]
- 38.Neufeld TP, de la Cruz AF, Johnston LA, Edgar BA. Coordination of growth and cell division in the Drosophila wing. Cell. 1998;93(7):1183–1193. doi: 10.1016/s0092-8674(00)81462-2. [DOI] [PubMed] [Google Scholar]
- 39.Jenik PD, Jurkuta RE, Barton MK. Interactions between the cell cycle and embryonic patterning in Arabidopsis uncovered by a mutation in DNA polymerase epsilon. Plant Cell. 2005;17(12):3362–3377. doi: 10.1105/tpc.105.036889. [DOI] [PMC free article] [PubMed] [Google Scholar]
- 40.Sozzani R, et al. Spatiotemporal regulation of cell-cycle genes by SHORTROOT links patterning and growth. Nature. 2010;466(7302):128–132. doi: 10.1038/nature09143. [DOI] [PMC free article] [PubMed] [Google Scholar]
- 41.Wang H, Zhou Y, Gilmer S, Whitwill S, Fowke LC. Expression of the plant cyclin-dependent kinase inhibitor ICK1 affects cell division, plant growth and morphology. Plant J. 2000;24(5):613–623. doi: 10.1046/j.1365-313x.2000.00899.x. [DOI] [PubMed] [Google Scholar]
- 42.Voxeur A, Höfte H. Cell wall integrity signaling in plants: “To grow or not to grow that’s the question”. Glycobiology. 2016;26(9):950–960. doi: 10.1093/glycob/cww029. [DOI] [PubMed] [Google Scholar]
- 43.Kawamura E, et al. MICROTUBULE ORGANIZATION 1 regulates structure and function of microtubule arrays during mitosis and cytokinesis in the Arabidopsis root. Plant Physiol. 2006;140(1):102–114. doi: 10.1104/pp.105.069989. [DOI] [PMC free article] [PubMed] [Google Scholar]
- 44.Spinner L, et al. The function of TONNEAU1 in moss reveals ancient mechanisms of division plane specification and cell elongation in land plants. Development. 2010;137(16):2733–2742. doi: 10.1242/dev.043810. [DOI] [PubMed] [Google Scholar]
- 45.Komaki S, et al. Nuclear-localized subtype of end-binding 1 protein regulates spindle organization in Arabidopsis. J Cell Sci. 2010;123(Pt 3):451–459. doi: 10.1242/jcs.062703. [DOI] [PubMed] [Google Scholar]
- 46.Zhang Y, Iakovidis M, Costa S. Control of patterns of symmetric cell division in the epidermal and cortical tissues of the Arabidopsis root. Development. 2016;143(6):978–982. doi: 10.1242/dev.129502. [DOI] [PMC free article] [PubMed] [Google Scholar]
- 47.Spinner L, et al. A protein phosphatase 2A complex spatially controls plant cell division. Nat Commun. 2013;4:1863. doi: 10.1038/ncomms2831. [DOI] [PubMed] [Google Scholar]
- 48.Pietra S, et al. Arabidopsis SABRE and CLASP interact to stabilize cell division plane orientation and planar polarity. Nat Commun. 2013;4:2779. doi: 10.1038/ncomms3779. [DOI] [PMC free article] [PubMed] [Google Scholar]
- 49.Wu SZ, Ritchie JA, Pan AH, Quatrano RS, Bezanilla M. Myosin VIII regulates protonemal patterning and developmental timing in the moss Physcomitrella patens. Mol Plant. 2011;4(5):909–921. doi: 10.1093/mp/ssr068. [DOI] [PubMed] [Google Scholar]
- 50.Wu S-Z, Bezanilla M. Myosin VIII associates with microtubule ends and together with actin plays a role in guiding plant cell division. eLife. 2014;3:e03498. doi: 10.7554/eLife.03498. [DOI] [PMC free article] [PubMed] [Google Scholar]
- 51.Wadsworth P. Using cultured mammalian cells to study mitosis. Cold Spring Harb Protoc. 2012;2012(2):205–212. doi: 10.1101/pdb.ip067850. [DOI] [PubMed] [Google Scholar]
- 52.Gao S, et al. Development of a seed DNA-based genotyping system for marker-assisted selection in maize. Mol Breed. 2008;22(3):477–494. [Google Scholar]
- 53.Sambrook J, Russell DW. 2001. Molecular Cloning: A Laboratory Manual (Cold Spring Harbor Laboratory Press, Cold Spring Harbor, NY), 3rd Ed.
- 54.Mohanty A, Yang Y, Luo A, Sylvester AW, Jackson D. Methods for generation and analysis of fluorescent protein-tagged maize lines. Methods Mol Biol. 2009;526:71–89. doi: 10.1007/978-1-59745-494-0_6. [DOI] [PubMed] [Google Scholar]
- 55.Hellens R, Mullineaux P, Klee H. Technical Focus: A guide to Agrobacterium binary Ti vectors. Trends Plant Sci. 2000;5(10):446–451. doi: 10.1016/s1360-1385(00)01740-4. [DOI] [PubMed] [Google Scholar]
Associated Data
This section collects any data citations, data availability statements, or supplementary materials included in this article.


