Abstract
Purpose
To investigate the level of inaccuracy of retinal thickness measurements in tilted and axially stretched optical coherence tomography (OCT) images.
Methods
A consecutive series of 50 eyes of 50 patients with age-related macular degeneration were included in this study, and Cirrus HD-OCT images through the foveal center were used for the analysis. The foveal thickness was measured in three ways: (1) parallel to the orientation of the A-scan (Tx), (2) perpendicular to the retinal pigment epithelium (RPE) surface in the instrument-displayed aspect ratio image (Ty), and (3) thickness measured perpendicular to the RPE surface in a native aspect ratio image (Tz). Mathematical modeling was performed to estimate the measurement error.
Results
The measurement error was larger in tilted images with a greater angle of tilt. In the simulation, with axial stretching by a factor of 2, Ty/Tz ratio was > 1.05 at a tilt angle between 13° to 18° and 72° to 77°, > 1.10 at a tilt angle between 19° to 31° and 59° to 71°, and > 1.20 at an angle ranging from 32° to 58°. Of note with even more axial stretching, the Ty/Tz ratio is even larger. Tx/Tz ratio was smaller than the Ty/Tz ratio at angles ranging from 0° to 54°. The actual patient data showed good agreement with the simulation.
The Ty/Tz ratio was greater than 1.05 (5% error) at angles ranging from 13° to 18° and 72° to 77°, greater than 1.10 (10% error) angles ranging from 19° to 31° and 59° to 71°, and greater than 1.20 (20% error) angles ranging from 32° to 58° in the images axially stretched by a factor of 2 (b/a = 2), which is typical of most OCT instrument displays.
Conclusions
Retinal thickness measurements obtained perpendicular to the RPE surface were overestimated when using tilted and axially stretched OCT images.
Translational Relevance
If accurate measurements are to be obtained, images with a native aspect ratio similar to microscopy must be used.
Keywords: optical coherence tomography, retinal thickness, retina
Introduction
Optical coherence tomography (OCT) had become an integral tool and dominant imaging technology in ophthalmology.1–3 OCT not only provides unparalleled histology-like three-dimensional structural information, but an opportunity for objective quantification of data such as total retinal, subretinal, or choroidal layer thicknesses. This data can aid in precisely assessing disease severity and response to therapy.4–9
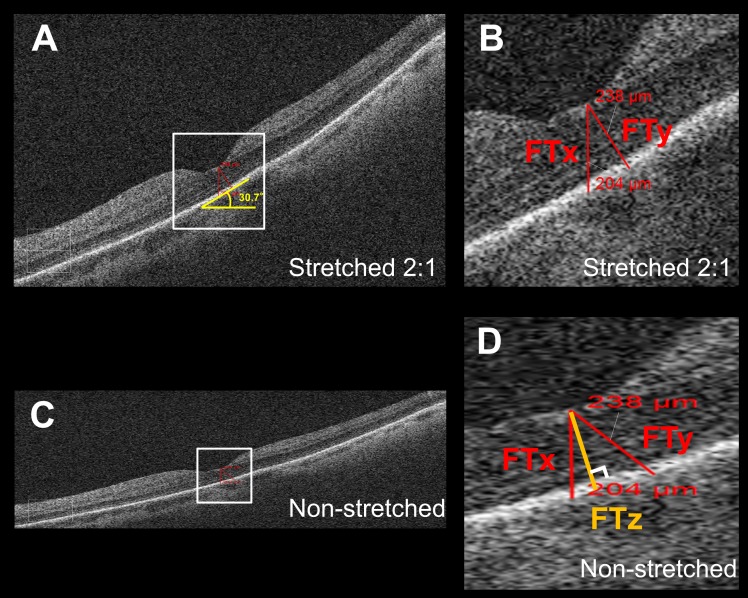
With the use of quantitative OCT data as key measures in large therapeutic trials, considerable attention has been paid to factors that can affect the accuracy of these measurements. For example, it is known that measurements can be confounded by image quality,10 segmentation errors,11–13 decentration,14 scan tilt,15 as well as characteristics of the ocular optical system such as corneal curvature, axial length, and lens status.16–21 Traditionally, OCT images which have a higher axial resolution than transverse resolution in nature, have been displayed in an axially stretched manner (high vertical versus horizontal aspect ratio). For example, in most conventional spectral-domain (SD) OCT displays, the image is stretched at least twofold axially compared to its actual dimensions in the retina. Although this stretching creates a more pleasing image that allows the various retinal layers to be distinguished more easily, thickness measurements perpendicular to the plane of the retina will be overestimated unless the stretching is taken into account (Fig. 1). This is relatively easy to correct for when the normal to the retina is vertical, and is done so automatically by the OCT instruments. If the retina is tilted in the image due to the curvature of the eye (e.g., myopic eyes) or off-axis scan acquisition, caliper lines perpendicular to the retina will no longer be vertical on the image. This can also potentially be accounted for by instrument software. However, a line that is drawn perpendicular to the retina on an axially stretched image will in fact not actually be perpendicular if the image is then adjusted back to the native aspect ratio (i.e., the actual dimensions of the retina in the eye). This is not accounted for the instrument or the human grader unless the measurement is performed on an unstretched image (Fig. 1).
Figure 1.
Thickness measurement error in tilted and stretched OCT image. (A) OCT B-scan image through the fovea as displayed by the Cirrus HD-OCT review software. The image is axially stretched by a factor of 2 compared to its true anatomic aspect ratio. (B) Magnified view of the area outlined in (A). The foveal thickness measured parallel to A-scan (FTx) using the instrument caliper tool was 204 μm and shorter than the thickness of 238 μm as measured perpendicular to RPE (FTy), although on visual inspection, FTx seemed longer than FTy in the displayed image. (C) The same B-scan as (A) converted into an anatomically correct aspect ratio by stretching the image horizontally by a factor of 2. The tilt of the OCT image was milder than (A). (D) Magnified view of the area outlined in (C). Note that FTy (238 μm) was no longer perpendicular to the RPE. FTx was still parallel to the A-scan. FTz is the retinal thickness measured perpendicular to RPE in the anatomically correct image and is considered to be the true thickness value, which is not influenced by image rotation.
This concern regarding the impact of image stretching was recently raised for the first time by Sigal and associates.22 Their report, however, focused on the impact of stretching on morphological analysis of the optic nerve head, but did not study the impact on retinal thickness measurements in the macula or the impact of scan rotation/tilt on the measurement error. Given the pervasive use of retinal thickness measurements and length-based measurements of various structures on OCT in clinical trials and clinical practice, assessing the magnitude of error introduced by this stretching factor would appear to be of paramount importance.
Thus, in the present study, we estimated the measurement error introduced by the use of stretched OCT images and its association with image rotation angle, and compared the estimated error with actual patient data.
Methods
This study is a retrospective, consecutive, observational case series. The research adhered to the tenets set forth in the Declaration of Helsinki, and the project was approved by the Institutional Review Board of the David Geffen School of Medicine at the University of California in Los Angeles. The estimation of the measurement error was performed by using a mathematical model that was then confirmed using manual measurements obtained from actual patient data.
Estimation of the Retinal Thickness Measurement Error Using a Mathematical Model
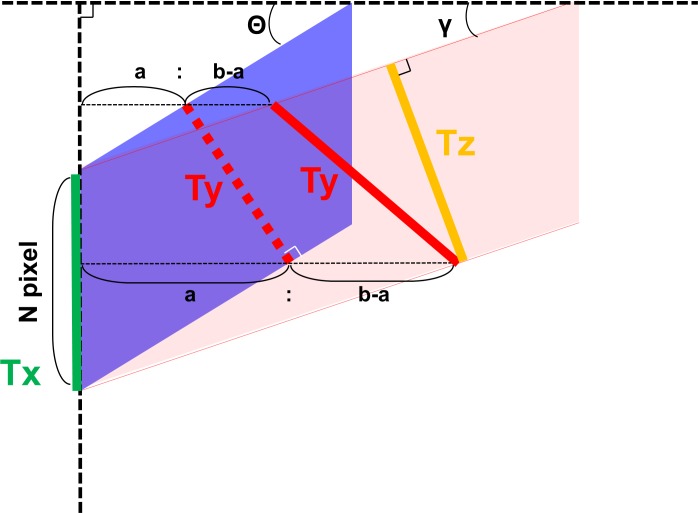
Thickness measurement error occurs in tilted and stretched OCT images, when measurements are performed by drawing a perpendicular line to the plane of the retinal pigment epithelium (RPE). Although lines drawn parallel to the A-scan would not be affected by scan tilt, these measurements would be larger than the true retinal thickness as the line would traverse a longer (“tangential”) path from the inner retinal surface to the RPE.15,23 Based on our assumptions, the true retinal thickness or reference standard would be derived from a line drawn perpendicular to the RPE in an anatomically correct image (aspect ratio that reflects the true microscopic dimensions of the retina). Figure 2 illustrates what occurs when a axially stretched OCT image (on which a line perpendicular to the RPE surface has been drawn: Ty) is compressed back to its native aspect ratio. Note that the Ty line is no longer perpendicular to the RPE. Thickness measurement lines are also shown drawn parallel to the A-scan orientation (Tx) and perpendicular to the RPE surface (Tz) on the anatomically correct image. Based on this model, based on geometry, the three parameters are calculated as follows:
 |
 |
 |
where a, b, N, θ, and γ are the axial resolution (μm/pixel), transversal resolution (μm/pixel), thickness measured parallel to A-scan at the fovea (pixel), image rotation angle against the horizontal in the stretched image, and image rotation angle against the horizontal in the anatomically correct image, respectively. Because the purpose of this study was to investigate the magnitude of the measurement error (overestimation) relative to the “true” thickness value (Tz), the ratio of Tx and Ty to Tz were calculated as follows:
 |
 |
where a, b, and θ are the axial resolution (μm/pixel), transversal resolution (μm/pixel), and image rotation angle against the horizontal in the stretched image, respectively. The relationships between Tx/Tz, Ty/Tz, degree of stretching (b/a), and rotation angle were analyzed.
Figure 2.
Estimation of the retinal thickness measurement error using a mathematical model. A blue parallelogram represents a tilted and stretched OCT image and a red parallelogram represents a converted anatomically correct OCT image derived from the blue object, where a, b, N, θ, and γ are the axial resolution (μm/pixel), transverse resolution (μm/pixel), thickness measured parallel to A-scan at the fovea (pixel), image rotation angle against the horizontal in the stretched image, and image rotation angle against the horizontal in the anatomically correct image, respectively. The top and bottom line of each parallelogram represent the ILM and RPE. Tx, Ty, and Tz represent thickness measured parallel to A-scan, thickness measured perpendicular to RPE in the original stretched image, and thickness measured perpendicular to the RPE in the nonstretched/anatomically correct image. Dashed line of Ty is perpendicular to the RPE of the blue parallelogram, whereas the solid line of Ty is the converted line derived from the dashed line and is no longer perpendicular to the RPE of red parallelogram. Tx, Ty, and Tz can be geometrically calculated as follows: Tx = aN, Ty = Ncosθ
 , and Tz = aN cosγ
 .
.
Estimation of the Retinal Thickness Measurement Error Using Human OCT Data Subjects
For manual retinal thickness measurement, we retrospectively reviewed the OCT data of 50 consecutive patients (50 eyes, one eye selected for each patient) with age-related macular degeneration (AMD) seen the Retina-Vitreous Associates Medical Group (Los Angeles, CA). There was no specific reason to choose a cohort with AMD aside from the fact that the cohort was readily available and focused on a disease for which thickness measurements of various structures are commonly obtained in the context of clinical trials. To be included in this series, volume OCT data from a single device (Cirrus HD-OCT; Carl Zeiss Meditec, Inc., Dublin, CA) had to be available. In addition, eyes in which the surface of the RPE/Bruch's membrane complex could not be clearly identified due to large irregular pigment epithelial detachments (PEDs), subretinal hyperreflective material (SHRM), or extensive intraretinal hyperreflective features were excluded from the study.
OCT Analysis
All OCT grading was performed by a certified Doheny Image Reading Center (DIRC) OCT grader (AU). For these analyses, the macular cube scan (512 × 128 axial scans with a scan length of 6 × 6 mm and a 2-mm axial depth) was selected for each eye. The central fovea was defined as the location without evidence of the inner retinal layers in the macular region, and the single B-scan image thought to pass through the foveal center was selected for retinal thickness measurement.
The foveal thickness was defined as the distance between the inner surface of the internal limiting membrane (ILM) to the outer surface of the RPE/Bruch's complex at the foveal center. This foveal thickness was measured in three ways: (1) parallel to the orientation of the A-scan (FTx) regardless of retinal tilt, (2) perpendicular to the RPE in the axially stretched image (FTy) as normally presented by the OCT display, and (3) perpendicular to the RPE in the nonstretched/anatomically correct image (FTz, obtained using third party software described below; Fig. 1). In images with a PED, Bruch's membrane was used as the outer most boundary for thickness measurements instead of the RPE, as it was easier to consistently draw a perpendicular line to this surface. First, FTx and FTy were measured using Cirrus HD-OCT review software. For both FTx and FTy, the same point (at the foveal center) on the inner surface of the ILM was selected as one end of the caliper. For FTx, the other end of the caliper was set at the point of intersection between the outer surface of the RPE/Bruch's complex and a line parallel to the orientation of the A-scan drawn down from foveal center point on the ILM. For FTy, the other end of the caliper was set at the point of intersection between the outer surface of the RPE/Bruch's complex and a line drawn down from the foveal center point but perpendicular to the RPE band. Note that images displayed in the software are axially stretched (horizontally compressed) by a factor of 2. After measurement in the review software, images were exported at a resolution of 1525 × 1016 pixels and imported to ImageJ (Wayne Rasband, National Institutes of Health, Bethesda, MD; available at http://rsb.info.nih.gov/ij/index.html). Image rotation angle, which was defined as the angle of the outer RPE boundary line or Bruch's membrane at the fovea versus the image horizontal, was measured (Fig. 1A). Subsequently, images were converted into anatomically correct (true aspect ratio of tissue) images by stretching them horizontally by a factor of 2, and the FTz was then measured by using the calibrated caliper tool of ImageJ. For the FTz measurement, the same foveal center point on the inner surface of the ILM as for FTx and FTy was set as one end of the caliper. The other end was set at the point of intersection between the outer surface of the RPE/Bruch's complex and a line drawn down from the foveal center point but perpendicular to the RPE band. In other words, FTz was drawn similar to FTy, except performed on the true aspect ratio image. Note that after adjusting the image to the true aspect ratio, the FTx line that was perpendicular to the RPE in the stretched (as displayed by the instrument) was no longer perpendicular in these rotated images. Thus, we considered the FTz to be the reference or true thickness value as its measurement should not be influenced by image rotation, and thus the FTx/FTz ratio and the FTy/FTz ratio were calculated to analyze the magnitude of the overestimated measurements against the true thickness value.
Statistical Analysis
All values are expressed as the mean ± standard deviation. Comparisons of FTx, FTy, and FTz were carried out using repeated measures analysis of variance, and differences between the two groups were analyzed using the paired t-test followed by Bonferroni correction. Comparison of FTx/FTz and FTy/FTz was carried out using the paired t-test. A P value < 0.05 was considered statistically significant. All analyses were performed using StatView (Version 5.0; SAS Institute, Cary, NC).
Results
Simulated Relationships between Measurement Errors, Stretching, and Rotation
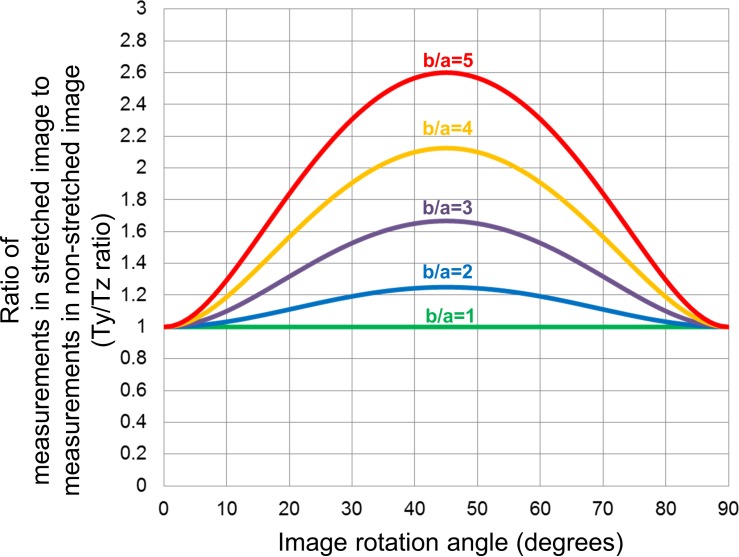
Figure 3 shows the relationships between the Ty/Tz ratio and image rotation angle, which has been calculated using Formula (5) described in the Methods. The relationships could be depicted as curves similar to a Gaussian distribution, with greater rotation angles (ranging from 0° to 45°) being associated with higher Ty/Tz ratios. The Ty/Tz ratio was greater than 1.05 (5% error) at angles ranging from 13° to 18° and 72° to 77°, greater than 1.10 (10% error) angles ranging from 19° to 31° and 59° to 71°, and greater than 1.20 (20% error) angles ranging from 32° to 58° in the images axially stretched by a factor of 2 (b/a = 2), which is typical of most OCT instrument displays. Of note, even greater distortion/stretching (higher b/a) showed even higher Ty/Tz ratios. For example, at an angle of 20°, when images are stretched by a factor of 2 (b/a = 2) the Ty/Tz ratio will be approximately 1.11, compared to 1.80 when images are stretched axially by a factor of 5. It should be noted that the Ty/Tz ratio is 1.00 at an angle of 0° (i.e., no scan tilt) regardless of the amount of stretching, and is 1.00 at any angle if the image is assessed at the true anatomic aspect ratio (b/a = 1).
Figure 3.
Simulated relationship between measurement errors, stretching and image rotation in OCT images when thickness was measured perpendicular to the RPE. The graph was generated from Formula (5). The curves similar to a Gaussian distribution showed relationships between the Ty/Tz ratio and image rotation angle, where Ty and Tz were thickness measured perpendicular to RPE in the original stretched image and thickness measured perpendicular to the RPE in the anatomically correct image, respectively. Each colored line presents different severity of image stretching (b/a), where “a” is the axial resolution (μm/pixel) and “b” is the transverse resolution (μm/pixel). Ty/Tz ratio was larger in tilted images with greater angles and more severe stretching (higher b/a) at the rotation angle ranging from 0 to 45°. Note that Ty/Tz ratio is 1.00 at an angle of 0°, regardless of the severity of stretching, and is also 1.00 at any angle in an anatomically correct image (b/a = 1).
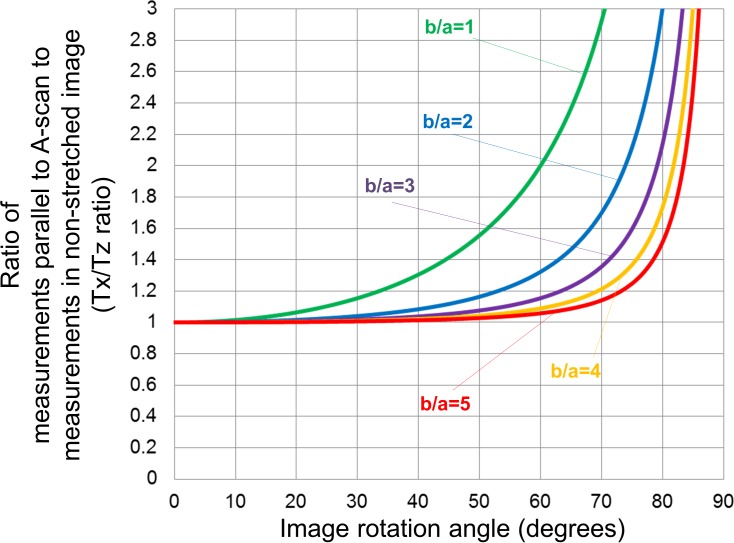
Figure 4 shows the relationship between Tx/Tz ratio calculated from Formula (4) in the Methods and image rotation angle. The morphology of these curves resembled an exponential function, and the Tx/Tz ratio increased as the angle increased. Greater amounts of stretching (higher b/a) showed a lower Tx/Tz ratio, and the value remained less than 1.05 at angles ranging from 0° to 32°, regardless of the level of stretching. Interestingly, Tx/Tz ratio was smaller than the Ty/Tz at rotation angles ranging from 0° to 54°.
Figure 4.
Simulated relationship between measurement errors, stretching and image rotation when thickness was measured parallel to A-scan. The graph was generated from Formula (4). The graph shows the relationships between Tx/Tz ratio and image rotation angle, where Tx and Tz were thickness measured parallel to the A-scan and thickness measured perpendicular to the RPE in the anatomically correct image, respectively. Each colored line presents different severity of image stretching (b/a), where “a” is axial resolution (μm/pixel) and “b” is transverse resolution (μm/pixel). Tx/Tz ratio increased as the angle increased. More severe axial stretching (higher b/a) showed a lower Tx/Tz ratio.
Relationships between Measurement Errors and Rotation in OCT Images in Eyes with AMD
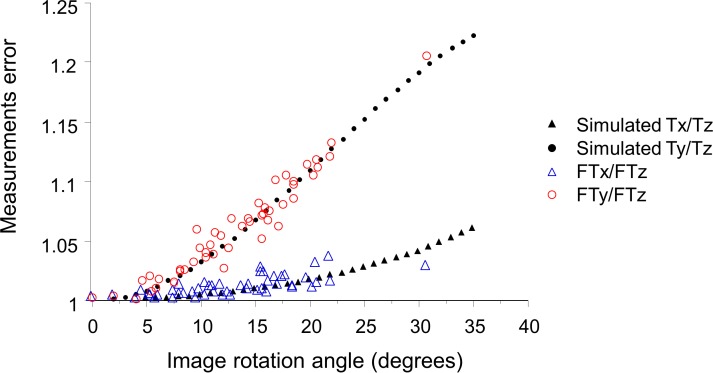
To confirm the predictions from the mathematical models, actual thickness measurements were obtained from a cohort of eyes with nonneovascular AMD. Table 1 summarizes the characteristics of patients and measurement results from the OCT images. The average rotation angle was 12.8° ± 6.3°, and six eyes (12%) had OCT images with greater than 20° of tilt relative to the horizontal. FTx and FTy were significantly larger than FTz (both P < 0.0001), and FTy was significantly larger than FTx (P < 0.0001). Moreover, the FTy/FTz ratio was 1.06 ± 0.05, and was larger than FTx/FTz ratio of 1.01 ± 0.01 (P < 0.0001). Relationships between measurement errors and rotation angle are shown in Figure 5. The actual measurement values plotted in red (FTy/FTz ratio) and blue (FTx/FTz ratio) clearly overlapped with the values from simulations based on our mathematical model when using the same aspect ratio (axial stretching by a factor of 2; b/a = 2) as the Cirrus HD-OCT review software. Both FTx/FTz and FTy/FTz ratios increased as the angle increased; however, the increase in FTx/FTz was more gradual than in FTy/FTz, and all values of FTx/FTz were below 1.05 (5% error). Meanwhile, FTy/FTz ranged from 1.00 to 1.21, and the maximum value of 1.21 was observed at an angle of 30.7°.
Table 1.
Characteristics of the Eyes
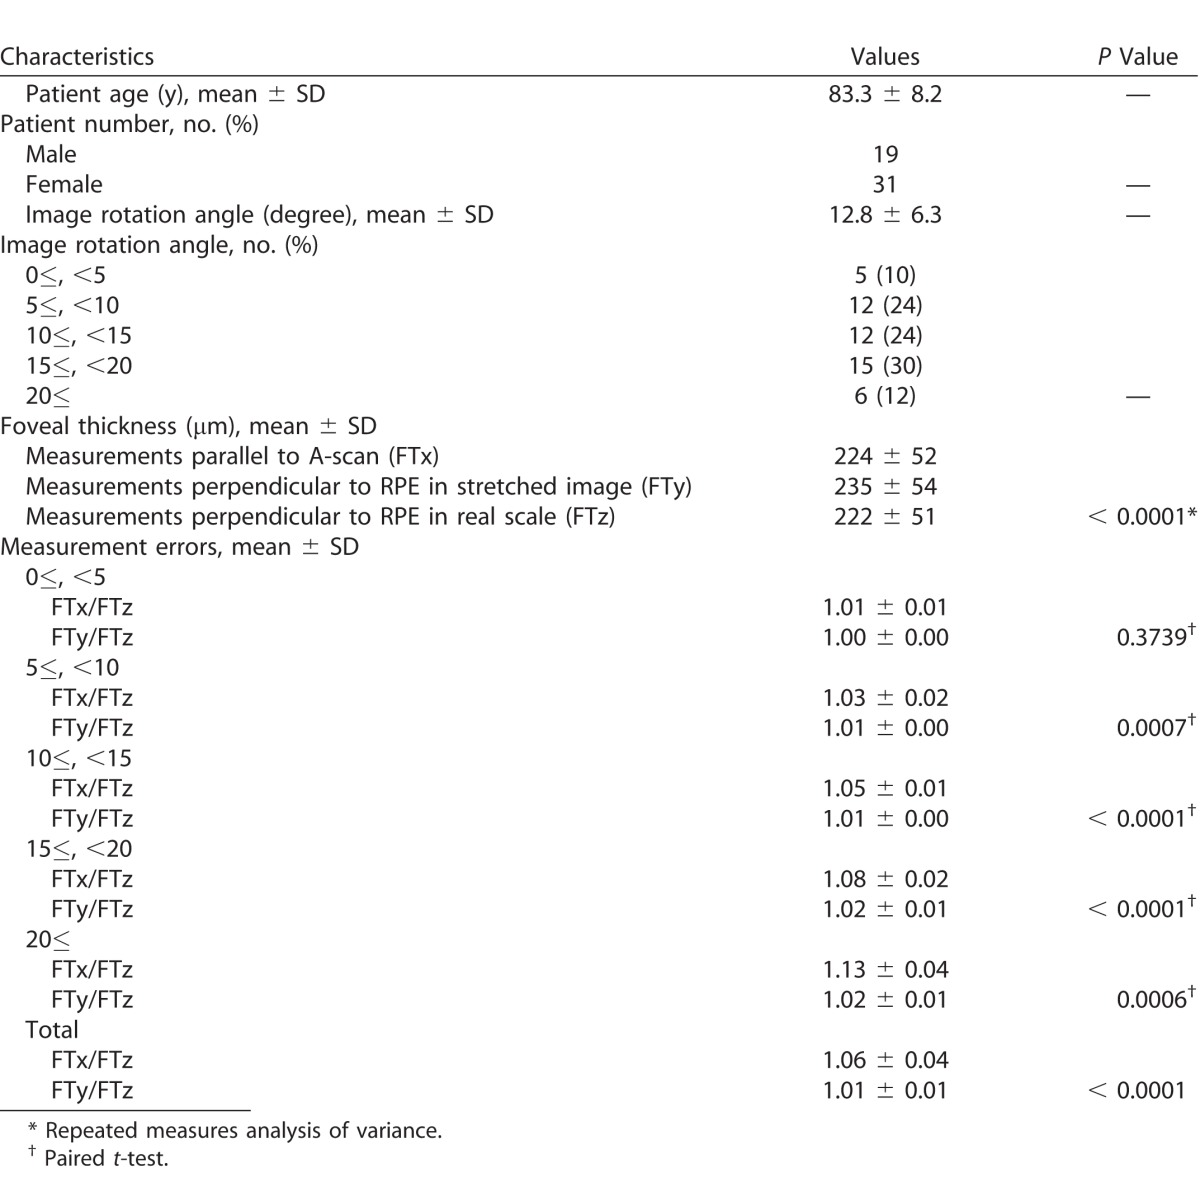
Figure 5.
Relationships between measurement errors and rotation in OCT images in eyes with nonneovascular AMD. The foveal thickness was measured in three ways; foveal thickness measured parallel to the A-scan (FTx), thickness measured perpendicular to RPE in the original stretched image (FTy), and thickness measured perpendicular to the RPE in the nonstretched/anatomically correct image (FTz). Both FTx/FTz and FTy/FTz showed an increase as the angle increased. The increase was more gradual in FTx/FTz than in FTy/FTz. The actual measurement values showed good agreement with the mathematical model imitating the same image stretching (b/a = 2) as the Cirrus HD-OCT review software.
Discussion
In this study, we evaluated the impact of B-scan image rotation on retinal thickness measurements obtained from images assessed by using the instrument-displayed aspect ratio as opposed to the true tissue aspect ratio. Our simulations based on mathematical modeling predicted that retinal thickness, even when measured perpendicular to the RPE on rotated images, overestimated the true retinal thickness. The results of this mathematical model were confirmed by actual patient image data. The reason for this discrepancy is because the line drawn perpendicular to RPE in the instrument-display axially stretched image is not perpendicular to RPE when the aspect ratio is converted to a nonstretched, true anatomic depiction. In addition, we simulated and confirmed that the magnitude of this error was larger in tilted images with a greater angle and more severe stretching. Of note, thickness measured perpendicular to the RPE, which is typically what would be done by human graders at reading centers or in clinical practice, was greater than the thickness measured parallel to A-scan in stretched, rotated images. This finding would contradict the widespread belief among researchers or reading centers that thickness measured perpendicular to RPE in tilted scans is closer to the true thickness value than measurements obtained by a purely vertical line parallel to the A-scan. This is, of course, only the case when using stretched images (not the true anatomic aspect ratio), but all commercial instruments typically display images that are axially stretched as they produce more visually pleasing images with greater separation between layers.
It should be noted that the amount of stretching and the magnitude of the resultant measurement error will differ from OCT system to system. For example, the Cirrus HD-OCT displays twofold axially stretched images (b/a = 2), whereas the Spectralis (Heidelberg Engineering, Heidelberg, Germany) displays a threefold stretched image (b/a = 3) by default in high-speed mode. Of note, the Spectralis does offer an option (by selecting the “1:1 μm” icon) to display the images in real scale, but this seems to be rarely used by researchers as the problem discussed in this report is not widely known. According to the results shown in Figure 3 with images featuring a tilt of 30°, measurements perpendicular to the RPE will be 20% greater than the true thickness value in the Cirrus HD-OCT, while it will be more than 50% greater with the Spectralis. This problem can be further exacerbated when images are exported out of OCT systems for annotation, if appropriate precautions are not taken. For example, many OCT systems will have a large difference between axial and transverse resolution, and may demonstrate even greater stretching when images are exported in original resolution. The DRI OCT-1 Atlantis (Topcon, Tokyo, Japan) has the relatively high axial digital resolution of 2.6 μm/pixel (though with an optical resolution of 8 μm) and a digital transverse resolution of 12 μm/pixel. This translates to b/a ratio of 4.6, meaning that measurements perpendicular to RPE will be more than 100% greater than the true thickness value at a scan tilt of 30°, if measurements are obtained on images scaled at the original resolution. The HS100 (Canon, Inc., Tokyo, Japan), which has an extended-bandwidth, superluminescent diode light source with a full-width at half-maximum (FWHM) value of 100 nm and delivers a 3-μm optical axial resolution, shows a 10-mm wide B-scan image axially stretched by a factor of 5.74. Measurements perpendicular to RPE will be 100% greater in scans tilted 20°, and 150% greater than the true thickness in scans tilted 30°.
The clinical implications of our findings are that OCT images should be converted to a nonstretched format (true anatomic aspect ratio) in the instrument review software prior to measuring the retinal or choroidal thickness in tilted scans. However, unfortunately, some OCT review software cannot display the images in an anatomically correct manner. In this case, image conversion to the anatomic aspect ratio in third party review software may be necessary in order to avoid the overestimation of the thickness measurement. Advances in imaging technology such as adaptive optics OCT may allow acquisition of OCT data at an isotropic resolution, in which case images will be automatically displayed at anatomically correct aspect ratio and reduce the chance of scan-tilt related measurement errors.
Another potential solution to this problem is to obtain nontilted (horizontally flat) OCT scans. A tilting of the OCT image can be due to many factors, however, not all of which can be mitigated. One important cause is eccentric positioning of the OCT scanning beam in the pupil relative to the visual axis, which can be caused by poor patient fixation or operator factor. We previously demonstrated that the inclination with greatest angle of 14.52° ± 2.63° was observed with 3-mm intentional temporal displacement of the scanning beam from the center of the pupil of healthy subjects using Cirrus HD-OCT system.15 Interestingly, the tilt angles observed in our retrospective AMD cohort used in this study were similar to the prior study, suggesting that off-axis fundus scanning is not uncommon in clinical practice. For clinical trials, reading center-recommended image acquisition protocols do in fact advise photographers to attempt to obtain images through the center of the pupil and avoid obtaining tilted scans. Unfortunately, this is simply difficult to obtain consistently in poorly fixating or poorly cooperative patients.
Unfortunately, there are other reasons for scan tilt that cannot be eliminated by improvement in acquisition techniques. For example, in eyes with significant posterior segment ectasia, such as staphyloma in the setting of myopia, the OCT image can be dramatically curved and the fovea cannot always be positioned in a horizontal orientation.24,25 Thus, even though retinal and choroidal thicknesses may be reported to be decreased in these highly myopic eyes, they may actually still be overestimates compared to the true retinal thickness. In addition, in many studies, thickness measurements are often obtained in more eccentric locations of the retina. This is of particular interest with the availability of “wide-field” OCT and large angle B-scans (12 mm or greater).26–28 Given the curvature and effective “tilting” relative to horizontal of the more peripheral regions of these scans, the importance of obtaining thickness measurements at the anatomic aspect ratio would be of paramount importance.
Our study has several limitations to consider when assessing our results. First, although we were able to run mathematical models to very high angles of tilt, the subjects in our real-world validation study were generally below 25°. Thus, we cannot confirm with certainty that our model is accurate at these very large angles. On the other hand, angles beyond this level may not be clinically relevant for foveal thickness measurements. In addition, for the validation of our mathematical model, we only used a single OCT device. Although the same findings would be expected with all instruments, this should be verified with each instrument software, as theoretically manufacturers could introduce mathematical correction to account for the effect of tilting. Finally, although we proposed the Tz or FTz measured perpendicular to the RPE on images with an anatomically correct aspect ratio as the ground truth or reference standard, the absolute ground truth would require that the scan not be tilted as well. This is because with a tilted scan, even the obtained B-scan slice through the retina would not be perpendicular to the retinal surface and as a result the retina will measure thicker. We demonstrated this in a prior publication.15 This would only mean, however, that the level of overestimation due to scan tilt and stretching is even greater than what we are reporting, and thus our overall observations and recommendations would remain unchanged.
In summary, we report that image aspect ratio and scan tilt can have significant impact on thickness measurements obtained on OCT images. Minimizing scan tilt and performing measurements on true anatomic aspect ratio images would appear to be of critical importance in order to obtain accurate values, particularly when comparing measurements over time. These findings have important implications for the design of acquisition and grading protocols for clinical trials and clinical research.
Acknowledgments
Disclosure: A. Uji, None; N.S. Abdelfattah, None; D.S. Boyer, Aerpio (C), Alcon (C, R), Allergan (C, R), Bayer (C), Genentech (C, R), GS (C), KalVista (C), Neurotech (C), Nicox (C), Novartis (C, R), Ohr (C), Santaris (C), Santen (C), ThromboGenics (C), Regeneron Pharmaceuticals, Inc. (C, R); S. Balasubramanian, None; J. Lei, None; S. R. Sadda, Carl Zeiss Meditec (F), Optos (F, C), Allergan (F, C), Genentech (C, F), Alcon (C); Novartis (C); Roche (C), Regeneron (C), Bayer (C), ThromboGenics (C), StemCells Inc (C), Avalanche (C)
References
- 1. Huang D,, Swanson EA,, Lin CP,, et al. Optical coherence tomography. Science. 1991. ; 254: 1178–1181. [DOI] [PMC free article] [PubMed] [Google Scholar]
- 2. Drexler W,, Morgner U,, Ghanta RK,, Kartner FX,, Schuman JS,, Fujimoto JG. Ultra high-resolution ophthalmic optical coherence tomography. Nat Med. 2001. ; 7: 502–507. [DOI] [PMC free article] [PubMed] [Google Scholar]
- 3. Hee MR,, Izatt JA,, Swanson EA,, et al. Optical coherence tomography of the human retina. Arch Ophthalmol. 1995. ; 113: 325–332. [DOI] [PubMed] [Google Scholar]
- 4. Hee MR,, Puliafito CA,, Wong C,, et al. Quantitative assessment of macular edema with optical coherence tomography. Arch Ophthalmol. 1995. ; 113: 1019–1029. [DOI] [PubMed] [Google Scholar]
- 5. Browning DJ,, Glassman AR,, Aiello LP,, et al. Relationship between optical coherence tomography-measured central retinal thickness and visual acuity in diabetic macular edema. Ophthalmology. 2007. ; 114: 525–536. [DOI] [PMC free article] [PubMed] [Google Scholar]
- 6. Horn FK,, Mardin CY,, Laemmer R,, et al. Correlation between local glaucomatous visual field defects and loss of nerve fiber layer thickness measured with polarimetry and spectral domain OCT. Invest Ophthalmol Vis Sci. 2009. ; 50: 1971–1977. [DOI] [PubMed] [Google Scholar]
- 7. Uji A,, Murakami T,, Unoki N,, et al. Parallelism as a novel marker for structural integrity of retinal layers in optical coherence tomographic images in eyes with epiretinal membrane. Am J Ophthalmol. 2014. ; 157: 227–236. [DOI] [PubMed] [Google Scholar]
- 8. Hirata M,, Tsujikawa A,, Matsumoto A,, et al. Macular choroidal thickness and volume in normal subjects measured by swept-source optical coherence tomography. Invest Ophthalmol Vis Sci. 2011. ; 52: 4971–4978. [DOI] [PubMed] [Google Scholar]
- 9. Abdelfattah NS,, Zhang H,, Boyer DS,, Sadda SR. Progression of macular atrophy in patients with neovascular age-related macular degeneration undergoing antivascular endothelial growth factor therapy. Retina. 2016; 36: 1843–1850. [DOI] [PubMed] [Google Scholar]
- 10. Huang J,, Liu X,, Wu Z,, Sadda S. Image quality affects macular and retinal nerve fiber layer thickness measurements on Fourier-domain optical coherence tomography. Ophthalmic Surg Lasers Imaging. 2011. ; 42: 216–221. [DOI] [PubMed] [Google Scholar]
- 11. Hu Z,, Wu X,, Hariri A,, Sadda SR. Multiple layer segmentation and analysis in three-dimensional spectral-domain optical coherence tomography volume scans. J Biomed Opt. 2013. ; 18: 76006. [DOI] [PubMed] [Google Scholar]
- 12. Huang J,, Liu X,, Wu Z,, Cao D,, Sadda S. Intraretinal segmentation on Fourier domain optical coherence tomography. Ann Acad Med Singapore. 2010. ; 39: 518–517. [PubMed] [Google Scholar]
- 13. Nittala MG,, Ruiz-Garcia H,, Sadda SR. Accuracy and reproducibility of automated drusen segmentation in eyes with non-neovascular age-related macular degeneration. Invest Ophthalmol Vis Sci. 2012. ; 53: 8319–8324. [DOI] [PubMed] [Google Scholar]
- 14. Pak JW,, Narkar A,, Gangaputra S,, et al. Effect of optical coherence tomography scan decentration on macular center subfield thickness measurements. Invest Ophthalmol Vis Sci. 2013. ; 54: 4512–4518. [DOI] [PMC free article] [PubMed] [Google Scholar]
- 15. Hariri A,, Lee SY,, Ruiz-Garcia H,, Nittala MG,, Heussen FM,, Sadda SR. Effect of angle of incidence on macular thickness and volume measurements obtained by spectral-domain optical coherence tomography. Invest Ophthalmol Vis Sci. 2012. ; 53: 5287–5291. [DOI] [PubMed] [Google Scholar]
- 16. Leung CK,, Cheng AC,, Chong KK,, et al. Optic disc measurements in myopia with optical coherence tomography and confocal scanning laser ophthalmoscopy. Invest Ophthalmol Vis Sci. 2007. ; 48: 3178–3183. [DOI] [PubMed] [Google Scholar]
- 17. Savini G,, Barboni P,, Parisi V,, Carbonelli M. The influence of axial length on retinal nerve fibre layer thickness and optic-disc size measurements by spectral-domain OCT. Br J Ophthalmol. 2012. ; 96: 57–61. [DOI] [PubMed] [Google Scholar]
- 18. Lee K,, Sonka M,, Kwon YH,, Garvin MK,, Abramoff MD. Adjustment of the retinal angle in SD-OCT of glaucomatous eyes provides better intervisit reproducibility of peripapillary RNFL thickness. Invest Ophthalmol Vis Sci. 2013. ; 54: 4808–4812. [DOI] [PMC free article] [PubMed] [Google Scholar]
- 19. Rock T,, Bartz-Schmidt KU,, Bramkamp M,, Rock D. Influence of axial length on thickness measurements using spectral-domain optical coherence tomography. Invest Ophthalmol Vis Sci. 2014. ; 55: 7494–7498. [DOI] [PubMed] [Google Scholar]
- 20. Uji A,, Murakami T,, Muraoka Y,, et al. Potential measurement errors due to image enlargement in optical coherence tomography imaging. PLoS One. 2015. ; 10: e0128512. [DOI] [PMC free article] [PubMed] [Google Scholar]
- 21. Kim NR,, Lee H,, Lee ES,, et al. Influence of cataract on time domain and spectral domain optical coherence tomography retinal nerve fiber layer measurements. J Glaucoma. 2012. ; 21: 116–122. [DOI] [PubMed] [Google Scholar]
- 22. Sigal IA,, Schuman JS,, Ishikawa H,, Kagemann L,, Wollstein GA. Problem of proportions in OCT-based morphometry and a proposed solution. Invest Ophthalmol Vis Sci. 2016. ; 57: 484–485. [DOI] [PMC free article] [PubMed] [Google Scholar]
- 23. Alonso-Caneiro D,, Read SA,, Vincent SJ,, Collins MJ,, Wojtkowski M. Tissue thickness calculation in ocular optical coherence tomography. Biomed Opt Express. 2016. ; 7: 629–645. [DOI] [PMC free article] [PubMed] [Google Scholar]
- 24. Moriyama M,, Ohno-Matsui K,, Hayashi K,, et al. Topographic analyses of shape of eyes with pathologic myopia by high-resolution three-dimensional magnetic resonance imaging. Ophthalmology. 2011. ; 118: 1626–1637. [DOI] [PubMed] [Google Scholar]
- 25. Ohno-Matsui K,, Akiba M,, Modegi T,, et al. Association between shape of sclera and myopic retinochoroidal lesions in patients with pathologic myopia. Invest Ophthalmol Vis Sci. 2012. ; 53: 6046–6061. [DOI] [PubMed] [Google Scholar]
- 26. Uji A,, Yoshimura N. Application of extended field imaging to optical coherence tomography. Ophthalmology. 2015. ; 122: 1272–1274. [DOI] [PubMed] [Google Scholar]
- 27. Reznicek L,, Klein T,, Wieser W,, et al. Megahertz ultra-wide-field swept-source retina optical coherence tomography compared to current existing imaging devices. Graefes Arch Clin Exp Ophthalmol. 2014. ; 252: 1009–1016. [DOI] [PubMed] [Google Scholar]
- 28. Klein T,, Wieser W,, Eigenwillig CM,, Biedermann BR,, Huber R. Megahertz OCT for ultrawide-field retinal imaging with a 1050 nm Fourier domain mode-locked laser. Opt Express. 2011. ; 19: 3044–3062. [DOI] [PubMed] [Google Scholar]


