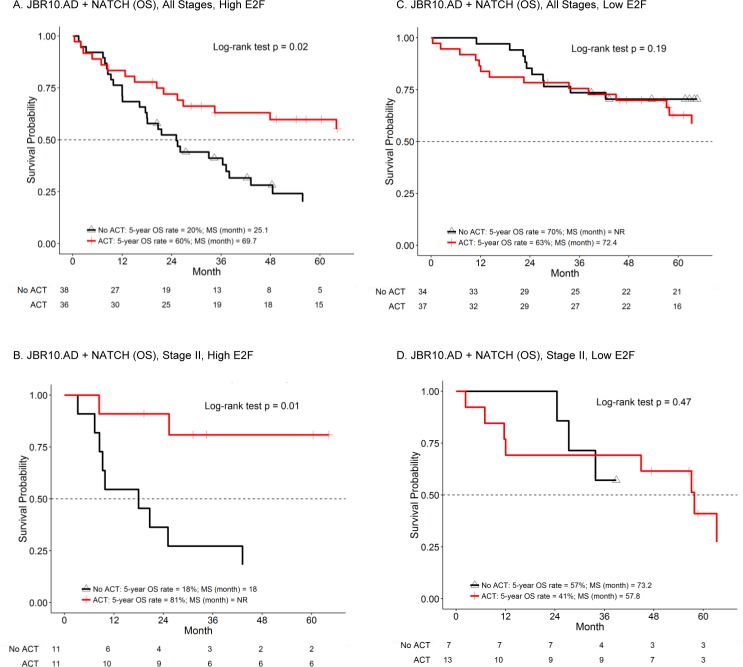
Figure 3. The E2F score predicts benefit of ACT in two randomized clinical trials.
K-M analysis of OS in the indicated combined cohorts was performed comparing patients with high E2F A. and B. with ACT (red line) or without ACT (black line) or low E2F C. and D. with ACT (red line) or without ACT (black line). Results for 5-year survival and the log-rank test p value are included in each panel. Numbers at the bottom of the graph indicate the number of patients in each group at risk at 12-month intervals. MS represents median survival time and NR means the MS was never reached. Graphs are truncated at 60 months. A and C represent patients of all stages. B and D represent stage II patients only.

