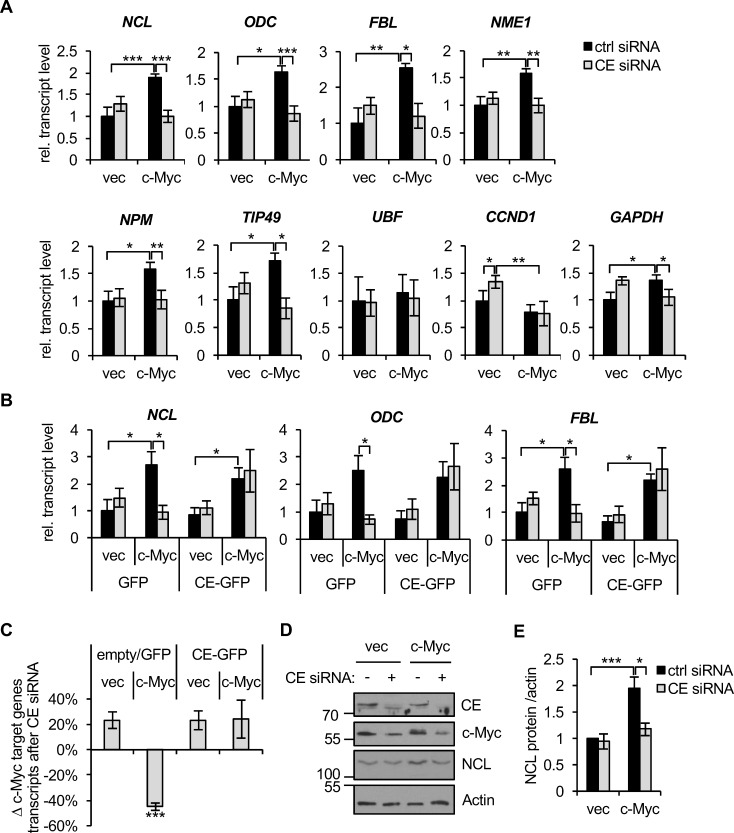
Figure 4. c-Myc-induced gene expression is CE-dependent.
(A) IMEC/vec and IMEC/c-Myc were transfected with CE siRNA or non-targeting control for 72hrs. c-Myc target gene transcripts were analysed by RT-qPCR, performed with equivalent amounts of RNA. Error bars represent standard error of the mean, n≥3. (B) IMEC/vec and IMEC/c-Myc expressing either GFP or CE-GFP (resistant to CE siRNA) were transfected with CE siRNA or control and transcripts analysed by RT-qPCR. Error bars represent standard error of the mean, n=4. (C) Average change in expression of c-Myc target genes (NCL, ODC, FBL, NME1, NPM and TIP49) upon CE depletion relative to control transfections. Error bars represent standard error of the mean, n=6. (D) IMEC/vec and IMEC/c-Myc were transfected with CE siRNA or non-targeting control for 72hrs. Protein analysed by Western blotting. (E) Densitometry performed to quantify the nucleolin (NCL) Western blot signal (normalised to actin) following CE depletion in IMEC/vec and IMEC/c-Myc. Error bars represent standard error of the mean, n≥3. Significance calculated by Student's T-test, *** = p≤0.001; ** = p≤0.01; * = p≤0.05.

