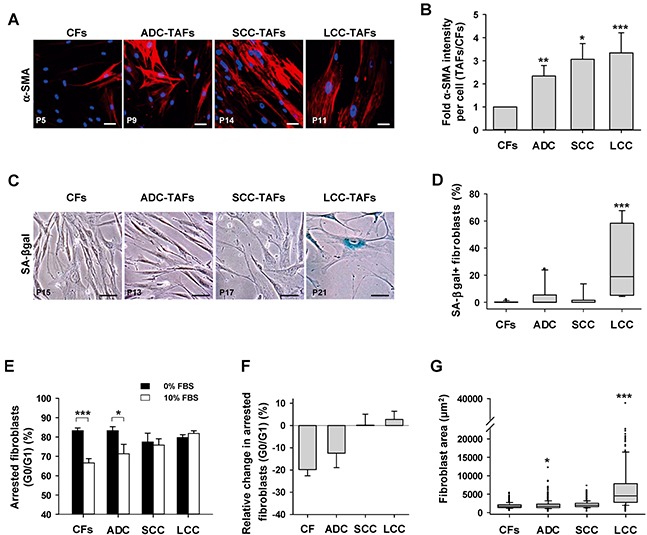
Figure 1. Analysis of myofibroblast and senescence markers in primary lung fibroblasts from major NSCLC subtypes (ADC, SCC and LCC).

A. Representative fluorescence images of α-SMA stainings of cultured CFs and TAFs from a randomly selected patient of each histologic subtype. Patient number is indicated in the bottom-left of each image. Scale bar here and thereafter, 50 μm. B. Average fold α-SMA fluorescence intensity per cell of TAFs with respect to paired CFs for each subtype (6 ADC, 8 SCC, 3 LCC). Data shown as mean ± SE. C. Representative phase contrast images of SA-βgal stainings of cultured CFs and TAFs from a randomly selected patient of each histologic subtype. SA-βgal+ fibroblasts appear in blue. More images are shown in Supplementary Figure S1. D. Box-plot of the percentage of SA-βgal+ fibroblasts in CFs and TAFs for each subtype from two independent collections (10 ADC, 8 SCC, 4 LCC). E. Average percentage of growth arrested fibroblasts (G0/G1 of the cell cycle) in CFs and TAFs for each subtype (4 ADC, 4 SCC, 3 LCC) cultured with 0% and 10% FBS. F. Average relative change in arrested fibroblasts at 10% versus 0% FBS computed from the data in G. All pair-wise comparisons were performed with respect to CFs except in (E). Mann–Whitney rank sum test was used in (D). *, P < 0.05; **, P < 0.01; ***, P < 0.005 here and thereafter.
