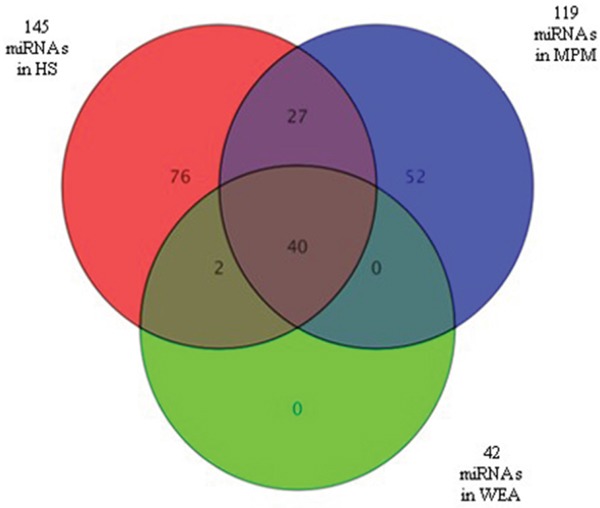
Figure 2. Venn diagram showing miRNAs detected in sera from the three MPM, WEA, HS cohorts analyzed.

MiRNAs (n=119) expressed in MPM are in blue, n=42 are those detected in WEA cohort, in gree, whereas n=145 are the miRNAs detected in HS, in red. MiRNAs n=52 are expressed in MPM samples only. N=76 are expressed in the HS only. None of the MiRNAs (n=42) detected in the WEA cohort was unique of this cohort. Indeed, n=40 were in common with MPM and HS, n=2 were in common with HS only. N=27 miRNAs were found in common between MPM and HS.
