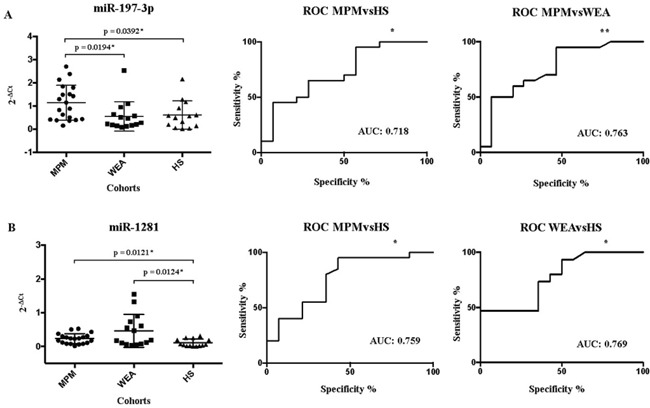
Figure 4. Schematic representation of the Receiver Operating Characteristic (ROC).

In Panel A the MiR-197-3p expression in MPM, WEA and HS cohorts in the X axis, detected by RT-qPCR, is represented as 2−ΔCt value in the Y axis. The ROC AUC for miR-197-3p ratio MPM vs HS, p = 0.0328*; 95% confidence interval 0.5398-0.8959, and MPM vs WEA, p = 0.0085**; 95% confidence interval 0.5981 to 0.9285. Panel B: MiR-1281 expression in sera from MPM patients, WEA and HS, by RT-qPCR. The ROC AUC for miR-1281 ratio MPM vs HS, p = 0.0112* 95% confidence interval 0.5885-0.9293 and confrontation WEA vs HS, p = 0.0137*; 95% confidence interval 0.5963-0.9418. The statistically significant p values are indicate with * and **.
