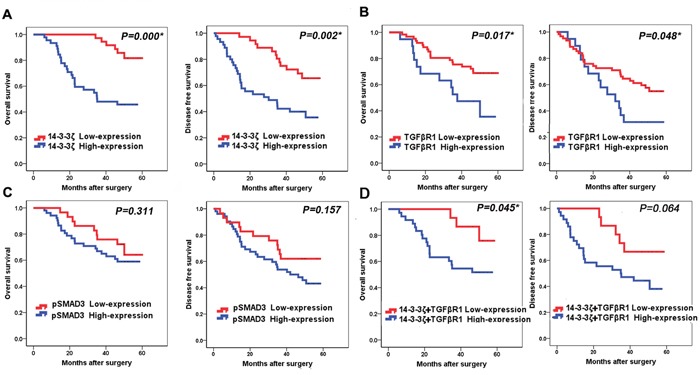
Figure 3. Association of 14-3-3ζ, TGFβR1 and pSMAD3 proteins with survival of lung SCC patients.

A. Kaplan-Meier curve analysis of association between OS, DFS and 14-3-3ζ expression in lung SCC patients. B. Kaplan-Meier curve analysis of association between OS, DFS and TGFβR1 expression in lung SCC patients. C. Kaplan-Meier curve analysis of association between OS, DFS and pSMAD3 expression in lung SCC patients. D. Kaplan-Meier curve analysis of association between OS, DFS and patients who had high expression of both 14-3-3ζ and TGFβR1with patients who had low expression of both 14-3-3ζ and TGFβR1 expression in lung SCC patients.
