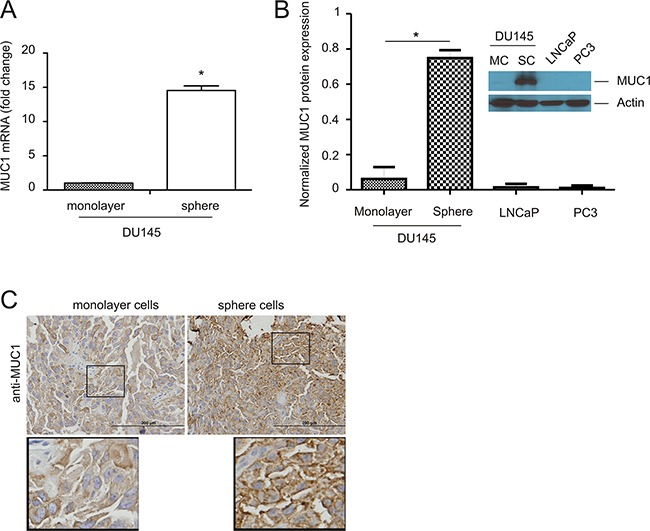
Figure 1. Upregulation of MUC1 in prostate cancer stem-like cells (PCSLCs).

A. Real-time PCR analysis of MUC1 mRNA in the indicated PC cell lines. β-actin was used as an internal control. Experiments were repeated three times. MUC1 mRNA abundance is graphed as a fold change to monolayer cells; mean±SD (standard deviation) are graphed. *:p<0.05 by a 2-tailed Student's t-test. B. MUC1 protein expression in DU145 monolayer cells (MC) and sphere cells (SC), LNCaP, and PC3 cells was determined by Western blot. Experiments were repeated three times; typical images from a single repeat are shown (inset). MUC1 protein levels were normalized to the respective actin; mean±SD are graphed. *p<0.05 by a 2-tailed Student's t-test in comparison to DU145 monolayer cells. C. MUC1 expression in xenograft tumors produced by DU145 monolayer or sphere cells was determined by immunohistochemistry (IHC). The indicated areas are enlarged three fold and placed underneath the original panel.
