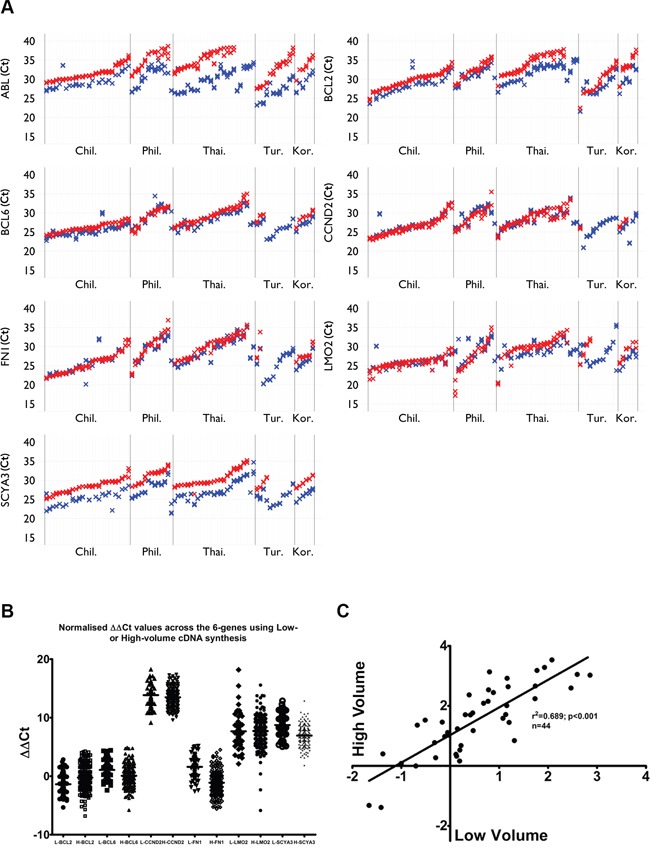
Figure 1. Low versus high volume cDNA synthesis.

A. High volume (blue) consistently gives lower Ct values than low volume (red) for most genes and most samples using Taqman chemistry; B. Normalized delta delta Ct values show that low and high volume datasets are equivalent (n=44); C. Positive correlation was observed in samples where both low- and high volumecDNA synthesis was applied (p<0.001, n=44).
