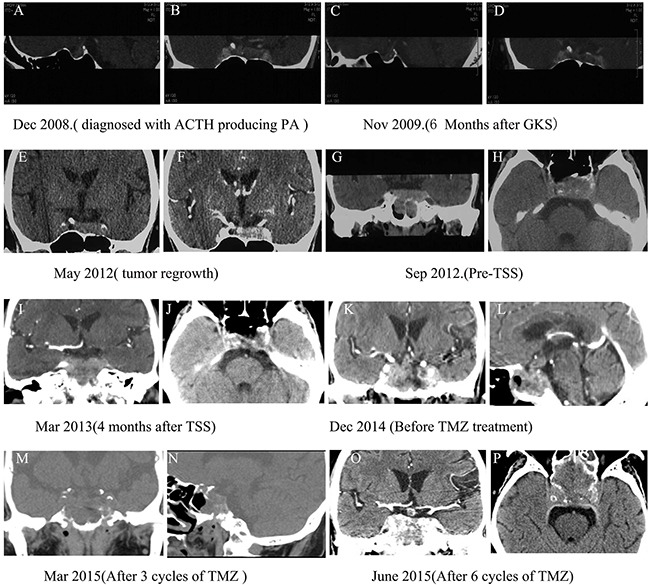
Figure 3. Computed Tomographic (CT) images of pituitary tumors in the case two patient.

A and B. CT images at initial diagnosis. C and D. Six months after GKS. E and F. CT scan from May 2012 showing significant tumor progression. G and H. CT scans from September 2012 showing significantly enlarged pituitary masses that invaded the sphenoid and cavernous sinuses. I and J. CT scan 4 months after TSS showing residual tumor regrowth. K and L. Before TMZ administration. M and N. After 3 cycles of TMZ. O and P. After 6 cycles of TMZ.
