

Abstract
Without new innovations, present rates of increase in yields of food crops globally are inadequate to meet the projected rising food demand for 2050 and beyond. A prevailing response of crops to rising [CO 2] is an increase in leaf area. This is especially marked in soybean, the world's fourth largest food crop in terms of seed production, and the most important vegetable protein source. Is this increase in leaf area beneficial, with respect to increasing yield, or is it detrimental? It is shown from theory and experiment using open‐air whole‐season elevation of atmospheric [CO 2] that it is detrimental not only under future conditions of elevated [CO 2] but also under today's [CO 2]. A mechanistic biophysical and biochemical model of canopy carbon exchange and microclimate (MLCan) was parameterized for a modern US Midwest soybean cultivar. Model simulations showed that soybean crops grown under current and elevated (550 [ppm]) [CO 2] overinvest in leaves, and this is predicted to decrease productivity and seed yield 8% and 10%, respectively. This prediction was tested in replicated field trials in which a proportion of emerging leaves was removed prior to expansion, so lowering investment in leaves. The experiment was conducted under open‐air conditions for current and future elevated [CO 2] within the Soybean Free Air Concentration Enrichment facility (SoyFACE) in central Illinois. This treatment resulted in a statistically significant 8% yield increase. This is the first direct proof that a modern crop cultivar produces more leaf than is optimal for yield under today's and future [CO 2] and that reducing leaf area would give higher yields. Breeding or bioengineering for lower leaf area could, therefore, contribute very significantly to meeting future demand for staple food crops given that an 8% yield increase across the USA alone would amount to 6.5 million metric tons annually.
Keywords: climate change, crop bioengineering, ecohydrology, food security, plant breeding, rising CO2
Introduction
Rising global population coupled with dietary change in emerging economies is predicted to increase global demand for staple food crops 50% by 2030 (Ainsworth et al., 2012), and 70–100% by 2050 (Alexandratos & Bruinsma, 2012; Tilman & Clark, 2015). While the years of the Green Revolution saw large increases in yields per hectare for the major food crops, the rate of increase has declined sharply in the last two decades (Long & Ort, 2010; Ray et al., 2012; Long, 2014; Zhang et al., 2014; Long et al., 2015). This is at least in part because the genetic approaches of the Green Revolution are reaching their biological limits (Zhu et al., 2010). Much of the remaining land that could be used for crop production is either environmentally sensitive, in particular tropical forest, or easily erodible land, such as sloped areas. Failure to increase yields on land currently in crop production to meet future demand will elevate price and incentivize expansion onto sensitive land, accelerating global change through destruction of perennial vegetation and soil tillage. At the same time, there is an ongoing loss of cropland where irrigation has proved unsustainable and where urban expansion is occurring at a rapid pace (Solomon et al., 2007; Strzepek & Boehlert, 2010; Foley et al., 2011; Zhang & Cai, 2011). Rising [CO2] appears to be one of the very few aspects of global change that is predicted to cause increased yields. However, achieved yield increases under open‐air field conditions using Free Air Concentration Enrichment technology (FACE) have proved to be far lower than predicted from studies in controlled environments and field enclosures (Ainsworth et al., 2002, 2008; Morgan et al., 2005; Long et al., 2006). Meeting the projected large increases in demand for staple food crops will therefore require new innovations beyond those used in the first Green Revolution, which focused largely on harvest index improvement. As it requires more than 20 years to transfer any innovation in advantaged seed to the farmer's field, new approaches are needed now to insure against the possible challenges in food supply predicted for mid‐century (Kromdijk & Long, 2016).
A near universal response of plants grown under forecast future elevated [CO2] is an increase in investment in leaves, shown by increased leaf biomass, area, and leaf area index (LAI), that is, the amount of leaf area per unit ground area (Ainsworth & Long, 2005). We hypothesize that modern crop cultivars produce far more leaves than required to maximize seed yield, that is, the total leaf area is supraoptimal. We test this hypothesis with a crop of a modern soybean cultivar. Soybean (Glycine max L. Merr.) is the world's fourth largest food crop in terms of seed production and is the most important vegetable source of protein (Ainsworth et al., 2012). The US Midwest is the largest single producer of soybean accounting for over one‐quarter of global production. While soybean yields have risen in the past few decades (Ainsworth et al., 2012), current rates of increase fall far short of current and projected increase in demand as is already reflected in the global price spikes of recent years (Ray et al., 2013; Long, 2014). Healthy crops of modern soybean cultivars produce an LAI of 6–7 (Dermody et al., 2006). As a result, most leaves are shaded, and some many times, such that they conduct little photosynthesis (Drewry et al., 2010a,b), yet impose significant respiratory and investment costs on the plant. In addition, soybean crops, in common with other major C3 crops such as rice and wheat, produce more leaves with increasing atmospheric [CO2] (Ainsworth & Long, 2005; Dermody et al., 2006), perhaps further exacerbating the problem. Hence, modern crop cultivars appear to overinvest in leaves to the detriment of yield under current and future elevated [CO2] (Morgan et al., 2005; Ainsworth et al., 2012). Indeed, this supraoptimal response of leaf area to rising [CO2] could in part explain why yields have not increased with rising [CO2] to the extent anticipated (Long et al., 2006).
Prior studies mimicking insect damage have shown that minor defoliation does not affect seed yield (Haile et al., 1998). Furthermore, large losses of leaf area can occur due to weather or herbivory events during a growing season with relatively small impacts on yield (Conley et al., 2008, 2009), and insect damage increases under elevated CO2 (Schroeder et al., 2006; Zavala et al., 2008; O'Neill et al., 2011). A more recent growth chamber study has shown that the putative wild ancestor of soybean, Glycine soja Seib et Zucc., can withstand a 50% loss of foliage without loss of seed production (Goto et al., 2016). However, mature leaves were removed in these studies. This would fail to reveal the yield gain that might be achieved by preventing investment in excess leaves or whether more leaves are beneficial under rising [CO2] in the field.
Past modeling studies in canopy optimization have indicated the feasibility of increased canopy net assimilation through structural changes such as altered leaf angles and transmissivity (Drewry et al., 2014). Circumstantial evidence from crop breeding efforts suggests that yield increases associated with year of release of new cultivars have correlated with slight decreases in LAI (Morrison et al., 1999; Jin et al., 2010). However, to date, a detailed canopy microclimate and photosynthesis model, coupled with experimental verification under current and future elevated [CO2], has not been applied to test the hypothesis that modern crops produce too many leaves. Here, biochemical and biophysical principles are used to model and understand whether reduction in leaf area would (1) change total net carbon gain by the crop, that is, net primary production (NPP), and (2) by forcing decreased investment in leaf construction cause a yield increase under current and elevated [CO2]. These predictions were tested experimentally, by artificially removing developing leaves, in replicated field trials, under open‐air conditions of current and elevated [CO2] (550 ppm) within the SoyFACE facility (Long et al., 2006).
Materials and methods
To understand how LAI impacts seed yield in a soybean crop and guide experimental design, model simulation studies were performed using a multilayer soil–root–canopy system vegetation model MLCan (Drewry et al., 2010a). MLCan has been extensively validated for both C3 vegetation and C4 vegetation, including soybean and maize (Drewry et al., 2010a,b; Le et al., 2011; Quijano et al., 2012; Walker et al., 2016), and has the distinctive capability to capture the effect of vegetation acclimation to growth under elevated [CO2] by incorporating ecophysiological, biochemical, and structural acclimation (Drewry et al., 2010b). MLCan integrates the impacts of vertical variations in photosynthetic capacity within the canopy by modeling leaf level biochemical processes, and both leaf and canopy level physical processes of diffusive exchange of heat and gases, as well as radiative exchanges and energy balance. It also captures the dynamic variation of sunlit and shaded portions of canopy leaves during the course of the day (Spitters, 1986; Campbell & Norman, 1998). Leaf level processes are scaled to the crop canopy using a turbulent transport scheme that models scalar gradients such as wind speed, temperature, [CO2], and water vapor within the canopy. MLCan couples its canopy model with a soil–root hydrology model that incorporates hydraulic redistribution by simulating the passive movement of water between soil and roots driven by soil–plant–atmosphere gradients in water potentials (Amenu & Kumar, 2008).
The inputs for MLCan are above‐canopy meteorological forcing (incoming short‐ and long‐wave radiation, precipitation, CO2 concentration, water vapor pressure, air pressure, air temperature, and wind speed), vegetation structural properties (canopy height, LAI, vertical leaf area profile (VLAP), leaf angle distribution, root depth, and root distribution in the vertical soil profile), and physical and biochemical parameters (leaf reflectivity and transmissivity, maximum capacities for ribulose‐1‐5‐bisphosphate (RubP) regeneration (J max) and for RubP carboxylase/oxygenase (Rubisco) limited photosynthetic CO2 assimilation (V cmax); see Drewry et al. (2010a) for details).
Model simulations were performed for soybean plant canopies using observed half hourly meteorological data from the Ameriflux tower at Bondville, Illinois, USA (40.0062 N, 88.2904 W, and 219 m elevation) for the years 2002 (days 213–258), 2004 (days 185–241), and 2006 (days 189–241), for which the model MLCan was previously validated (Drewry et al., 2010a). The Ameriflux site is close to the experimental site at SoyFACE and is a rainfed site that has been subjected to a continuous, surface till, crop rotation practice of alternating annual soybean (even years) and maize (odd years) crop since 1996. Detailed site description and data collection methods have been described previously (Meyers & Hollinger, 2004). The Ameriflux (http://public.ornl.gov/ameriflux/) L4 gap‐filled weather data were used for this simulation.
The parameters used in the model simulations were obtained from the original MLCan model (Drewry et al., 2010a) with the following modifications. Based on measured data (Morgan et al., 2004), V cmax,25 and J max,25 at the top of the canopy were specified as 115 and 205 μmol m−2 s−1, respectively. The decline in leaf nitrogen, and hence V cmax,25, as a function of overlaying canopy LAI was modeled using an exponential extinction coefficient (k n) with a value of 0.2 based on measured data at SoyFACE (Morgan et al., 2004) (Fig. S1b). The corresponding equation for this decline is as follows:
| (1) |
where V cmax,25 {z} is the V cmax,25 at a depth z from the top of the canopy, V cmax,25 {z 0} is the V cmax,25 at the top of the canopy, and LAI {z} is the canopy LAI above depth z (i.e., from the top of the canopy to the depth z). Leaf respiration was also scaled down as a function of leaf nitrogen, such that lower canopy leaves respire less than the upper canopy leaves, using a similar formulation as V cmax,25 with a k n value of 0.2. This is expressed as follows:
| (2) |
where R d,25 {z} is the R d,25 at a depth z from the top of the canopy, and R d,25 {z 0} is the R d,25 at the top of the canopy.
Net primary production was computed across the three growing seasons, under current and elevated (550 [ppm]) [CO2], for different LAI values (Fig. 2a). Potential seed yield was computed as the sum of two components: (1) contribution from NPP, and (2) savings from leaf tissue construction costs. NPP contribution to seed yield was computed as follows. The average seed fill duration (R5 and R6 growth stages) for soybean plants, as measured at SoyFACE in 2002, was 41 days, between days 226 and 267 under current [CO2], and days 228 and 269 under elevated [CO2] (Castro et al., 2009). Computing the seasonal cumulative NPP for the pod filling days provides the total seasonal NPP available for the plant. In total, 80% of this seasonal cumulative NPP was allocated to seeds during the seed fill stage, after deducting a 35% pod and seed tissue construction cost to account for growth respiration costs (Bunce & Ziska, 1996). Using the average fractions of total plant carbon in soybean seeds under current and elevated [CO2] which were measured at SoyFACE as 0.514 and 0.519, respectively (Gray et al., 2013), we obtained the seed yield contributions from NPP for a given LAI.
Figure 2.
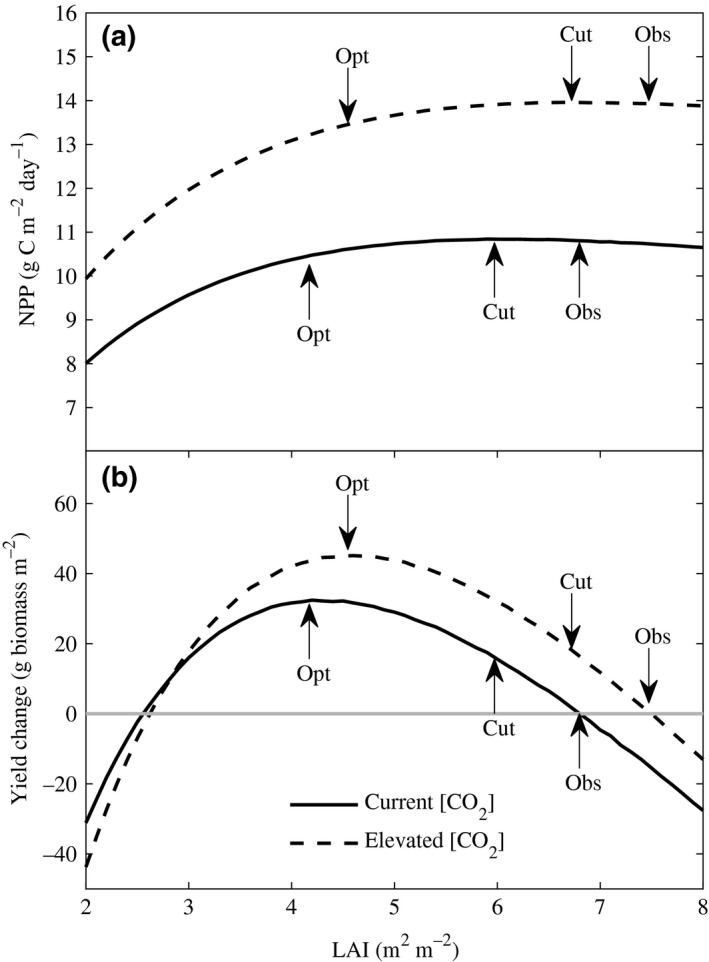
Predicted (a) aboveground net primary production and (b) yield change relative to observed yield as a function of area, and area index (LAI) of soybean crop leaf canopies under current and elevated [CO 2] (550 ppm). While the observed LAI under current and elevated [CO 2] is 6.8 and 7.5, respectively, the optimum LAI for maximizing yield is 4.2 and 4.6, respectively. When LAI is decreased from observed to optimal values in the model, yield increases by 8% and 10% under current and elevated [CO 2], respectively, while NPP remains relatively invariant. Peak LAI achieved through experimental reduction by clipping emerging leaves resulted in a predicted yield increase of 4% under both current and elevated [CO 2], respectively.
The potential gain in seed yield by suppressing leaf development was computed as follows. In simulating the effect of leaf area, LAI is varied around the observed peak value. The difference between observed LAI and simulated LAI was converted into biomass using specific leaf weight. The average specific leaf weight for soybean leaves under current and elevated [CO2] was 28.4 and 35.5 [g m−2], respectively (Dermody et al., 2006). After accounting for growth respiration, it is assumed that all the carbon diverted from the savings in leaf production will be available for pod and seed production, during the reproductive growth phase of the plant. We also account for the lower carbon fraction in seeds under elevated [CO2], which at SoyFACE was 0.456 and 0.453 for current and elevated [CO2], respectively (Dermody et al., 2008)). The yield contribution from NPP and suppressed leaf construction were summed to obtain the total seed yield, and in turn allowed calculation of optimum LAI that maximizes the seed yield.
Experimental materials and methods
Leaf area manipulation experiments were performed on indeterminate soybean (Glycine max L. Merr.) maturity group 3 cultivar Pioneer 93B15 canopies, under both the current [CO2] of 390 [ppm] and elevated [CO2] of 550 [ppm], using the 32 hectare SoyFACE facility at the University of Illinois (40.0559 N, 88.2009 W, and 230 m elevation) during the year 2010. This facility provided precisely controlled open‐air elevation of [CO2] to 550 [ppm], from the ambient 390 [ppm], approximating to the business‐as‐usual concentration projected by the Intergovernmental Panel on Climate change in 2001 (Prentice et al., 2001). The FACE experiment for elevated [CO2] was performed using eight octagonal plots of 20 [m] diameter, four control at current [CO2] and four treatment at elevated [CO2] (Morgan et al., 2004).
The soil type at SoyFACE is Drummer–Flanagan series (fine‐silty, mixed, mesic Typic Endoa‐quoll) (Morgan et al., 2005). Tile drains are present at a depth of about 1–2 m below the ground surface, and hence, the water table is always below this level. The average ground surface slope at this site is <1%. This rainfed site has been subjected to a continuous crop rotation practice of alternating annual soybean and maize, with management typical for the Corn Belt as described previously for the Ameriflux site. The weather station at SoyFACE provided continuous measurements of wind speed, temperature, radiation, and humidity at hourly intervals (Fig. S2) (Vanloocke et al., 2010).
Soybean seeds were planted on May 26, 2010 using a mechanical seed planter with a row spacing of 0.38 [m]. Fumigation with CO2 was conducted from sunrise to sunset and began on crop emergence on the June 9 and continued until September 28, when crop dry‐down was complete, just prior to harvest. No fertilizer, pesticide, or insecticide was applied within the plots, reflecting standard regional practice for the cultivation of soybean crops following rotation with a fertilized maize crop, as in this case (Morgan et al., 2004). Following emergence, plots were thinned to achieve a final density of 52 [plants m−2], in line with typical production population densities. All the plots were weeded manually between 13 and July 15.
Each of the eight octagonal plots of SoyFACE contained, within its ≈ 350 m2 area, one LAI reduction subplot of 6 m by 2 m and an adjacent control subplot of the same size. This forms a randomized complete‐block split‐plot experimental design. LAI reduction was achieved by removing approximately seven emerging trifoliate leaves (before they reached 2 cm in length) per plant (Fig. 1). Defoliation was performed twice: July 16–21 and August 4–6 to reduce investment in leaves during the critical stage of seed fill (estimated at vegetative stages V10–V16 and reproductive stages R3–R6 (Castro et al., 2009)). The leaf tissue that was removed was bagged and dried to constant weight, and its final weight was recorded.
Figure 1.
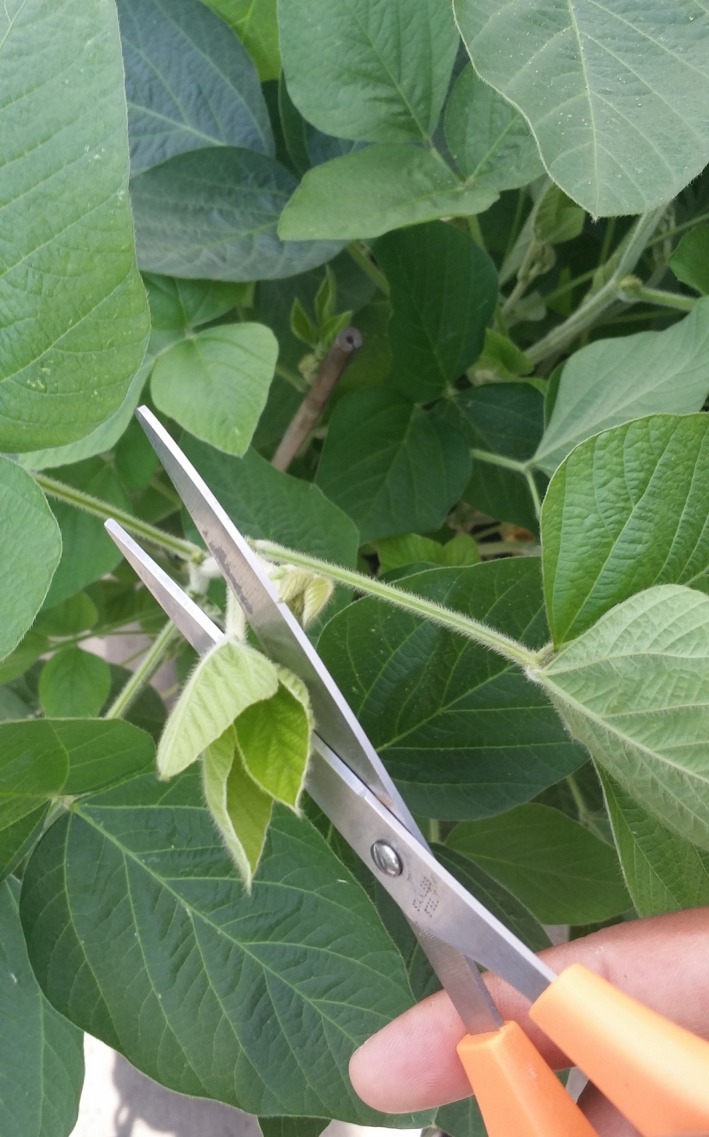
Demonstration of area, and area index reduction achieved by removing young emerging trifoliate leaves.
Leaf area index was measured on a weekly basis from the beginning of July to the end of August using a plant canopy analyzer (LAI‐2000; LI‐COR Inc., Lincoln, NB, USA). The canopy analyzer determines LAI using a fisheye optical sensor that measures radiation attenuation and direction in a series of solid angles constituting a hemispherical receiver (Welles & Norman, 1991). All measurements were performed in conditions where the incoming solar radiation was predominantly diffuse, that is, heavily overcast sky, or dawn and dusk. LAI measurements were performed along a diagonal transect between the innermost rows of each subplot using a 45° view cap. Each measurement consisted of one above‐canopy reading followed by three evenly spaced below‐canopy readings that were positioned 1 m apart. The standard error (SE) was maintained below 0.3 when LAI was <3.5, that is, before canopy closure, and below 0.15 when LAI was >3.5, that is, after canopy closure. All leaves had senesced in all the subplots by September 17.
After completion of dry‐down in the field, 4 m long sections of the innermost two rows of each subplot were manually harvested on September 27, by cutting at the base of the stem to remove all the aboveground biomass. The two inner rows had a buffer of 1 m and 0.3 m along the row and across the rows, respectively, at each end of each subplot. As there were no gaps between the subplot rows and adjacent rows of the same cultivar, a larger number of guard rows were unnecessary. Seeds were removed with a mechanical thresher and dried at 85 °C to constant weight, and final weight was recorded.
Statistical analysis
To analyze the effect of leaf removal on LAI, data were analyzed using a randomized complete‐block, split‐plot, repeated‐measures design. A mixed model analysis of variance was performed with the Satterthwaite option (Proc MIXED routine, sas v9.4, SAS Institute, Cary, NC, USA). DOY, [CO2] treatment, LAI reduction treatment, and the interactions DOY × [CO2] treatment, DOY × LAI reduction treatment, LAI reduction treatment × [CO2] treatment, and DOY × [CO2] treatment × LAI reduction treatment were treated as fixed effects, and block was treated as a random effect. The analysis was performed on LAI data from the first LAI reduction treatment through the end of the growing season. The best fit covariance matrix (unstructured) was chosen using Akaike's information criterion.
To analyze the effect of leaf removal on seed yield, data were analyzed using a randomized complete‐block, split‐plot design. A mixed model analysis of variance was performed with the Satterthwaite option (Proc MIXED routine, sas v9.4, SAS Institute). LAI reduction treatment, [CO2] treatment and the interaction of LAI reduction treatment × [CO2] treatment were considered as fixed effects, and block was treated as a random effect.
The results of the statistical models for both the LAI and seed yield indicated that the block effect was not significant; however, the statistical conclusions were the same with and without including the block effect. Least‐square means differences were calculated (LSMEANS routine, sas v9.4, SAS Institute) using pairwise comparisons of LAI reduction treatment or [CO2] treatment. A one‐sided F‐test was used to obtain P‐values (α = 0.05) to test the hypothesis that experimentally removing emerging leaves would (1) decrease LAI, and (2) increase seed yield.
Results
The model predicted that the optimal LAI to maximize seed yield under current and elevated [CO2] was 4.2 and 4.6, respectively (Fig. 2b). This is ≈40% less than the observed peak LAI of 6.8 and 7.5, respectively (Fig. 2b). Decreasing LAI to the model optimum values was predicted to increase seed yield by 8% and 10%, respectively (Fig. 2b).
The difference in model‐simulated NPP between observed LAI and model predicted optimum LAI was very small (≈ 3%) under both [CO2] treatments. The model therefore predicts that the additional two units of LAI above the model predicted optimum would not significantly contribute to net carbon gain, as photosynthesis roughly compensated for respiratory costs (Fig. 2a). The predicted gains in yield were primarily due to decreased investment in leaves allowing predicted increase in seed production. However, as LAI is lowered below the optimum value, predicted losses in NPP become significant to the detriment of seed production. Plants with optimal LAI are predicted to use 38% and 39% less carbon in constructing leaf tissue, than for the LAI observed in the field, under current and elevated [CO2], respectively (Fig. S3). Peak LAI in soybean, as in most seed and grain crops, is important as it is experimentally observed to occur at the time when seed fill starts (Dermody et al., 2006). In field‐grown soybean, it is observed to be largely maintained during seed fill through continued production of leaves, the period that is most critical for final yield (Dermody et al., 2006).
Why does increased leaf area not result in a predicted increase in NPP? The predicted total photosynthetic CO2 uptake, that is, gross primary production (GPP) at midday, is 13% higher under observed peak LAI (6.8) than at the predicted optimum LAI for yield (4.2) (Fig. 3a). However, the predicted gains are much lower in the low light levels of the rest of the day, and these gains are offset by the 25% increase in respiratory losses caused by the additional leaf area (Fig. 3a). As NPP represents the difference between GPP and respiratory losses by the whole plant, the net effect is a very small (~3%) increase in NPP as the LAI is increased by 40% from optimum to observed peak values (Figs 2a and 3c). As LAI increases, marginal gains in GPP diminish, while the respiratory losses increase (Fig. S4). A similar behavior is observed under elevated [CO2], but with an optimum LAI that is 10% higher than under current [CO2] (Figs 3b, c, and S4). This higher value is because, for a given LAI, elevated [CO2] stimulates NPP by improving light use efficiency through reduced photorespiration, which results in a lower light compensation point, that is, the light level at which photosynthetic [CO2] uptake equals respiratory loss (Long & Drake, 1991; Drake et al., 1997; Ainsworth & Rogers, 2007).
Figure 3.
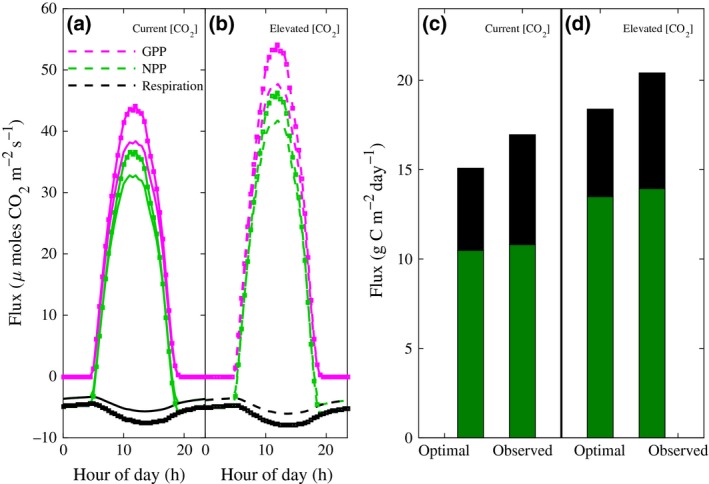
Predicted average diurnal gross photosynthetic canopy uptake of CO 2 (GPP, magenta), respiratory efflux (respiration, black), and the net of these (NPP, green) for optimal LAI (plain lines) and observed peak LAI (square markers) under (a) current and (b) elevated [CO 2]. Cumulative flux for the simulated 24‐h period for optimal and observed LAI values, under (c) current (ambient) and (d) elevated [CO 2], where the sum of respiration (black bar) and NPP (green bar) gives GPP.
How does the architecture of the soybean canopy, and its associated light interception, cause the predicted trade‐off effect between gains in GPP and losses in respiration as LAI is reduced? Soybean plants have more leaves near the top of its canopy profile (Dermody et al., 2006; Fig. S1a), which significantly reduces the light penetration through to the lower canopy and the associated contribution of lower layers to NPP (Drewry et al., 2010a, 2014). Upper canopy leaves are sunlit and contribute most to NPP, while lower leaves are shaded and contribute least (Fig. S5). The proportion of shaded leaves increases with LAI such that, at solar noon, 53% of the canopy is shaded at the predicted optimal LAI, whereas 68% of the canopy is shaded at the actual observed peak LAI (Fig. S6a). Shading increases with the lower sun angles that occur either side of solar noon. As a result, when integrated over the course of the day, on average, 84% of leaves at the predicted optimum LAI and 90% at the observed peak LAI in the field are shaded (Fig. S6a).
Comparing the model‐estimated canopy light use efficiency (LUE) between the predicted optimum LAI and the observed LAI, we find that the LUE is higher under optimal LAI by 9% and 7% under current and elevated [CO2], respectively (Fig. 4a). LUE is the ratio of canopy NPP to the photosynthetically active radiation (PAR) absorbed by the canopy. PAR absorbed by the canopy declines as LAI is decreased from the observed peak to the predicted optimum value (Fig. S6b), while NPP remains relatively invariant (Fig. 2a). Hence, the numerator (NPP) in the formulation for LUE remains invariant, while the denominator (PAR absorbed) decreases, resulting in an increased LUE, as we decrease LAI from the observed peak to the predicted optimum value. The analysis of the sunlit and shaded leaves (Figs S5 and S6) and the variation of LUE (Fig. 4a) are consistent with the predicted yield results (Fig. 2) where maximal yield was achieved at LAIs that are 40% lower than the observed peak LAIs.
Figure 4.
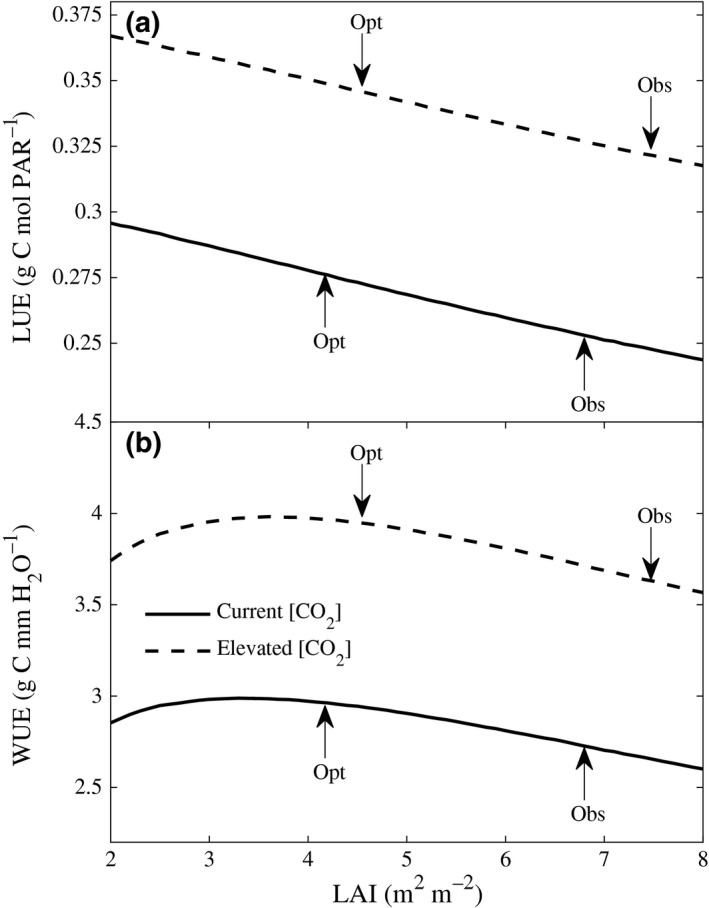
Predicted (a) canopy light use efficiency (LUE) and (b) water use efficiency (WUE) as a function of LAI, illustrating that decreasing LAI to optimal values increases LUE by 9% and 7% and WUE by 9% under both current and elevated [CO 2].
Reducing LAI also decreases crop water demand by 11% under both current and elevated [CO2] (Fig. S7). This is because plants with fewer leaves transpire less without significantly changing their NPP. This results in a predicted increase in canopy water use efficiency (WUE) by 9% under both current and elevated [CO2] (Fig. 4b). WUE is defined as the ratio of canopy NPP to crop evapotranspiration.
Consistent with previous experiments (Morgan et al., 2005; Dermody et al., 2006), elevated [CO2] increased LAI by 17% (P < 0.0005) and seed yield by 25% (P < 0.0178) (Table 1, Figs 5 and 6). The removal of emerging leaves (Fig. 1) significantly decreased LAI throughout seed fill and resulted in an 8% (P < 0.0414) increase in seed yield under both [CO2] treatments (Table 1 and Figs 5 and 6). The interaction between [CO2] and the LAI reduction treatment was not significant (Table 1).
Table 1.
Analysis of variance of the effects of elevated [CO2] and leaf removal on the measured LAI and yield of soybean in SoyFACE
| Treatment effect | LAI (m2 m−2) | Yield (g m−2) | ||||
|---|---|---|---|---|---|---|
| Mean difference | % difference | P‐value | Mean difference | % difference | P‐value | |
| Elevated [CO2] | +0.66 | +16.76 | 0.0005 | +93.41 | +24.76 | 0.0178 |
| LAI reduction | −0.23 | −3.70 | 0.0157 | +32.99 | +8.10 | 0.0414 |
| Elevated [CO2] × LAI reduction | – | – | 0.4442 | – | – | 0.4272 |
Bold values indicate where treatment effects or interactions were significant (α = 0.05).
Figure 5.
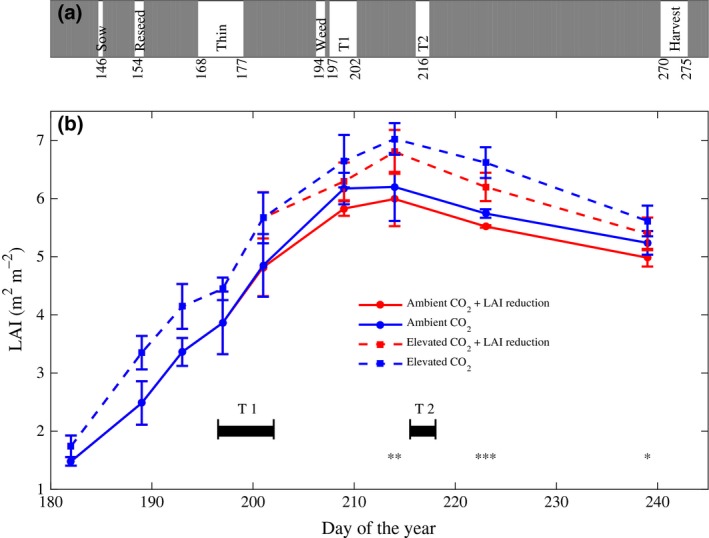
Summary of the 2010 experimental results. (a) Timeline of the experiment in Julian day. T1 and T2 denote LAI reduction treatments 1 and 2, respectively. (b) Measured LAI with (red) and without (blue) LAI reduction treatment at current (solid lines) and elevated [CO 2] (dashed lines), in the field experiment. Each point represents the average across four replicates ±1 SE Significance for a difference in LAI due to the reduction is indicated as *, **, and ***, corresponding to α of 0.05 < 0.01, and <0.001, respectively.
Figure 6.
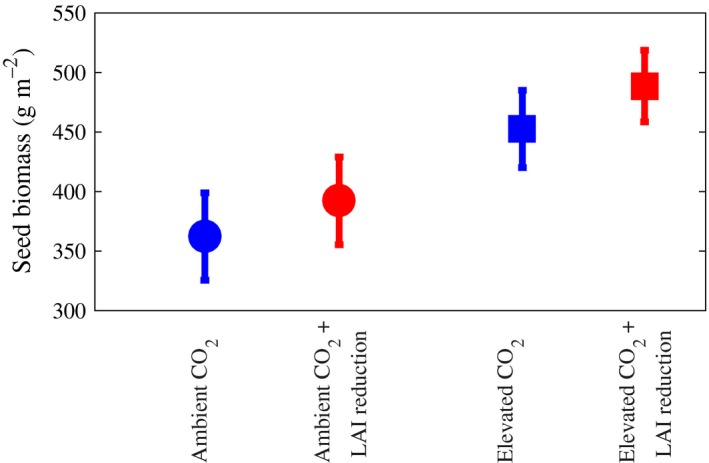
Yield with (red) and without (blue) experimental LAI reduction, at current (circles) and elevated (squares) [CO 2]. Each point represents the average across four replicates ±1 SE; LAI reduction gave a significant increase in yield; see Table 1.
Discussion
The combined model and experimental results show that a modern soybean cultivar appears to produce far more leaves than necessary to the detriment of yield, a trend that appears to rise with rising [CO2]. Although our model predicts that the optimum LAI rises with [CO2], it also predicts that even the current observed LAI during seed fill is supraoptimal for future elevated [CO2]. Our model results predict that NPP (net carbon gain) is insensitive to LAI for a wide range of values (4.0–8.0; Fig. 2). At this range of LAI, most canopy leaves are shaded and hence photosynthetically less efficient, that is, adding more leaves does not significantly benefit net carbon gain. However, by having fewer leaves, plants save on investment cost in constructing leaf tissue, and this could advantageously be diverted toward seed production, thereby increasing seed yield. In practice, artificially decreasing investment in leaves by removing a proportion of the emerging leaves during seed fill in the field resulted in increased seed yield. Significant increases in the magnitude predicted by the model were observed in the field both at current and elevated [CO2] (Table 1; Fig. 6).
An important benefit of having fewer canopy leaves is its associated lower crop water demand. This indicates the potential to improve seed yield while increasing sustainability with respect to water use (Richards, 1983; Drewry et al., 2014). It is possible that by having a lesser transpiration demand (Fig. S7), plants with lower LAI can potentially have fewer roots and save on root investment and maintenance costs. The additional savings in roots could then be used to further increase seed yield, making our predicted yield increase estimates conservative. Alternatively maintaining the same amount of root, yet decreasing transpiration demand, would make the crop more drought tolerant which will assume increasing importance across the Midwest as predicted climate change develops (Lobell et al., 2014; Ort & Long, 2014).
The lack of sensitivity of NPP over a wide range of LAI values (Fig. 2a) suggests that soybean produces surplus leaves during seed filling when resources could be diverted to fill more seeds. Further, it needs more water as well; why? The putative wild ancestor of soybean occurs in mixed communities (Ohara & Shimamoto, 1994). Here, production of more leaves than are necessary to achieve optimum yield serves to shade out competitors. Insect herbivory was found to remove an average of 30% leaf area in a survey of wild soybean in Japan (Goto et al., 2016). Therefore, overproduction of leaves would be protection against seed production loss following herbivory. This could be critical during seed fill, when loss of leaves is to the extent that canopy carbon uptake is diminished resulting in underfilled seed. This would greatly decrease the probability of survival of the resulting seedlings in the wild. Finally, some forms of wild soybeans twine around the stems of other plants, such as tall grasses. This results in a much greater distance between leaves than in the bush form of modern cultivated soybean. Inheritance of this characteristic from the wild ancestor could also lead to overproduction of leaves. While lowering LAI makes plants more optimal to maximize seed yield, it also makes the plants less resilient against herbivory, disease losses of leaves, and competition from neighboring plants (Makela et al., 2002; Srinivasan & Kumar, 2015). However, modern germplasm coupled with biotechnology, chemical treatment and agronomic advances have minimized such pressures.
While our model predictions were based solely on carbon considerations, other nutrients (such as nitrogen, phosphorus) play a critical role in plant development and are essential to achieve high yields. While the nutritive quality of the yield of many crops declines when grown under elevated [CO2], legumes generally are less affected (Myers et al., 2014). Previous studies of soybean grown throughout the growing season in elevated [CO2] at SoyFACE have not found any differences in seed nitrogen content, compared to ambient [CO2], despite increases in seed yield (Gray et al., 2013). Carbohydrates provide the energy for microbial nitrogen fixation, as well as for mycorrhizal foraging for nutrients such as phosphorus (Cotton et al., 2015). The finding that nitrogen content is not affected implies that a constant proportion of the additional carbon fixed is used to supply these nutrients. In soybean, N assimilation was increased under elevated [CO2] in proportion to the increase in biomass such that C/N was unchanged (Rogers et al., 2006). While senescing leaves can be a source of N for the developing seed, only about half of leaf nitrogen is remobilized during senescence in legumes (Araujo et al., 2012). Although estimates vary widely, a detailed analysis suggests that between 7 and 12 mol CO2 assimilated are needed to power the fixation of 1 mol N in legumes (Minchin & Witty, 2005). This suggests a further cost of surplus leaves in legumes that could further lower yields. In C3 nonlegume crops, a small but significant decline in N and proteins occurs with growth under elevated [CO2] (Ainsworth & Long, 2005; Myers et al., 2014). Again surplus leaves sequestering limiting N and indeed other nutrients could have a detrimental effect on quantity and quality of the harvested product.
Our LAI reduction experiments removed seven emerging trifoliate leaves per plant, with an expected decrease in LAI of about 2–3. However, the actual decrease in LAI was much smaller. As area per trifoliate leaf decreases during the reproductive stage of plant growth, defoliation of emerging leaves after seed fill removes relatively smaller leaves resulted in a lower decrease in LAI than initially expected. The observed lesser than expected decrease in LAI also indicated some compensatory growth of additional leaf area in response to defoliation. While our LAI reduction experiment was only able to decrease peak LAI by 4% resulting in an 8% increase in seed yield, the model predicted that a 38% reduction in LAI would have been optimum and would increase yield by 8%. This suggests that there is potential to further decrease LAI and potentially achieve considerably greater yield gain due to additional savings in leaf construction cost.
Although this study considered a single modern commercial soybean cultivar, its leaf area appears to be average across cultivars, and in fact with below average increase in leaf area under elevated [CO2] (Ainsworth et al., 2002). This suggests that the findings in this research could have wider applicability and with further testing could prove to be relevant to other major C3 food crops. Given the genetic resources available for this crop, breeding for a lower LAI during seed development stage should be a readily achievable goal (Haile et al., 1998; Bishop et al., 2015). This study is perhaps a first test of concept that applies computer model simulations to identify nonintuitive means of achieving yield increase, here decreasing, not increasing, leaf area. These results suggest a broader opportunity to drastically boosting crop yield at a time of stagnation of improvements in major C3 food crops, with the potential to positively impact national and international food and water security under a changing climate.
Supporting information
Figure S1. Vertical distribution of leaf nitrogen (and hence V cmax,25) in soybean canopies.
Figure S2. SoyFACE weather data for year 2010 (black line) with average (grey line) and ±1 SE (shaded grey region) across 9 years (2002–2010).
Figure S3. Estimated leaf tissue construction carbon costs, as a function of LAI in soybean plant canopies under current and elevated [CO2] (550 ppm).
FigureS4.Predicted variation in total photosynthetic canopy uptake of CO2 (GPP), respiratory efflux (Respiration) and the net of these (NPP) as a function of LAI in current (solid lines) and elevated (dashed lines) [CO2].
Figure S5. Individual and combined predicted contributions of average sunlit and shaded leaves to canopy NPP over a 24 h period as a function of LAI.
Figure S6. Shading in soybean canopies.
Figure S7. Predicted total crop transpiration as a function of LAI.
Acknowledgements
NSF grant ATM 06‐28687 supported the modeling and fieldwork, which was later completed with the support by NSF grants EAR09‐11205, CBET 12‐09402, and EAR 13‐31906 and the RIPE (Realizing Increased Photosynthetic Efficiency) grant from the Bill and Melinda Gates Foundation. We thank Kannan Puthuval, engineer and site manager, for operating and maintaining the SoyFACE experimental facility. We thank Amy Betzelberger, Sayo Chaoka, Patrick Schmitz, Ciaran Harman, Juan Quijano, Roselyn Kim, and Phong Lee for their assistance in the collection of data for the field work. We thank Justin McGrath for his assistance on some of the statistical analysis performed in this work. We thank Andrew Leakey, Carl Bernacchi, Lisa Ainsworth, Don Ort, Darren Drewry, and Murugesu Sivapalan for their feedback, suggestions, and comments.
Contributor Information
Praveen Kumar, Email: kumar1@illinois.edu.
Stephen P. Long, Email: slong@illinois.edu
References
- Ainsworth EA, Long SP (2005) What have we learned from 15 years of free‐air CO2 enrichment (FACE)? A meta‐analytic review of the responses of photosynthesis, canopy. New Phytologist, 165, 351–371. [DOI] [PubMed] [Google Scholar]
- Ainsworth EA, Rogers A (2007) The response of photosynthesis and stomatal conductance to rising CO2: mechanisms and environmental interactions. Plant Cell and Environment, 30, 258–270. [DOI] [PubMed] [Google Scholar]
- Ainsworth EA, Davey PA, Bernacchi CJ et al (2002) A meta‐analysis of elevated CO2 effects on soybean (Glycine max) physiology, growth and yield. Global Change Biology, 8, 695–709. [Google Scholar]
- Ainsworth EA, Leakey ADB, Ort DR, Long SP (2008) FACE‐ing the facts: inconsistencies and interdependence among field, chamber and modeling studies of elevated CO(2) impacts on crop yield and food supply. New Phytologist, 179, 5–9. [DOI] [PubMed] [Google Scholar]
- Ainsworth EA, Yendrek CR, Skoneczka JA, Long SP (2012) Accelerating yield potential in soybean: potential targets for biotechnological improvement. Plant Cell and Environment, 35, 38–52. [DOI] [PubMed] [Google Scholar]
- Alexandratos N, Bruinsma J (2012) World agriculture towards 2030/2050: the 2012 revision. Report, FAO.
- Amenu GG, Kumar P (2008) A model for hydraulic redistribution incorporating coupled soil‐root moisture transport. Hydrology and Earth System Sciences, 12, 55–74. [Google Scholar]
- Araujo AP, Del Pin B, Teixeira MG (2012) Nitrogen and phosphorus in senescent leaves of field‐grown common bean cultivars and their contribution to crop nutrient budget. Field Crops Research, 127, 35–43. [Google Scholar]
- Bishop KA, Betzelberger AM, Long SP, Ainsworth EA (2015) Is there potential to adapt soybean (Glycine max Merr.) to future [CO2]? An analysis of the yield response of 18 genotypes in free‐air CO2 enrichment. Plant Cell and Environment, 38, 1765–1774. [DOI] [PubMed] [Google Scholar]
- Bunce JA, Ziska LH (1996) Responses of respiration to increases in carbon dioxide concentration and temperature in three soybean cultivars. Annals of Botany, 77, 507–514. [Google Scholar]
- Campbell GS, Norman JM (1998) An Introduction to Environmental Biophysics (2nd edn). Springer, New York. [Google Scholar]
- Castro JC, Dohleman FG, Bernacchi CJ, Long SP (2009) Elevated CO2 significantly delays reproductive development of soybean under Free‐Air Concentration Enrichment (FACE). Journal of Experimental Botany, 60, 2945–2951. [DOI] [PubMed] [Google Scholar]
- Conley SP, Abendroth L, Elmore R, Christmas EP, Zarnstorff M (2008) Soybean seed yield and composition response to stand reduction at vegetative and reproductive stages. Agronomy Journal, 100, 1666–1669. [Google Scholar]
- Conley SP, Pedersen P, Christmas EP (2009) Main‐stem node removal effect on soybean seed yield and composition. Agronomy Journal, 101, 120–123. [Google Scholar]
- Cotton TEA, Fitter AH, Miller RM, Dumbrell AJ, Helgason T (2015) Fungi in the future: inter‐annual variation and effects of atmospheric change on arbuscular mycorrhizal fungal communities. New Phytologist, 205, 1598–1607. [DOI] [PMC free article] [PubMed] [Google Scholar]
- Dermody O, Long SP, DeLucia EH (2006) How does elevated CO2 or ozone affect the leaf‐ area index of soybean when applied independently? New Phytologist, 169, 145–155. [DOI] [PubMed] [Google Scholar]
- Dermody O, O'Neill BF, Zangerl AR, Berenbaum MR, DeLucia EH (2008) Effects of elevated CO2 and O3 on leaf damage and insect abundance in a soybean agroecosystem. Arthropod‐ Plant Interactions, 2, 125–135. [Google Scholar]
- Drake BG, GonzalezMeler MA, Long SP (1997) More efficient plants: a consequence of rising atmospheric CO2? Annual Review of Plant Physiology and Plant Molecular Biology, 48, 609–639. [DOI] [PubMed] [Google Scholar]
- Drewry DT, Kumar P, Long S, Bernacchi C, Liang XZ, Sivapalan M (2010a) Ecohydrological responses of dense canopies to environmental variability: 1. Interplay between vertical structure and photosynthetic pathway. Journal of Geophysical Research‐Biogeosciences, 115, G04022. [Google Scholar]
- Drewry DT, Kumar P, Long S, Bernacchi C, Liang XZ, Sivapalan M (2010b) Ecohydrological responses of dense canopies to environmental variability: 2. Role of acclimation under elevated CO2 . Journal of Geophysical Research‐Biogeosciences, 115, G04023. [Google Scholar]
- Drewry DT, Kumar P, Long SP (2014) Simultaneous improvement in productivity, water use, and albedo through crop structural modification. Global Change Biology, 20, 1955–1967. [DOI] [PubMed] [Google Scholar]
- Foley JA, Ramankutty N, Brauman KA et al (2011) Solutions for a cultivated planet. Nature, 478, 337–342. [DOI] [PubMed] [Google Scholar]
- Goto H, Shimada H, Horak MJ et al (2016) Characterization of natural and simulated herbivory on wild soybean (Glycine soja Seib. et Zucc.) for use in ecological risk assessment of insect protected soybean. PLoS ONE, 11, e0151237. [DOI] [PMC free article] [PubMed] [Google Scholar]
- Gray SB, Strellner RS, Puthuval KK et al (2013) Minirhizotron imaging reveals that nodulation of field‐grown soybean is enhanced by free‐air CO2 enrichment only when combined with drought stress. Functional Plant Biology, 40, 137–147. [DOI] [PubMed] [Google Scholar]
- Haile F, Higley L, Specht J, Spomer S (1998) Soybean leaf morphology and defoliation tolerance. Agronomy Journal, 90, 353–362. [Google Scholar]
- Jin J, Liu X, Wang G, Mi L, Shen Z, Chen X, Herbert S (2010) Agronomic and physiological contributions to the yield improvement of soybean cultivars released from 1950 to 2006 in Northeast China. Field Crops Research, 115, 116–123. [Google Scholar]
- Kromdijk W, Long SP (2016) One crop breeding cycle from starvation? How engineering crop photosynthesis for rising CO2 and temperature could be one important route to alleviation Proceedings of the Royal Society of London. Series B, Biological Sciences, 283, 20152578. [DOI] [PMC free article] [PubMed] [Google Scholar]
- Le PVV, Kumar P, Drewry DT (2011) Implications for the hydrologic cycle under climate change due to the expansion of bioenergy crops in the Midwestern United States. Proceedings of the National Academy of Sciences of the United States of America, 108, 15085–15090. [DOI] [PMC free article] [PubMed] [Google Scholar]
- Lobell DB, Roberts MJ, Schlenker W, Braun N, Little BB, Rejesus RM, Hammer GL (2014) Greater sensitivity to drought accompanies maize yield increase in the US Midwest. Science, 344, 516–519. [DOI] [PubMed] [Google Scholar]
- Long SP (2014) We need winners in the race to increase photosynthesis in rice, whether from conventional breeding, biotechnology or both. Plant Cell and Environment, 37, 19–21. [DOI] [PubMed] [Google Scholar]
- Long SP, Drake BG (1991) Effect of the long‐term elevation of CO2 concentration in the field on the quantum yield of photosynthesis of the C3 sedge, Scirpus olneyi . Plant Physiology, 96, 221–226. [DOI] [PMC free article] [PubMed] [Google Scholar]
- Long SP, Ort DR (2010) More than taking the heat: crops and global change. Current Opinion in Plant Biology, 13, 241–248. [DOI] [PubMed] [Google Scholar]
- Long SP, Ainsworth EA, Leakey ADB, Nosberger J, Ort DR (2006) Food for thought: lower than expected crop yield stimulation with rising CO2 concentrations. Science, 312, 1918–1921. [DOI] [PubMed] [Google Scholar]
- Long SP, Marshall‐Colon A, Zhu XG (2015) Meeting the global food demand of the future by engineering crop photosynthesis and yield potential. Cell, 161, 56–66. [DOI] [PubMed] [Google Scholar]
- Makela A, Givnish TJ, Berninger F, Buckley TN, Farquhar GD, Hari P (2002) Challenges and opportunities of the optimality approach in plant ecology. Silva Fennica, 36, 605–614. [Google Scholar]
- Meyers TP, Hollinger SE (2004) An assessment of storage terms in the surface energy balance of maize and soybean. Agricultural and Forest Meteorology, 125, 105–115. [Google Scholar]
- Minchin FR, Witty JF (2005) Respiratory/carbon costs of symbiotic nitrogen fixation in legumes In: Plant Respiration: From Cell to Ecosystem (eds Lambers H, Ribas‐Carbo M.), pp. 195–205. Springer, Dordrecht. [Google Scholar]
- Morgan PB, Bernacchi CJ, Ort DR, Long SP (2004) An in vivo analysis of the effect of season‐long open‐air elevation of ozone to anticipated 2050 levels on photosynthesis in soybean. Plant Physiology, 135, 2348–2357. [DOI] [PMC free article] [PubMed] [Google Scholar]
- Morgan PB, Bollero GA, Nelson RL, Dohleman FG, Long SP (2005) Smaller than predicted increase in aboveground net primary production and yield of field‐grown soybean under fully open‐air CO2 elevation. Global Change Biology, 11, 1856–1865. [Google Scholar]
- Morrison MJ, Voldeng HD, Cober ER (1999) Physiological changes from 58 years of genetic improvement of short‐season soybean cultivars in Canada. Agronomy Journal, 91, 685–689. [Google Scholar]
- Myers SS, Zanobetti A, Kloog I et al (2014) Increasing CO2 threatens human nutrition. Nature, 510, 139–142. [DOI] [PMC free article] [PubMed] [Google Scholar]
- Ohara M, Shimamoto Y (1994) Some ecological and demographic characteristics of 2 growth forms of wild soybean (Glycine‐soja). Canadian Journal of Botany, 72, 486–492. [Google Scholar]
- O'Neill BF, Zangerl AR, DeLucia EH, Casteel C, Zavala JA, Berenbaum MR (2011) Leaf temperature of soybean grown under elevated CO2 increases Aphis glycines (Hemiptera: Aphididae) population growth. Insect Science, 18, 419–425. [Google Scholar]
- Ort DR, Long SP (2014) Limits on yields in the corn belt. Science, 344, 483–484. [DOI] [PubMed] [Google Scholar]
- Prentice IC, Farquahar GD, Fasham MJR et al (2001) The carbon cycle and atmospheric carbon dioxide In: Climate Change 2001: The Scientific Basis. Contribution of Working Group I to the Third Assessment Report of the Intergovernmental Panel on Climate Change (eds Houghton JT, Ding Y, Griggs DJ, et al), pp. 183–230. Cambridge University Press, Cambridge, MA. [Google Scholar]
- Quijano JC, Kumar P, Drewry DT, Goldstein A, Misson L (2012) Competitive and mutualistic dependencies in multispecies vegetation dynamics enabled by hydraulic redistribution. Water Resources Research, 48, W05518. [Google Scholar]
- Ray DK, Ramankutty N, Mueller ND, West PC, Foley JA (2012) Recent patterns of crop yield growth and stagnation. Nature Communications, 3, 1293. [DOI] [PubMed] [Google Scholar]
- Ray DK, Mueller ND, West PC, Foley JA (2013) Yield trends are insufficient to double global crop production by 2050. PLoS ONE, 8, e66428. [DOI] [PMC free article] [PubMed] [Google Scholar]
- Richards RA (1983) Manipulation of leaf area and its effect on grain yield in droughted wheat. Australian Journal of Agricultural Research, 34, 23–31. [Google Scholar]
- Rogers A, Gibon Y, Stitt M, Morgan PB, Bernacchi CJ, Ort DR, Long SP (2006) Increased C availability at elevated carbon dioxide concentration improves N assimilation in a legume. Plant Cell and Environment, 29, 1651–1658. [DOI] [PubMed] [Google Scholar]
- Schroeder JB, Gray ME, Ratcliffe ST, Estes RE, Long SP (2006) Effects of elevated CO2 and O3 on a variant of the western corn rootworm (Coleoptera: Chrysomelidae). Environmental Entomology, 35, 637–644. [Google Scholar]
- Solomon S, Qin D, Manning M et al (2007) Climate change 2007: the Physical Science Basis. Contribution of Working Group I to the Fourth Assessment Report of the Intergovernmental Panel on Climate Change. Summary for Policymakers. 18 pp.
- Spitters CJT (1986) Separating the diffuse and direct component of global radiation and its implications for modeling canopy photosynthesis. 2 Calculation of canopy photosynthesis. Agricultural and Forest Meteorology, 38, 231–242. [Google Scholar]
- Srinivasan V, Kumar P (2015) Emergent and divergent resilience behavior in catastrophic shift systems. Ecological Modeling, 298, 87–105. [Google Scholar]
- Strzepek K, Boehlert B (2010) Competition for water for the food system. Philosophical Transactions of the Royal Society B‐Biological Sciences, 365, 2927–2940. [DOI] [PMC free article] [PubMed] [Google Scholar]
- Tilman D, Clark M (2015) Food, agriculture & the environment: can we feed the world and save the earth? Daedalus, 144, 8–23. [Google Scholar]
- Vanloocke A, Bernacchi CJ, Twine TE (2010) The impacts of Miscanthus giganteus production on the Midwest US hydrologic cycle. GCB Bioenergy, 2, 180–191. [Google Scholar]
- Walker BJ, VanLoocke A, Bernacchi CJ, Ort DR (2016) The costs of photorespiration to food production now and in the future. Annual Review of Plant Biology, 67, 107–129. [DOI] [PubMed] [Google Scholar]
- Welles JM, Norman JM (1991) Instrument for indirect measurement of canopy architecture. Agronomy Journal, 83, 818–825. [Google Scholar]
- Zavala JA, Casteel CL, DeLucia EH, Berenbaum MR (2008) Anthropogenic increase in carbon dioxide compromises plant defense against invasive insects. Proceedings of the National Academy of Sciences of the United States of America, 105, 5129–5133. [DOI] [PMC free article] [PubMed] [Google Scholar]
- Zhang XA, Cai XM (2011) Climate change impacts on global agricultural land availability. Environmental Research Letters, 6, 014014. [Google Scholar]
- Zhang T, Yang X, Wang H, Li Y, Ye Q (2014) Climatic and technological ceilings for Chinese rice stagnation based on yield gaps and yield trend pattern analysis. Global Change Biology, 20, 1289–1298. [DOI] [PubMed] [Google Scholar]
- Zhu XG, Long SP, Ort DR (2010) Improving photosynthetic efficiency for greater yield. Annual Review of Plant Biology, 61, 235–261. [DOI] [PubMed] [Google Scholar]
Associated Data
This section collects any data citations, data availability statements, or supplementary materials included in this article.
Supplementary Materials
Figure S1. Vertical distribution of leaf nitrogen (and hence V cmax,25) in soybean canopies.
Figure S2. SoyFACE weather data for year 2010 (black line) with average (grey line) and ±1 SE (shaded grey region) across 9 years (2002–2010).
Figure S3. Estimated leaf tissue construction carbon costs, as a function of LAI in soybean plant canopies under current and elevated [CO2] (550 ppm).
FigureS4.Predicted variation in total photosynthetic canopy uptake of CO2 (GPP), respiratory efflux (Respiration) and the net of these (NPP) as a function of LAI in current (solid lines) and elevated (dashed lines) [CO2].
Figure S5. Individual and combined predicted contributions of average sunlit and shaded leaves to canopy NPP over a 24 h period as a function of LAI.
Figure S6. Shading in soybean canopies.
Figure S7. Predicted total crop transpiration as a function of LAI.