

Abstract
The molecular mechanisms by which heterogeneity, a major characteristic of stem cells, is achieved are yet unclear. We here study the expression of the membrane stem cell antigen‐1 (Sca‐1) in mouse bone marrow mesenchymal stem cell (MSC) clones. We show that subpopulations with varying Sca‐1 expression profiles regenerate the Sca‐1 profile of the mother population within a few days. However, after extensive replication in vitro, the expression profiles shift to lower values and the regeneration time increases. Study of the promoter of Ly6a unravels that the expression level of Sca‐1 is related to the promoter occupancy by the activating histone mark H3K4me3. We demonstrate that these findings can be consistently explained by a computational model that considers positive feedback between promoter H3K4me3 modification and gene transcription. This feedback implicates bistable epigenetic states which the cells occupy with an age‐dependent frequency due to persistent histone (de‐)modification. Our results provide evidence that MSC heterogeneity, and presumably that of other stem cells, is associated with bistable epigenetic states and suggest that MSCs are subject to permanent state fluctuations. Stem Cells 2017;35:694–704
Keywords: Mesenchymal stem cells, Epigenetics, Aging, FACS, Methylation
Significance Statement.
In our study, we integrate diverse aspects of stem cell biology as the regeneration of parental stem cell diversity, the loss of stem cell properties with time in culture, and the control of gene expression at the promoter level by epigenetic marks in a multiscale computational model. Based on the assumption of bistable epigenetic states, this model describes the broad and heterogeneous distribution of the stem cell antigen Sca‐1 in mesenchymal stem cell clones. Moreover, it consistently explains both the fast regeneration of Sca‐1 marker profiles and their long‐term drifts with time in culture.
Introduction
Stem cell populations, even when studied at the clonal level, are heterogeneous with respect to their membrane phenotype, transcriptome, metabolome, and epigenome 1, 2, 3. This heterogeneity attracts increasing interest since its functional relevance has been demonstrated in pioneering studies 4. Currently, it is considered a major barrier to clinical translation of stem cell therapies 5. Nongenetic heterogeneity has been shown to have both extrinsic and intrinsic sources 6. Extrinsic sources are straightforward, being related to the variability of the cellular environments stem cells are able to home to. Intrinsic sources are more difficult to pinpoint. Previously, we hypothesized that they are related to the limited cellular capability to inherit epigenetic states 7. This hypothesis has been substantiated by computational modeling of age‐related epigenetic drifts 8 and is in agreement with experimental findings on embryonic stem cells 9. In the following we focus on intrinsic heterogeneity while investigating in vitro expanding bone marrow mesenchymal stem cells (MSCs).
Bone marrow MSCs have been described, both in humans and in mice, as multipotent stem cells for the mesenchyme (osteoblasts, chondrocytes, adipocytes), and, being anti‐inflammatory and anti‐apoptotic, they are widely used in a number of cell therapy protocols 10, 11, 12. MSCs are phenotypically characterized by a number of membrane antigens. While many antigens are commonly expressed by human and mouse MSCs, the stem cell antigen 1 (Sca‐1) is specific to mouse. It is a GPI‐linked cell surface protein encoded by the Ly6a gene found on a 500 kb locus on chromosome 15 encoding several other Ly6 genes. Sca‐1 is expressed by a wide variety of stem cells, including hematopoietic stem cells (HSCs) and MSCs, where it may act as a coregulator of lipid raft signaling 13. Sca‐1−/− mice display age‐related osteoporosis that may be due in part to reduced MSC self‐renewal 14, 15. During expansion of MSCs, changes of their transcriptome, epigenome and proteome have been observed 16, 17, 18. These changes, commonly summarized as ageing, are associated with a functional decline 19. Accumulation of such age‐related modifications in vitro has been demonstrated to be a continuous process 20, 21. In vivo studies suggest partial overlap of the cellular and molecular changes of MSCs during ageing with those observed during in vitro expansion 16, 22, 23.
A basic question regarding stem cell markers, such as Sca‐1, is whether populations of cells with defined marker expression are able to regenerate the expression heterogeneity of their mother population. Related experiments can provide deep insights into the degree of cell lineage determination and the flexibility of fate decisions 24. Regeneration of population heterogeneity has been first studied in a hematopoietic progenitor cell line 25. Subpopulations of cells from this cell line have been shown to regenerate expression profiles of Sca‐1 within days.
Here, we experimentally analyze the in vitro regenerative potential of primary murine bone marrow‐derived MSCs regarding Sca‐1 expression profiles. We show that subpopulations of these cells with varying Sca‐1 expression profile can regenerate within a few days the Sca‐1 expression profile of their mother population. However, during prolonged expansion the expression profiles of the MSC populations change, and their regeneration capability becomes limited. We find that all expression differences between Sca‐1 populations are accompanied by differences of the epigenetic state of the Ly6a promoter. We apply a computational model of epigenetic regulation of gene expression recently introduced by us 8, 26, to provide a mechanistic explanation of our experimental observations. We simulate gene expression in individual cells of expanding cell populations and compare the results with our experimental findings on the population level. Based on our results, we suggest MSC heterogeneity to be associated with bistable epigenetic states.
Materials and Methods
Culture of Mouse Bone Marrow MSCs
To assess the frequency of MSCs in primary culture, we performed limiting dilution assay. Cells from primary layers were distributed in 96‐well plates containing 200 µl of growth medium with graded cell densities (0.5, 1, 2, 5, and 10 cell(s) per well) using FACS DiVa Flow Cytometer and Cell Sorter (Becton Dickinson, Franklin Lakes, NJ, www.bd.com). Cells were allowed to adhere overnight, excess medium was then removed and cells were maintained under normal culture conditions for 20 days. The percentage of negative wells was plotted against the number of cells per well. The MSC frequency was estimated according to Poisson's distribution.
To generate single cell‐derived clones from primary layers, we used one of two methods. To generate clones using cloning rings (C‐clones), cells from primary layers were seeded at 100 cells/cm2. Isolated cells were identified after overnight adherence. When colonies developed from these single cells contained about 50 cells (usually at day 8), cells in a cloning ring were detached by 0.05% trypsin/ethylenediaminetetraacetic acid (EDTA) and seeded in 96‐well plates with growth medium. After 3 days, cells were transferred into 6‐well plates and thereafter amplified in T25 and T75 flasks. To generate clones using cell sorting (AC‐clones), single cells from primary layers were distributed using FACS DiVa in 96‐well plates containing 200 μl of growth medium (one cell per well). Cells were allowed to adhere overnight, excess medium was removed and cells were maintained under proliferative culture conditions. Cells of sub‐confluent layers were detached with trypsin and placed in 6‐well plates then amplified in T25 and T75 flasks. More information about MSC isolation and differentiation studies can be found in the Supporting Information S1.
Flow Cytometry
Cells were detached using 0.05% trypsin‐EDTA, recovered by centrifugation at 300 g for 5 minutes at 4°C, washed twice in PBS and re‐suspended at concentration of 105 cells per microgram antibody. Antibodies used were phycoerythrin (PE)‐ or fluorescein isothiocyanate (FITC)‐conjugated rat anti‐mouse monoclonal antibodies CD11b (clone M1/70), CD45 (clone A20), Sca‐1 (clone 13‐161.7), CD90 (clone OX‐7) purchased from BD Biosciences (Becton Dickinson, Franklin Lakes, NJ, www.bd.com), and CD105 (clone 209701) purchased from R&D systems (R&D Systems, Minneapolis, MN, www.rndsystems.com). Negative controls were APC‐, PE‐ or FITC‐conjugated rat anti‐mouse IgG of the same isotype as antibodies. Cells were incubated in the dark at 4°C for 30 minutes. Cells were then washed twice with PBS and fixed with 1% paraformaldehyde in phosphate‐buffered saline (PBS). Signal acquisition of fluorescence was performed using FACS‐Scan cytometer or Accuri C6 Flow Cytometer (Becton Dickinson, Franklin Lakes, NJ, www.bd.com). FACS analyses were carried out using Weasel or CFlow‐plus software, depending on the flow cytometer.
Fluorescence‐activated cell sorting (FACS)
Cells from clones were subjected to cell sorting according to Sca‐1 antigen expression level. Cells were detached and labeled as described above. Three clearly discriminated subpopulations with low, moderate, and high expression level of Sca‐1 protein were sorted (Sca1‐L, Sca1‐M, and Sca1‐H subpopulations). Cells were then seeded at 105 cells/cm2 and grown under usual conditions. Sca‐1 protein expression level was evaluated at different time points as indicated in the text. Aliquots of each subpopulation and of the nonsorted population of origin were sacrificed and cells were stained as described above.
Gene Expression Analysis
RNA was extracted from 36 samples, corresponding to three independent clones. RNA was isolated using RNeasy Mini kit with DNase I digestion (Qiagen, Hilden, Germany, www.qiagen.com). Quality control was assessed using the Agilent Bioanalyzer (Agilent Technologies, Santa Clara, CA, www.agilent.com) and NanoDrop spectrophotometer ND‐1000A (Thermo Fisher Scientific, Waltham, MA, www.thermofisher.com). Genome‐wide gene expression profiling was performed by hybridization on oligonucleotide microarrays (Mouse Gene 1.0 ST) according to standards supplied by the manufacturer (Affymetrix, Santa Clara, CA, www.affymetrix.com). Initially, data were normalized using RMA (Robust Microarray Analysis) algorithm. Data were then transformed in log2 in order to linearize and to bring signal distribution to a Gaussian.
Chromatin Immunoprecipitation of H3K4me3 and H3K27me3
Chromatin immunoprecipitation (ChIP) assays were performed as described earlier 27 with the following minor modifications: Chromatin for ChIP was prepared from sorted MSCs by fixing the cells in 0.5% formaldehyde for 5 minutes in PBS, followed by quenching with 125 mM glycine for 5 minutes. Fragmentation of isolated chromatin was performed in the water bath of a Bioruptor sonicator (Diagenode, Seraing, Belgium, www.diagenode.com) for 20 minutes (30 seconds on/30 seconds off) at 4°C. DNA from approximately 0.5 x 10⁶ cells was used in each immunoprecipitation with the following antibodies: Anti‐Histone H3 (tri methyl K4) antibody (Abcam, Cambridge, UK, www.abcam.com, ab8580) and Anti‐Histone H3 (tri methyl K27) antibody (Abcam, Cambridge, UK, www.abcam.com, ab6002). Normal rabbit IgG (Cell Signaling, Leiden, Netherlands, www.cellsignal.com, #3900) were used as a control for nonspecific signals. qPCR was then carried out using the Absolute qPCR SYBR Green Mix kit (Thermo Fisher Scientific; Darmstadt, Germany, www.thermofisher.com, #AB‐1159/A) with the following primers: mLy6a‐ChIP‐for, 5′‐ CCA TTG TGT GCC CAG TAC C‐3′, mLy6a‐ChIP‐rev, 5′‐ CTG AGC TCC ACG TGT CCT TT‐3′ mGAPDHS‐ChIP‐for, 5′'‐ CTT CTG GAG AGT GGG CTG AG‐3′, mGAPDHS‐ChIP‐rev,5′‐ ACG TCT CGA CAT GGC CTA AG‐3. Product amplification was carried out with an annealing temperature of 60°C for 50 cycles using 1 µl of DNA solution as template in the real‐time PCR cycler Rotor‐Gene (Corbett Research, Cambridgeshire, UK, www.corbettlifescience.com). All PCR results were normalized to input controls.
Analysis of DNA Methylation
Genomic DNA was extracted from fresh MSCs by applying standard proteinase K digestion followed by the QIAamp DNA Mini Kit (Qiagen, Hilden, Germany, www.qiagen.com). Genomic DNA was then subjected to bisulfite conversion with the EZ DNA Methylation‐Lightning Kit (Zymo Research, Freiburg, Germany, www.zymoresearch.com). Two rounds of bisulfite PCRs were performed with the following primer: mLy6a‐bs‐outer‐for, 5′‐AAG GAG GGT TAT TGG TTT TGA GTT ATT G‐3′, mLy6a‐bs‐outer‐rev, 5′‐AAA ATA ACA AAA TTT ATT TAT AAC CTA ATC AAA CCA‐3′, mLy6a‐bs‐inner‐for, 5′‐TTT TAT TTA GAT ATA GAA AAA AGT TAG GTA GTG‐3′, mLy6a‐bs‐inner‐rev, 5′‐CCA AAT TTA TAA CAA TTA AAA AAA AAC CAT AAT AC‐3′. The PCR products of the nested PCR were subjected to direct sequencing with the inner PCR primers (IZKF Leipzig core unit).
Results
Generation of MSC Clones from Bone Marrow of C57Bl6 Mice
We generated a large number of MSC clones from P3‐P4 primary cultures (Fig. 1A). The cloning efficiency, as calculated in limiting dilution experiments, was 1 per 2‐4 plated cells (Fig. 1B). To limit the occurrence of transformation, a relatively frequent event during the culture of mouse MSCs 28, primary layer and clone growth was carefully monitored to insure steady growth without cell crises; cells were passaged when layers were subconfluent and were seeded at a constant density of 105 cells/cm2. All clones were negative for CD45 and CD11b and positive for CD73, CD90, CD105, and Sca‐1 (Fig. 1C). Moreover, all clones expressed the intermediate filaments vimentin and nestin, but did not express transcripts for telomerase reverse transcriptase (Tert), nor for the pluripotency genes Nanog, Pou5f1, and Sox2. The clones grew with an average effective doubling time of 22.8 ± 1.5 hours (mean ± SEM, n = 14).
Figure 1.
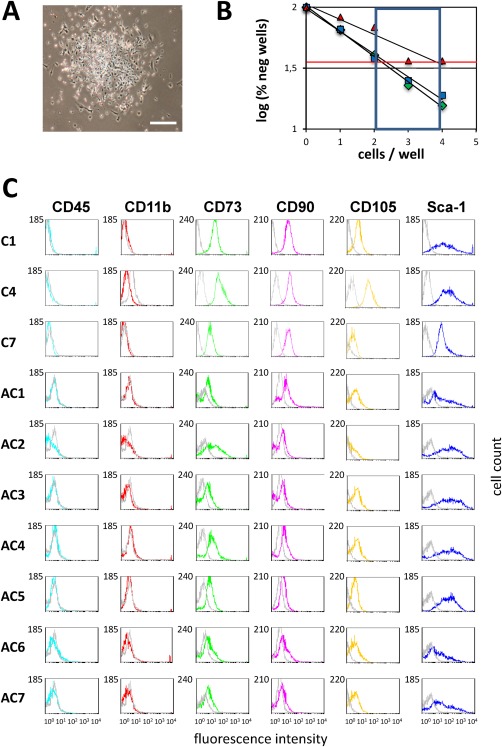
Generation of mesenchymal stem cell (MSC) clones. (A): MSC clone at day 7 of expansion (bar: 100µm). (B): Cloning efficiency of MSCs. Shown are the results of three different limiting dilution experiments. The red line corresponds to 37% of wells without clone growth. (C): Phenotype of the MSC clones (10 clones). Gray lines are negative controls.
We consistently differentiated the clones into adipocytes, osteoblasts and chondrocytes after culture in adipogenic, osteogenic, and chondrogenic conditions (see Supporting Information S1 and Fig. S1). QRT‐PCR studies indicated that many markers of the adipocytic, osteoblastic, and chondrocytic lineages were expressed at day 0, which is indicative of the already reported mesenchymal lineage priming of the cells 29. These markers were increased while others were induced in cells differentiated in vitro by day 3 and/or day 15.
Regeneration of Clone‐Specific Sca‐1 Expression Profiles Is Consistent with a Model of Noise‐Driven MSC Differentiation
Phenotyping of clones for canonical surface markers showed interclonal heterogeneity. In particular, Sca‐1 was expressed with profiles characteristic of each clone (Fig. 1C). These clone‐specific profiles remained largely stable during expansion over 28‐42 days (passage 4‐6 (P4‐P6)). We selected three well‐growing clones (C1, AC3, and AC5) to sort subpopulations of Sca‐1H, Sca‐1M, and Sca‐1L cells characterized by high, middle, and low Sca‐1 expression, respectively. We selected nonoverlapping windows of Sca‐1 expression. An example of this sorting is shown for clone AC3 (P6) in Figure 2A. Subsequently, we asked whether these subpopulations would regenerate the Sca‐1 distribution of their mother population (WCP: whole cell population).
Figure 2.
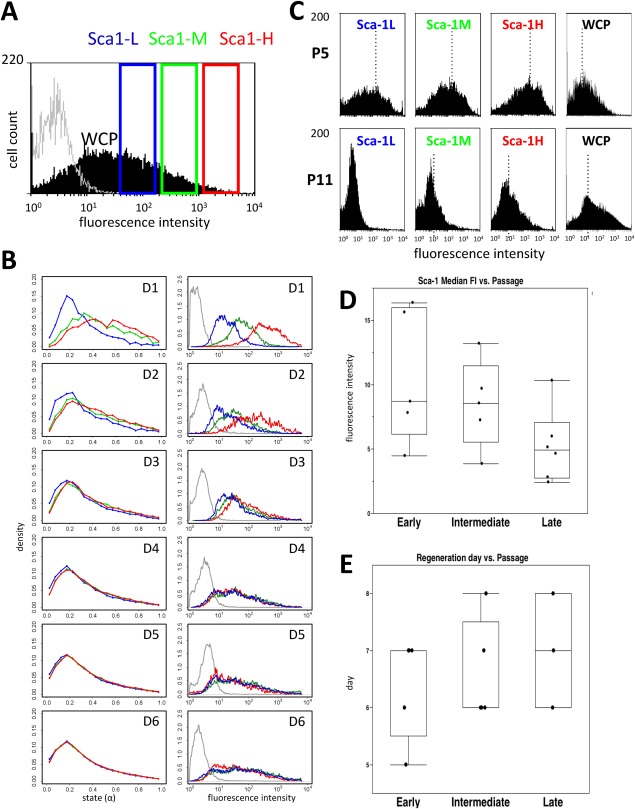
Regeneration of Sca‐1 expression at the population level. (A): Characteristics of cell sorting as applied to clone AC3 at P6. The Sca‐1 profile of the mother population is shown in black and that of the isotype control in gray. The sorting gate for Sca1‐L is indicated in blue, for Sca1‐M in green and for Sca1‐H in red. (B): Results of in silico (left panel) and in vitro (right panel) marker regeneration studies. Compared are the changes of the marker expression state α and the Sca‐1 fluorescence profiles, respectively. Shown are all sorted subpopulations at day 1‐6 (D1‐D6) of subsequent culture. Colors as in A. (C–E): Regeneration after prolonged clonal expansion. (C) Comparison of regenerated Sca‐1 fluorescence profiles (clone AC5). Compared are profiles obtained at P5 with those at P11. Shown are all subpopulations (L, M and H) and the mother population WCP at day 6 after sorting. The median fluorescence channel is indicated by a dotted line. (D) Sca‐1 median fluorescence (related to that of the isotype control) measured in early‐ (P5 and P6), intermediate‐ (P7 and P8) and late passage (P9‐P12) cells. Box plots are shown with first and third quartiles and mean value; error bar is SD. (E) Time span required for successful regeneration for early‐, intermediate‐ and late‐passage (P9‐P12) cells. For late‐passage cells, only 3 points out of 6 are shown since in 3 cases regeneration was not observed within the time frame of the experiments (10 days). Abbreviations: Sca‐1, stem cell antigen 1; WCP, whole cell population.
In a previous work, we developed a computer model of MSC populations based on the concept of noise‐driven differentiation 30. In this model, each cell is characterized by its differentiation state, which is quantified by a marker expression level α ∈ {0,1}. Cell states undergo permanent changes according to fluctuations in the expression of α, with state‐specific amplitudes. We used the model to simulate marker regeneration after sorting a cell population with respect to α. On the left panel of Figure 2B, we show the results of such a simulation applying the parameter set defined in the previous study. Shown is the time course of the normalized distribution of α. Assuming that α correlates with the log‐expression of Sca‐1, this model predicts marker regeneration on a time scale of a few days based on frequent state fluctuations.
In order to experimentally validate this prediction, we cultured the sorted Sca‐1 subpopulations under the same conditions and continued their expansion for up to 10 days. In these cultures we examined the distribution of the Sca‐1 expression over time. The characteristic Sca‐1 profiles observed in the mother clones were re‐established within about 4‐8 days within each subpopulation, that is, the fluorescence profiles of the subpopulations that were strikingly distinct at early time points after sorting tended to merge and get similar to that of the nonseparated mother population WCP at later times. The time course of the expression profiles for the Sca‐1H, Sca‐1M, and Sca‐1L subpopulations from clone AC3 at passage 6 (P6) is shown on Figure 2B, right panel. Similar regeneration profiles were found for other P5 and P6 clones. The comparison of the left to the right panel shows a good agreement between the in silico study (left) and the in vitro data (right).
Taken together, the data show that low‐passage MSC clones exhibit Sca‐1 heterogeneity that regenerates as a seemingly intrinsic property from subpopulations expressing widely different levels of Sca‐1.
Sca‐1 Expression and Regeneration Time Are Affected During Prolonged In Vitro Expansion
After performing the regeneration experiments with P4‐P6 clones we investigated whether the observed regenerative potential of MSC clones is conserved during long‐term in vitro expansion (up to P12). Actually, we observed an increasing skew of all Sca‐1 distributions toward low values of Sca‐1 expression with increasing passage number. However, the subpopulations still displayed regenerative potential, that is, the distribution of Sca‐1 expression in these subpopulations approached that of the mother population, but with progressively increased regeneration time in old compared to young cells. Figure 2C shows an example of early‐passage (P5) young cells (upper panel) versus late‐passage (P11) old cells (lower panel) for clone AC5. For 16 experiments carried out on the clones AC3, AC5 and C1, Figure 2D shows that the Sca‐1 median fluorescence intensity steadily decreases from early‐ [P5‐P6, ∼32 Population Doublings (PDs)] to intermediate‐ (P7‐P8, ∼34 PDs) and late‐passage (P9‐P12, ≥38 PDs) cells. On the contrary, Figure 2E shows that the time of regeneration increases with the number of passages. Moreover, regeneration was not obtained within the maximal time span of the experiments (10 days) in 3 of the 6 samples cultured for more than 8 passages.
In sum, these results implicate that the skewing of Sca‐1 profiles with passage number does not originate simply in a decreasing number of cells with high regenerative potential but is related to effective, intrinsic changes in the regulatory state of the cells. The data suggest that clone‐specific Sca‐1 expression profiles are affected by age. However, the molecular basis of these changes remains unclear. A phenomenological model of noise‐driven MSC differentiation as applied above can consider such changes 31, but cannot explain them.
Differential Gene Expression in Sca‐1 Subpopulations
To investigate the consequences of Sca‐1 sorting for expression at the genome‐wide level, we performed microarray analyses. We compared gene expression profiles of Sca‐1H, Sca‐1M, Sca‐1L subpopulations with that of their mother population WCP using cells at P8 (AC5), P9 (AC3), and P12 (C1). To visualize the effect of Sca‐1 sorting, we generated self‐organizing maps (SOMs) of all populations directly after sorting. A typical gallery of SOM‐portraits is shown for clone C1 in Figure 3A, details are given in Supporting Information S2. Each of the images portrays the expression state of the respective population. Genes that show similar expression behavior across the considered populations become associated with the same or with neighbored so‐called meta‐genes. Thus, in each portrait they form characteristic red and blue over‐ and under‐expression “spots.” Portraits of the different populations show different spots indicating differential gene expression [43].
Figure 3.
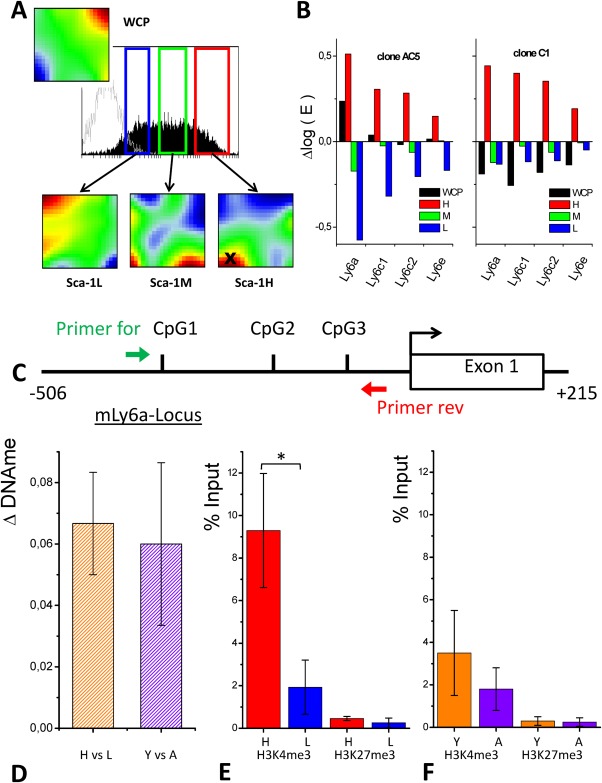
Molecular characterization of Sca‐1 subpopulations. (A): Sorting characteristics and self‐organizing maps (SOMs)‐portraits of Sca‐1 subpopulations of clone C1 at P12, immediately after sorting. The SOM portraits of each subpopulation show specific over‐ and under‐expression spots in red and blue, respectively. They are different compared to those observed for the mother population WCP. X indicates the over‐expression spot containing the Ly6 cluster. (B): Differential expression of Ly6 genes (Ly6a, Ly6c1, Ly6c2, Ly6e) genes in the WCP and the L, M and H populations. ΔlogE denotes the expression centered with respect to mean gene expression of the gene in all samples. (C): Structure of the Ly6a gene locus and location of the analyzed CpGs (For: forward; Rev: reverse outer primers). (D–F): Epigenetic states of the Ly6a promoter (n = 3, error bars: SEM). (D) The DNA methylation level of the analyzed CpGs is stable. Changes (ΔDNAme) comparing Sca‐1H (H) and Sca‐1L (L) as well as young (Y) and aged (A) cells are small. (E, F) The H3K4me3 modification level of the promoter correlates with the gene expression. (E) It is higher in Sca‐1H compared to Sca‐1L subpopulations and F) higher in young (P3) WCPs compared to aged (P13) WCPs. The H3K27me3 modification level was low regardless of Sca‐1 sorting and age (* = 0.05, t test). Abbreviations: Sca‐1, stem cell antigen 1; WCP, whole cell population.
Most Ly6 cluster genes (Ly6a, Ly6c1, Ly6c2, Ly6e) were associated with the high expression spot X of Sca1‐H, confirming successful sorting (Fig. 3B). Note that Ly6 expression in Sca1‐T is above average expression in clone AC5 (P8) and below that threshold in C1 (P12) in agreement with the observed skew of Sca‐1 expression in higher passages. The whole gallery of SOM portraits for the selected 3 clones (mother and subpopulations) at 3 time points is shown in the Supporting Information Fig. S2). Comparing gene expression immediately after sorting in all subpopulations of all 3 clones, we found strong clone‐specific expression. Differences between all pairs of clones were larger than the differences due to Sca‐1 sorting. In particular, AC5 showed a very specific expression profile compared with clones AC3 and C1. Moreover, we found substantial changes in gene expression within the first 5 days of regeneration, again being larger than those induced by cell sorting.
Taken together, our data indicate that Sca‐1 expression in a clonal population discriminates cells with different gene expression profiles. Strong clone specific differences in gene expression do not affect Sca‐1 regeneration.
Sca‐1 Expression Is Related to the Epigenetic Status of the Ly6a Promoter
Expression of genes has been shown to be associated with the activating histone mark H3K4me3 at their promoters 32, and flexible changes of expression to be associated with a bivalent state including both H3K4me3 and the repressive mark H3K27me3 33. Moreover, epigenetic states, in particular DNA methylation, have been found to drift with age 7, 34. Thus, we considered epigenetic regulation to represent a candidate mechanism that can explain the observed age‐related skews of the Sca‐1 profiles.
Using ChIP, we investigated whether the H3K4me3 and the H3K27me3 marks were associated with the Ly6a gene promoter. In addition, we quantified the methylation level of CpGs associated with the Ly6a promoter. Figure 3C shows the structure of the Ly6a gene and the position of the primers and of the CpGs selected for analysis.
CpG density is low at the promoter of Ly6a since this region does contain only a few well‐separated individual CpGs and not a single CpG island. Using bisulfite conversion, we analyzed three of the individual CpGs in close neighborhood to the transcription start site in Sca‐1H versus Sca‐1L populations. We found that two of these CpGs were methylated while the other one was un‐methylated. The methylation state did neither depend on the expression level of Sca‐1 nor on the passage number. Actually, at all time points measured the DNA methylation state remained similar (ΔDNAme∼ 6%, Fig. 3D).
In contrast, the Ly6a promoter of Sca‐1H versus Sca‐1L cells was significantly (p < .05) enriched in the H3K4me3 mark (Fig. 3E). Moreover, the Ly6a promoter was also enriched in this activating mark in Sca‐1 population (WCP) in early‐passage versus late‐passage cells (Fig. 3F). H3K27me3 was found poorly associated with the Ly6a promoter whatever the cell population.
To address the question as to whether the enrichment in the H3K4me3 mark was specifically found in the promoter of Ly6a in Sca‐1H cells, we investigated the promoter status of other recognized MSC markers. We were particularly interested in the markers whose expression was increased or decreased in Sca‐1H compared to Sca‐1L cells, that is, CD105, CD146, CD44 and CD140a (Supporting Information S3, Fig. S3A). We did not observe significant enrichment of the H3K4me3 mark in the promoter region of any of these markers (Supporting Information Fig. S3B). Moreover, the H3K27me3 mark was found as poorly associated with the newly studied markers as with Ly6a (Supporting Information Fig. S3C). Taken together the data indicate that sorting for Sca‐1 was not associated with a widespread increase in the H3K4me3 signal.
Bistable Epigenetic States Control Sca‐1 Expression
To explain the dynamics of the Sca‐1 profiles in accordance with the epigenetic states of the Ly6a promoter, we resorted to a computational model of epigenetic regulation recently developed by us 8, 26. In comparison to our phenomenological, noise‐driven model of MSC populations 30, this model describes stem cell populations, the individual cells of which can adopt individual expression profiles of genes being part of a transcription factor network. These genes are encoded by an artificial genome which at the same time associates each of them with a promoter region of gene‐specific length and structure 35. Gene expression dynamics are controlled by transcription factors binding to the promoter and by the epigenetic state of the promoter. Thereby, the model considers epigenetic regulation by activating H3K4me3 marks and by methylation of promoter CpGs. Here, we built on the model version that includes a positive feedback between gene expression and H3K4me3 modification of the promoter 36. Details can be found in Supporting Information S4. The applied parameter set is given in Supporting Information Table S2.
To adapt the model to our present data, we made two assumptions regarding the Ly6a gene. First, we assumed that in case of the Ly6a gene the given positive feedback between H3K4me3 and gene expression is strong enough to establish a bistable regulatory state. That means the expression of the Ly6a model gene can switch between a high‐expressing state associated with high H3K4me3 and a low‐expressing state associated with low H3K4me3. Second, we assumed that age‐related changes of Ly6a expression originate from a reduced activation of this gene by the upstream transcription factor network, being the consequence of the limited stability of histone modification states of the promoters associated with genes of the upstream network (Fig. 4A, upper panel). The reduced transcriptional activation of the gene results in a lower expression state and, in parallel, renders the low expression state more stable. As a consequence, the bistability of the Ly6a expression state might even vanish (Fig. 4A, lower panel).
Figure 4.
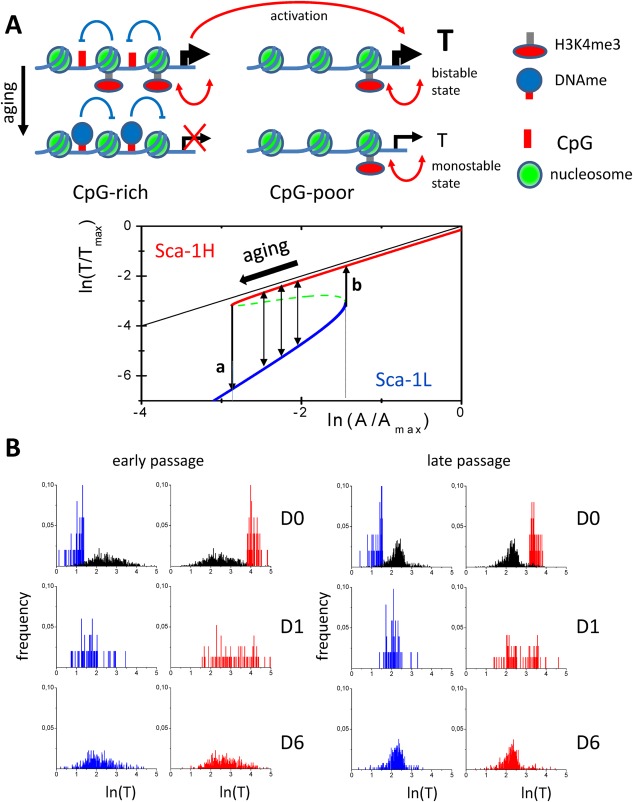
Model of bistable epigenetic states of the Ly6a promoter. (A): Upper panel: General regulatory principles. For genes with high promoter CpG density age‐related promoter hyper‐methylation results in a reduced transcriptional activation (left). These changes affect also the expression of genes showing no age‐related promoter methylation changes. In case of the Ly6a model gene, we assumed that they induce a reduced transcriptional activation (right). Lower Panel: Ly6a specific regulatory principles. Shown is the expression T of the Ly6a model gene, scaled by its maximum Tmax, in dependence to the activation A (scaled by Amax) of the gene by the underlying transcription factor network. In the bistable region switches between high (red) and low (blue) expression states occur due to stochastic H3K4me3 (de‐) modification reactions (thin arrows). The dashed green line represents instable solutions for T. If A falls below the threshold “a” the system shows monostable Sca‐1L behavior. If A increases above the threshold “b” the system shows monostable Sca‐1H behavior. Aging results in a shift to lower activation A. The thin black line represents the solution without the effects of H3K4me3. (B): Simulated Sca‐1 expression profiles applying the epigenetic model. Shown are profiles immediately after sorting (D0) and after 1 and 6 days of regeneration (D1, D6). The example compares regeneration for early and late passages, that is, after 2 and 7 weeks of cell expansion, respectively. Left panel: At early passages a broad distribution of expression levels of the Ly6a model gene is observed within the mother cell population (black). This distribution completely regenerates within 6 days both for low‐expressing (blue) and high‐expressing cells (red). Right panel: In late passages, the high expression state is less stable and accordingly the distribution of expression levels narrows. Regeneration still occurs, but does not reestablish the distribution of early passages. Abbreviation: Sca‐1, stem cell antigen 1.
For each simulation, we selected—in accordance with the two assumptions given above—the Ly6a model gene out of the genes encoded by the artificial genome and studied its expression dynamics. We started analyzing the expression of the Ly6a model gene in 1,000 cells that were expanded for a defined time. Sorting of low and high expressing subpopulations was then modeled by selecting the 50 cells with the lowest and the 50 cells with the highest expression of this gene, respectively. Subsequently, we followed their expression dynamics. Finally, we compared the regeneration of gene expression profiles within the two growing subpopulations in dependence of the age of the mother population. Figure 4B shows the results of such a simulation comparing the regeneration of cells expanded for about 2 weeks (early passage) and 7 weeks (late passage). Here, the late passage mother population originates from the early passage one following simulation of prolonged expansion. We found that indeed our simulation studies reproduced the two major features of our experimental results on Sca‐1 regeneration, that is, (a) fast regeneration of quasi‐stationary expression profiles and (b) age‐related skews of the expression.
Importantly, in our simulations, regeneration of gene expression within a few days requires fast histone modification reactions, enabling fast switches between low and high expression states on a time scale shorter than the cell cycle time. Subpopulations that show switches in the Ly6a regulatory states on a larger time scale do not achieve regeneration within a week.
Discussion
This work integrates diverse aspects of stem cell biology as the regeneration of parental stem cell diversity, the loss of stem cell properties with time in culture, and the control of gene expression at the promoter level by epigenetic marks in a multiscale computational model. Based on the assumption of bi‐stabile epigenetic states, this model describes the broad and heterogeneous distribution of the stem cell antigen Sca‐1 in MSC clones and consistently explains our experimental findings on both the fast regeneration of Sca‐1 marker profiles by short‐term fluctuations and their long‐term drifts with time in culture. The model uniquely associates thermodynamic parameters describing association rates of epigenetic factors to gene promoters, kinetic parameters describing changes in promoter activity and parameters indicative of cell proliferation. The values of the parameters have been adjusted to our present results on MSC heterogeneity at the level of the Sca‐1/Ly6a promoter, but may be modulated according to other stem cell markers, stem cell populations or experimental conditions. Since heterogeneity is a major stem cell attribute, we expect that our model may apply to many other stem cell systems. Moreover, as the model assumes no mouse specific mechanisms, we expect that similar regulation might apply also to human stem cell systems.
Assuming a strict hierarchy from stem to differentiated cells (see recent example for HSCs 37), stem cells are often considered as unique cell entities characterized by their capacity to maintain an adequate balance between self‐renewal and commitment. In parallel, differentiation that proceeds through a succession of compartments, each made homogeneously of phenotypically defined cells is envisioned as an irreversible process 38, 39. Applying such a model to the present study would imply a differentiation gradient according to the Sca‐1 expression, that is, Sca‐1H cells would constitute a compartment made of cells more immature than Sca‐1L cells. With time in culture Sca‐1H would yield Sca‐1L, but not the converse. This scenario is not consistent with our experimental findings.
In the present situation, regeneration of the subpopulations regardless of the expressed levels of Sca‐1 suggest that stem cell markers, as Sca‐1, are simply markers of a particular regulatory state that can be accessed and left and that the in‐between‐cell variation of their expression reflects these fluctuations. This scenario is in agreement with the concept of noise‐driven cell differentiation, which was previously applied by our group to HSCs 24, and MSCs 30. Applying this model, it was possible to simulate our present results on the regeneration of the subpopulations of early‐passage clones, thus supporting the major hypothesis of this model that cell differentiation is driven by random state fluctuations. However, our study shows substantial modifications in clones expanded for a long time in culture, as skewing to the left of the Sca‐1 profiles. Such drifts are well known from studies on replicative ageing 20. The noise‐driven differentiation model can consider this kind of effect introducing clonal age as an additional parameter 31. Here, we provided a possible molecular explanation for it.
Our transcriptome studies did unravel strong clonal differences in the gene expression profiles of subpopulations during the first days of in vitro culture after sorting. This indicates that the regeneration of the Sca‐1 profiles does not foretell of regeneration at the transcriptome‐wide level. In that respect, our study differs from that of Chang et al. who carried out similar cell fractionation according to the Sca‐1 profile, but using an immutable hematopoietic progenitor cell line 25. The discrepancy may be related to the use in our study of clones generated from primary cell layers and expanded for varying culture times. However, our data are in keeping with another report that does not confirm the evidence of transcriptome‐wide fluctuation when analyzing individual cells of the hematopoietic progenitor cell line 40.
Different levels of gene expression have been related to modifications of the epigenetic status of the gene promoters, conforming to a general model of gene regulation in mammalian development 41. In the present work, we confirm such a relation between the expression state of Sca‐1 and the modification level of the promoter of the Ly6a gene by the activating H3K4me3 mark in MSCs. On the contrary, we did not find noticeable expression‐related modification in the repressive H3K27me3 mark or in the DNA methylation of the promoter, the latter being found, for example, in embryonic stem cells 9. Coming back to the noise‐driven differentiation model made explicit above, our results suggest fluctuations in Sca‐1 expression levels to be caused by fluctuations in H3K4me3 levels at the Ly6a promoter. Such fluctuations are expected in case of bistable modification states.
Bistable regulatory states represent a typical feature of our model of epigenetic control of gene expression 8, 26. They have been used to explain epigenetic drifts during stem cell ageing 8 and age‐related changes of DNA methylation 36. Here, we have refined our computational model to ascertain whether it can consistently explain the regeneration dynamics of the Sca‐1 profiles and the changes of the epigenetic status of the Ly6a promoter observed during prolonged MSC clone expansion assuming a bistable regulatory state of Ly6a.
Our simulation results were broadly congruent with our experimental data, which led to two conclusions. First, it implies that broad marker distributions as observed for Sca‐1 are the result of fast switches between bistable regulatory states due to persistent histone (de‐) modification reactions. Notably, the time scales of these switches between the modification states of Sca‐1 in the model agree with those observed experimentally for re‐establishing H3K4me3 after its dilution during cell division 42. Secondly, it implies that for genes with CpG‐poor promoters, as the Ly6a gene, age‐related changes of their expression originate from a decrease in the activation of the genes by transcription factors. Such a decrease, even if it is small, results not only in a modified distribution of the gene expression but can potentially induce a switch from a bistable to a monostable low expression state. Thus, it might be associated with an effective loss of stemness.
The clinical implications of our work are twofold. First, our results suggest that sorting of stem cell populations with respect to gene expression of markers such as Sca‐1 will enrich more or less efficiently specific clones, but will not provide subpopulations with specific expression of a stem cell marker. Whether such reduction of the polyclonality of the stem cell material achieved through sorting is beneficial for clinical applications probably depends on the actual age of the sorted clones, which requires further analysis. Second, our study provides a computational model allowing to study the effects of epigenetic compounds enabling stem cell rejuvenation through cell‐intrinsic mechanisms.
Conclusion
In conclusion, our model can explain both the regeneration dynamics and the change in epigenetic status of the stem cell marker Sca‐1, assuming that the Ly6a gene, encoding for this marker, is affected by age‐related drifts in gene regulation. Such drifts may result from age‐related aberrant DNA methylation throughout the genome, which subsequently affects, as suggested here, sensitive bistable circuits downstream of the targeted transcription factors. We expect a genome‐wide search for such kind of association to shed new light on age‐related stem cell deregulation.
Author Contributions
P.C. and J.G.: Study concept and design; Z.H., K.R., and D.C.: Acquisition of data; Z.H., K.R., L.H., H.B., P.C., and J.G. Analysis and interpretation of data; J.P., A.K., and J.G.: Model design and simulation; C.F., A.S., and H.B.: Technical support; P.C. and J.G.: Drafting of the manuscript.
Disclosure of Potential Conflicts of Interest
The authors indicate no potential conflict of interest.
Supporting information
Supporting Information
Acknowledgments
The study was supported by the BMBF grants HNPCC‐Sys (Grant Number: 031 6065A) and INDRA (Grant Number: 031A312) and by the DFG grant SPP1463 (Grant Number GA637/4‐1). Work was further supported by a grant from Institute National du Cancer (INCA project “Bortes”) and by a grant from the European Community (contract No 223236, project “Cascade”, FP7). Z.H. has been supported in part by a grant from ANRB. We thank Maria Herberg for support regarding the design of Figure 2 and for helpful discussion.
This article was published online on 08 November 2016. An error was subsequently identified in the Significance Statement. This notice is included in the online and print versions to indicate that both have been corrected 29 December 2016.
References
- 1. Martinez Arias A, Brickman JM. Gene expression heterogeneities in embryonic stem cell populations: Origin and function. Curr Opin Cell Biol 2011;23:650. [DOI] [PubMed] [Google Scholar]
- 2. Rubakhin SS, Romanova EV, Nemes P et al. Profiling metabolites and peptides in single cells. Nat Methods 2011;8:S20–S29. [DOI] [PMC free article] [PubMed] [Google Scholar]
- 3. Glauche I, Bystrykh L, Eaves C et al. Stem cell clonality ‐ Theoretical concepts, experimental techniques, and clinical challenges. Blood Cells Mol Dis 2013;50:232–240. [DOI] [PubMed] [Google Scholar]
- 4. Brock A, Chang H, Huang S. Non‐genetic heterogeneity–a mutation‐independent driving force for the somatic evolution of tumours. Nat Rev Genet 2009;10:336–342. [DOI] [PubMed] [Google Scholar]
- 5. Viswanathan S, Keating A, Deans R et al. Soliciting strategies for developing cell‐based reference materials to advance mesenchymal stromal cell research and clinical translation. Stem Cells Dev 2014;23:1157–1167. [DOI] [PMC free article] [PubMed] [Google Scholar]
- 6. Huang S. Non‐genetic heterogeneity of cells in development: More than just noise. Development 2009;136:3853–3862. [DOI] [PMC free article] [PubMed] [Google Scholar]
- 7. Przybilla J, Galle J, Rohlf T. Is adult stem cell aging driven by conflicting modes of chromatin remodeling? Bioessays 2012;34:841–848. [DOI] [PubMed] [Google Scholar]
- 8. Przybilla J, Rohlf T, Loeffler M et al. Understanding epigenetic changes in aging stem cells–a computational model approach. Aging Cell 2014;13:320–328. [DOI] [PMC free article] [PubMed] [Google Scholar]
- 9. Singer ZS, Yong J, Tischler J et al. Dynamic heterogeneity and DNA methylation in embryonic stem cells. Mol Cell 2014;55:319–331. [DOI] [PMC free article] [PubMed] [Google Scholar]
- 10. Charbord P. Bone marrow mesenchymal stem cells: Historical overview and concepts. Human Gene Ther 2010;21:1045–1056. [DOI] [PMC free article] [PubMed] [Google Scholar]
- 11. Frenette PS, Pinho S, Lucas D et al. Mesenchymal stem cell: Keystone of the hematopoietic stem cell niche and a stepping‐stone for regenerative medicine. Ann Rev Immunol 2013;31:285–316. [DOI] [PubMed] [Google Scholar]
- 12. Singer NG, Caplan AI. Mesenchymal stem cells: Mechanisms of inflammation. Ann Rev Path 2011;6:457–478. [DOI] [PubMed] [Google Scholar]
- 13. Holmes C, Stanford WL. Concise review: Stem cell antigen‐1: Expression, function, and enigma. Stem Cells 2007;25:1339–1347. [DOI] [PubMed] [Google Scholar]
- 14. Bonyadi M, Waldman SD, Liu D et al. Mesenchymal progenitor self‐renewal deficiency leads to age‐dependent osteoporosis in Sca‐1/Ly‐6A null mice. Proc Natl Acad Sci USA 2003;100:5840–5845. [DOI] [PMC free article] [PubMed] [Google Scholar]
- 15. Holmes C, Khan TS, Owen C et al. Longitudinal analysis of mesenchymal progenitors and bone quality in the stem cell antigen‐1‐null osteoporotic mouse. J Bone Miner Res 2007;22:1373–1386. [DOI] [PubMed] [Google Scholar]
- 16. Geissler S, Textor M, Kühnisch J et al. Functional comparison of chronological and in vitro aging: Differential role of the cytoskeleton and mitochondria in mesenchymal stromal cells. PLoS One 2012;7:e52700. [DOI] [PMC free article] [PubMed] [Google Scholar]
- 17. Schellenberg A, Lin Q, Schüler H et al. Replicative senescence of mesenchymal stem cells causes DNA‐methylation changes which correlate with repressive histone marks. Aging (Albany NY) 2011;3:873–888. [DOI] [PMC free article] [PubMed] [Google Scholar]
- 18. Noer A, Lindeman LC, Collas P. Histone H3 modifications associated with differentiation and long‐term culture of mesenchymal adipose stem cells. Stem Cells Dev 2009;18:725–736. [DOI] [PubMed] [Google Scholar]
- 19. Stolzing A, Scutt A. Age‐related impairment of mesenchymal progenitor cell function. Aging Cell 2006;5:213–224. [DOI] [PubMed] [Google Scholar]
- 20. Wagner W, Horn P, Castoldi M et al. Replicative senescence of mesenchymal stem cells: A continuous and organized process. PLoS One 2008;3:e2213. [DOI] [PMC free article] [PubMed] [Google Scholar]
- 21. Stolzing A, Jones E, McGonagle D et al. Age‐related changes in human bone marrow‐derived mesenchymal stem cells: Consequences for cell therapies. Mech Ageing Dev 2008;129:163–173. [DOI] [PubMed] [Google Scholar]
- 22. Wagner W, Bork S, Horn P et al. Aging and replicative senescence have related effects on human stem and progenitor cells. PLoS One 2009;4:e5846. [DOI] [PMC free article] [PubMed] [Google Scholar]
- 23. Kretlow JD, Jin YQ, Liu W et al. Donor age and cell passage affects differentiation potential of murine bone marrow‐derived stem cells. BMC Cell Biol 2008;9:60. [DOI] [PMC free article] [PubMed] [Google Scholar]
- 24. Hoffmann M, Chang HH, Huang S et al. Noise‐driven stem cell and progenitor population dynamics. PLoS One 2008;3:e2922. [DOI] [PMC free article] [PubMed] [Google Scholar]
- 25. Chang HH, Hemberg M, Barahona M et al. Transcriptome‐wide noise controls lineage choice in mammalian progenitor cells. Nature 2008;453:544–547. [DOI] [PMC free article] [PubMed] [Google Scholar]
- 26. Binder H, Steiner L, Przybilla J et al. Transcriptional regulation by histone modifications: Towards a theory of chromatin re‐organization during stem cell differentiation. Phys Biol 2013;10:026006. [DOI] [PubMed] [Google Scholar]
- 27. Lupp S, Gumhold C, Ampofo E et al. CK2 kinase activity but not its binding to CK2 promoter regions is implicated in the regulation of CK2alpha and CK2beta gene expressions. Mol Cell Biochem 2013;384:71–82. [DOI] [PubMed] [Google Scholar]
- 28. Miura M, Miura Y, Padilla‐Nash HM et al. Accumulated chromosomal instability in murine bone marrow mesenchymal stem cells leads to malignant transformation. Stem Cells 2006;24:1095–1103. [DOI] [PubMed] [Google Scholar]
- 29. Delorme B, Ringe J, Pontikoglou C et al. Specific lineage‐priming of bone marrow mesenchymal stem cells provides the molecular framework for their plasticity. Stem Cells 2009;27:1142–1151. [DOI] [PubMed] [Google Scholar]
- 30. Krinner A, Hoffmann M, Loeffler M et al. Individual fates of mesenchymal stem cells in vitro. BMC Syst Biol 2010;4:73. [DOI] [PMC free article] [PubMed] [Google Scholar]
- 31. Galle J, Hoffmann M, Krinner A. Mesenchymal stem cell heterogeinity and ageing in vitro: A model approach. Stud Mechanobiol Tissue Eng Biomat 2013;10:183–205. [Google Scholar]
- 32. Guenther MG, Levine SS, Boyer LA et al. A chromatin landmark and transcription initiation at most promoters in human cells. Cell 2007;130:77–88. [DOI] [PMC free article] [PubMed] [Google Scholar]
- 33. Bernstein BE, Mikkelsen TS, Xie X et al. A bivalent chromatin structure marks key developmental genes in embryonic stem cells. Cell 2006;125:315–326. [DOI] [PubMed] [Google Scholar]
- 34. Teschendorff AE, West J, Beck S. Age‐associated epigenetic drift: Implications, and a case of epigenetic thrift? Hum Mol Genet 2013;22:R7–R15. [DOI] [PMC free article] [PubMed] [Google Scholar]
- 35. Binder H, Wirth H, Galle J. Gene expression density profiles characterize modes of genomic regulation: Theory and experiment. J Biotechnol 2010;149:98–114. [DOI] [PubMed] [Google Scholar]
- 36. Przybilla J, Buske P, Binder H et al. Histone modifications control DNA methylation profiles during ageing and tumour expansion. Front Life Sci 2013;7:31–43. [Google Scholar]
- 37. Doulatov S, Notta F, Laurenti E et al. Hematopoiesis: A human perspective. Cell Stem Cell 2012;10:120–136. [DOI] [PubMed] [Google Scholar]
- 38. Potten CS, Loeffler M. Stem cells: Attributes, cycles, spirals, pitfalls and uncertainties. Lessons for and from the crypt. Development 1990;110:1001–1020. [DOI] [PubMed] [Google Scholar]
- 39. Loeffler M, Potten CS. Stem cells and cellular pedigrees‐ A conceptual introduction In: Potten C, ed. Stem Cells. San Diego: Academic Press, 1997, pp. 1–27. [Google Scholar]
- 40. Pina C, Fugazza C, Tipping AJ et al. Inferring rules of lineage commitment in haematopoiesis. Nat Cell Biol 2012;14:287–294. [DOI] [PubMed] [Google Scholar]
- 41. Reik W. Stability and flexibility of epigenetic gene regulation in mammalian development. Nature 2007;447:425–432. [DOI] [PubMed] [Google Scholar]
- 42. Alabert C, Barth TK, Reverón‐Gómez N et al. Two distinct modes for propagation of histone PTMs across the cell cycle. Genes Dev 2015;29:585–590. [DOI] [PMC free article] [PubMed] [Google Scholar]
Associated Data
This section collects any data citations, data availability statements, or supplementary materials included in this article.
Supplementary Materials
Supporting Information