

Abstract
Aims
To determine whether the provision of contingency management using financial incentives to improve hepatitis B vaccine completion in people who inject drugs entering community treatment represents a cost‐effective use of health‐care resources.
Design
A probabilistic cost‐effectiveness analysis was conducted, using a decision‐tree to estimate the short‐term clinical and health‐care cost impact of the vaccination strategies, followed by a Markov process to evaluate the long‐term clinical consequences and costs associated with hepatitis B infection.
Settings and participants
Data on attendance to vaccination from a UK cluster randomized trial.
Intervention
Two contingency management options were examined in the trial: fixed versus escalating schedule financial incentives.
Measurement
Life‐time health‐care costs and quality‐adjusted life years discounted at 3.5% annually; incremental cost‐effectiveness ratios.
Findings
The resulting estimate for the incremental life‐time health‐care cost of the contingency management strategy versus usual care was £21.86 [95% confidence interval (CI) = –£12.20 to 39.86] per person offered the incentive. For 1000 people offered the incentive, the incremental reduction in numbers of hepatitis B infections avoided over their lifetime was estimated at 19 (95% CI = 8–30). The probabilistic incremental cost per quality adjusted life‐year gained of the contingency management programme was estimated to be £6738 (95% CI = £6297–7172), with an 89% probability of being considered cost‐effective at a threshold of £20 000 per quality‐adjusted life years gained (97.60% at £30 000).
Conclusions
Using financial incentives to increase hepatitis B vaccination completion in people who inject drugs could be a cost‐effective use of health‐care resources in the UK as long as the incidence remains above 1.2%.
Keywords: Contingency management, economic, incentives, injecting, methadone maintenance program, opiates, vaccination, viral hepatitis
Introduction
Many countries include universal hepatitis B virus (HBV) vaccination in their national immunization programmes 1. A few countries, including the United Kingdom, have selective vaccination policies that target individuals at increased risk of HBV infection or complications from the disease, including people who inject drugs or who live with injectors 2.
Despite these immunization programmes, HBV infections remain an important public health problem among people who inject drugs (PWID), even in many countries with universal HBV vaccination 3. In England and Wales, the prevalence of current or past infection with HBV (measured by anti‐HBc seropositivity) in current or past injectors has declined over the last 20 years from 30% in 2003 to 17% in 2012, due in part to the introduction of a national prison vaccination scheme in 2003 4, 5. Monitoring data indicate that among current and past injectors in contact with specialist services, the self‐reported hepatitis B vaccine uptake has increased from 50% in 2003 to 75% in 2012 4. Despite this improvement in the self‐reported vaccine uptake, completion rates of HBV vaccination among current and past injectors, even those using specialist services, remains low, and vaccine uptake has plateaued in recent years 4. Public health benefits from HBV vaccination are not therefore realized fully in PWID and transmission continues (albeit at lower levels), with ongoing potential for community outbreaks 6, 7. Reasons for low completion of HBV vaccinations in community settings include the poor adherence to treatment among PWID and a high dropout from health‐care services 8.
Contingency management has been proposed as an approach to improve patient adherence and completion of public health interventions among hard‐to‐reach groups, including HBV vaccination in PWID using community‐based services 9, 10. It uses incentives to encourage attendance, reduce missed appointments and improve successful intervention uptake 9. Studies conducted in Australia 11 and the United States 12, 13 showed significantly improved adherence and completion of HBV vaccination using contingency management in PWID. Similar findings were observed in the United Kingdom in a recent three‐arm cluster randomized controlled trial where PWID (including injectors, previous injectors and those at risk of injecting in the future) undergoing treatment for heroin dependence were randomized to either HBV vaccination with or without contingency management 14.
There have been no economic evaluations of the use of contingency management to enhance completion of HBV vaccination among PWID in routine drug treatment settings. This study evaluates whether the provision of financial incentives to improve HBV vaccination completion in PWID as undertaken in Weaver et al. 14 represents a cost‐effective use of health‐care resources.
Methods
Model
A decision‐analytical model was constructed in Microsoft Excel comprising a decision‐tree to estimate the short‐term (i.e. around vaccination attempts) clinical and cost impact of the vaccination strategies, followed by a Markov chain to evaluate the long‐term clinical consequences and costs associated with HBV infection of a hypothetical cohort of PWID (including injectors, previous injectors and those at risk of injecting in the future as defined in the trial) undergoing treatment over the lifetime in England and Wales.
The decision‐analytical model compares two strategies: HBV vaccination with and without contingency management. Two contingency management options were examined in the trial (fixed versus escalating schedule financial incentives). Data from the two options evaluated in the trial were pooled in the economic model in the absence of differences 14. Further details on the trial and baseline characteristics of patients included in the trial are available in Weaver et al. 14.
The structure of the decision tree model is presented in Fig. 1, with participants able to attend or not attend one, two or all three ‘required’ vaccination appointments. At the end of the HBV vaccination attempt, subjects within the model can be vaccinated successfully (as a result of one, two or three vaccine doses), or remain susceptible to HBV (as a result of failing to begin vaccination, failing to complete the vaccination course or as a result of a lack of vaccine efficacy despite completing the course).
Figure 1.
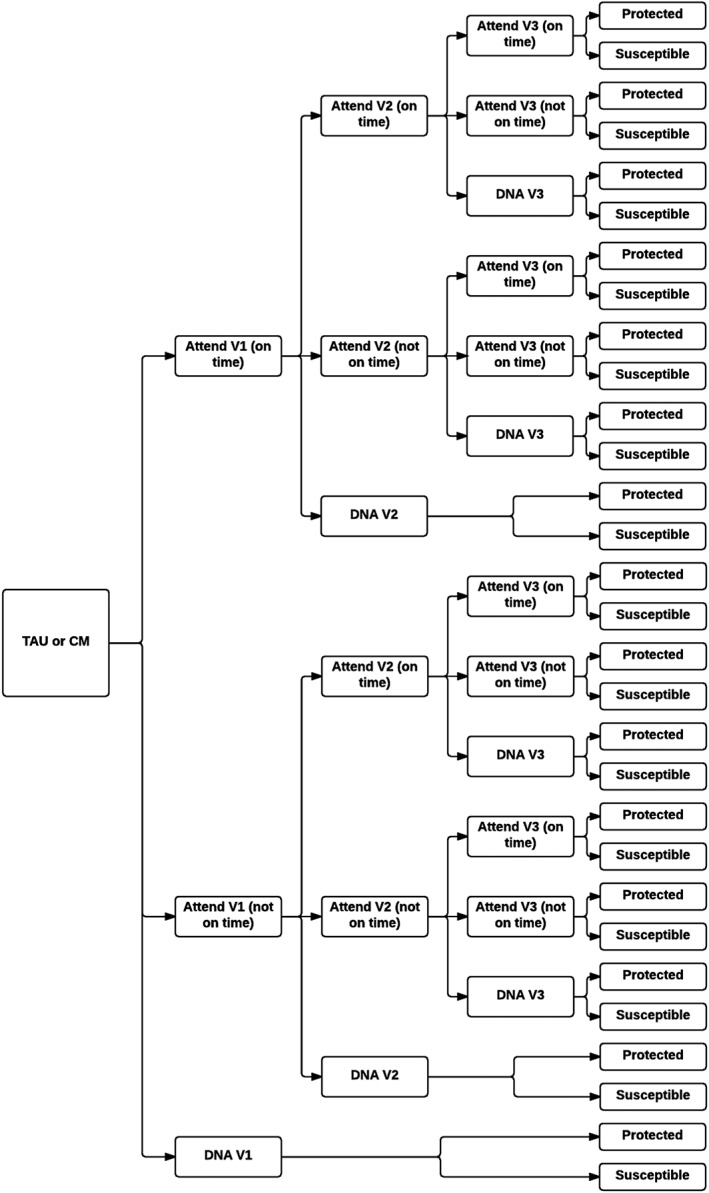
Decision tree model for hepatitis B vaccination strategies. Back circle represent a decision node. CM = contingency management; DNA = do not attend; TAU = treatment as usual; V1 = 1st vaccination appointment; V2 = 2nd vaccination appointment; V3 = 3rd vaccination appointment
A Markov process (Fig. 2), using a 1‐year cycle length, was used to simulate the long‐term clinical and cost consequences of HBV‐related infection. The model tracks progression through HBV disease states. Health states and transitions between health states were based on descriptions of the natural history of HBV infection in existing systematic reviews 15, 16, 17, 18 and on published economic models, including HBV 19, 20, 21, 22. The economic model differentiates periods where individuals are at increased risk of HBV infection (are in the PWID population) and where individuals at lower risk of HBV infection (are ex‐PWID). We assumed that individuals at increased risk of HBV infection have an ongoing rate of becoming immune to reflect the UK selective vaccination policy targeted to individuals at increased risk of HBV infection.
Figure 2.

Markov model of the long‐term natural history of HBV infection. Transition between health states. People can die from general causes (age‐specific) in any of the health states (not shown here). Boxes in grey indicate excess mortality. CC = compensated cirrhosis; CHB = chronic hepatitis; DC = decompensated cirrhosis; HBeAg = chronic hepatitis B e antigen; HBV = hepatitis B virus; HCC = hepatocellular carcinoma; LT = liver transplantation; PWID = people who inject drugs
HBV incidence
The incidence of HBV infection among susceptible PWID in the United Kingdom was estimated at 2.16% per year using data from the national Unlinked Anonymous Monitoring Survey among current and past injectors and an approach similar to Sutton et al. 23. Additional details are provided in the Supporting information.
Direct data informing the incidence of HBV among ex‐PWID are lacking, which could range from zero to be at the same level as in PWID. The base‐case assumes HBV infection incidence in ex‐PWID equals the general population incidence. General population HBV incidence was estimated at 4.08 per 100 000 using the annual incidence of reported acute hepatitis B in England 24 adjusted for under‐reporting and asymptomatic cases 21.
Characteristics of the PWID population
The rate at which individuals cease injecting drugs 25 was used as a proxy for the probability of leaving the PWID population and ceasing to be at high HBV infection risk (Table 1). PWID can also become protected through existing targeted vaccination programmes. We estimated this rate of vaccination using the prevalence of self‐reported HBV vaccine uptake among current and past injectors in 2011 (76% 4) and converting this into the annual probability of vaccination (28.8%), assuming a constant uptake prevalence and PWID population size. To account for partial protection in those reporting vaccination, we assumed that 47.5% of self‐reported vaccinations are successful (based on the distribution of vaccine dose given in prison 26 and evidence on the vaccine efficacy 27).
Table 1.
Model parameters used for annual transitions (unless stated) in the natural history Markov model.
| Base‐case | Lower range reported in the literature | Upper range reported in the literature | Source | |
|---|---|---|---|---|
| From ‘Susceptible PWID’ | ||||
| Probability of HBV infection | 2.16% | 1.76% | 2.67% | Estimated from a catalytic model |
| Probability of future protection± | 12.80% | Derived from 4, 25, 26, 27 | ||
| Probability of leaving PWID population | 9.09% | 5.00% | 16.67% | 25 |
| Remain susceptible—PWID | 75.95%c | |||
| From ‘Susceptible—ex‐PWID’ | ||||
| Probability of HBV infection | 0.0041% | 0%a | 2.16%b | Assumption |
| Remain in ‘Susceptible—ex‐PWID’ | 99.996c | |||
| Proportion of HBV infection that are acute, fulminant and chronic | ||||
| Proportion of HBV infection that are acute (non‐fulminant)d | 93.20%c | |||
| Proportion of HBV infection that are fulminantd | 0.55% | 0.30% | 0.80% | 21 |
| Proportion of HBV infection that are chronicd | 6.25% | 2.50% | 10.00% | 29 |
| From ‘Fulminant HBV’ | ||||
| Proportion undergoing liver transplantd | 13.50% | 10.00% | 17.00% | 20 |
| Proportion of excess deathd | 72.86% | Derived from 21 and 15 | ||
| Proportion of non‐fatal fulminant HBV not undergoing liver transplantd | 13.64%d | |||
| From ‘Chronic HBV (HBeAg+ve)’ | ||||
| Probability of seroconversion (CHB‐ve or inactive) | 11.50% | 8.00% | 15.00% | 15, 16, 17 |
| Proportion seroconvert to CHB‐ved | 15.00% | 10.00% | 20.00% | 15 |
| Probability of developing CC | 4.00% | 2.00% | 6.00% | 16, 17, 18 |
| Probability of developing HCC | 0.35% | 0.10% | 0.60% | [16,17] |
| Probability of excess death | 0.55% | 0.10% | 1.00% | 16 |
| Remain in chronic HBV (HBeAg+ve) | 80.10%c | |||
| From ‘Chronic HBV (HBeAg‐ve)’ | ||||
| Probability of developing CC | 9.00% | 8.00% | 10.00% | 18 |
| Probability of developing HCC | 0.66% | 0.01% | 1.30% | 17, 18 |
| Probability of excess death | 0.55% | 0.10% | 1.00% | 16, 17 |
| Remain in Chronic HBV (HBeAg‐ve) | 89.80%c | |||
| Chronic HBV (inactive) to: | ||||
| Probability of developing CC | 2.00% | 1.00% | 3.00% | 17, 18 |
| Probability of developing HCC | 0.11% | 0.02% | 0.20% | 17, 18 |
| Probability clear HbsAg | 1.25% | 0.50% | 2.00% | 15 |
| Probability of excess death | 0.03% | 0.02% | 0.04% | 17 |
| Remain in chronic HBV (HBeAg inactive) | 96.61%c | |||
| From ‘CC’ | ||||
| Probability of developing DC | 3.50% | 2.00% | 5.00% | 15, 16, 17, 18 |
| Probability of developing HCC | 2.85% | 2.00% | 3.70% | 15, 16, 17, 18 |
| Probability of excess death | 3.20% | 2.90% | 3.50% | 15, 16, 17 |
| Remain in CC | 90.50%d | |||
| From ‘DC’ | ||||
| Probability of developing HCC | 7.50% | 7.00% | 8.00% | 18 |
| Probability of undergoing LT | 4.40% | 3.40% | 5.40% | 20 |
| Probability of excess death | 35.00% | 20.00% | 50.00% | 18 |
| Remain in DC | 53.1%c | |||
| From ‘HCC’ | ||||
| Probability of undergoing LT | 1.70% | 1.50% | 1.90% | 20 |
| Probability of excess death | 35.00% | 20.00% | 50.00% | 18 |
| Remain in HCC | 63.30%c | |||
| From ‘LT’ | ||||
| Probability of excess death—first year | 21.00% | 15.00% | 27.00% | 22 |
| Probability of excess death—subsequent years | 5.00% | 3.00% | 7.00% | 22 |
assumption;
Assumed to be the same as people who inject drugs (PWID);
remaining probabilities (one minus probabilities above), ± calculated from self‐reported vaccination, leaving rate, number of vaccine dose received in prison and vaccine effectiveness;
proportion. HBV = hepatitis B virus; CHB = chronic hepatitis; LT = liver transplantation; CC = compensated cirrhosis; HCC = hepatocellular carcinoma; DC = decompensated cirrhosis; HBeAg = chronic hepatitis B e antigen.
The model accounts for elevated risk of all‐cause mortality [hazard ratio = 4.8; 95% confidence interval (CI) = 4.6–5.0] for people in contact with drug‐treatment services compared with the general population. The unadjusted mortality rate in the general population by age was from UK life tables for England and Wales 28.
Natural history of HBV
The transition probabilities characterizing the natural history of HBV were derived from the published literature (Table 1) 15, 16, 17, 18, 29. Lacking data for PWID, transitions between HBV health states among the general population were used.
Effectiveness of the vaccination strategies
The economic analysis uses data from Weaver et al. 14. The primary outcome in this trial was vaccination completion within 28 days. Attendance rates used in the economic model are presented in Table 2. To reflect clinical practice, we included delayed attendance (within a 3‐month window from the start of the trial). The same probability of attending a subsequent appointment was used irrespective of whether the previous vaccination was received on time.
Table 2.
Attendance at hepatitis B virus (HBV) vaccination appointments.
| Treatment as usual | CM | |||
|---|---|---|---|---|
| 1st vaccination appointment | ||||
| Expected to attend | 67 | 143 | ||
| Did not attend | 33 | 49% | 34 | 24% |
| Attended on time | 21 | 31% | 97 | 68% |
| Delayed attendance | 13 | 19% | 12 | 8.% |
| 2nd vaccination appointment | ||||
| Expected to attend | 31 | 105 | ||
| Did not attend | 8 | 26% | 13 | 12% |
| Attended on time | 15 | 48% | 84 | 80% |
| Delayed attendance | 8 | 26% | 8 | 8% |
| 3rd vaccination appointment | ||||
| Expected to attend | 22 | 85 | ||
| Did not attend | 8 | 36.% | 15 | 18% |
| Attended on time | 7 | 32% | 64 | 75% |
| Delayed attendance | 7 | 32% | 6 | 7% |
CM = contingency management. It should be noted that the number of individual expected to attend is different to the number of individuals who attended the previous round, as some individuals were already immune and therefore did not need to return for another vaccine dose.
Vaccine effectiveness
The effectiveness (seroprotection) associated with the receipt of one, two and three doses was obtained from the literature 27, as data were not collected routinely in the trial. In the economic model, we assumed that participants receiving one and three vaccine doses had a seroprotection of 15 and 76.4%, respectively 27, averaging these for individuals receiving two doses. We assumed that seroprotection was conferred after the last vaccine dose (one, two or three doses), that immunity is life‐long and that the last dose was within 3 months from the first. Adverse reactions to the vaccine are rare and were neglected 27.
Costs
A UK National Health Service perspective was employed, and therefore only direct medical costs are considered. Costs are discounted at 3.5% in the base‐case as per the National Institute for Health and Care Excellence recommendation in the United Kingdom 30.
Staff, equipment and supervision costs were calculated from the trial, based on data collected in 10 clinics for 116 patients enrolled into the trial irrespective of vaccination arm. The costs estimated include adjustment for staff time associated with non‐attendance. Staff plus equipment costs were estimated to be £15.68 ± 5.65 [standard deviation (SD)] for individuals attending no vaccination appointment, £69.29 ± 12.66 for individuals attending only one vaccination appointment, £98.91 ± 16.21 for individuals attending only two vaccination appointments and £112.35 ± 16.30 for individuals attending all three vaccination appointments. The cost of training staff for contingency management was excluded from the base‐case and the cost for Engerix (£12.99 per dose) 31 was assumed, as benefits associated with prevention of hepatitis A were not included. People receiving contingency management were assumed to receive a £10 voucher per vaccination appointment attendance. Finally, for participants who attended at a later date an additional cost was included for every unscheduled vaccination, equivalent to the cost associated with non‐attendance of the first vaccination appointment (£16).
In the economic model, PWID have a probability of vaccination through existing targeted programmes. A cost per patient of £82 was applied to participants receiving these vaccinations based on the proportion of patients receiving one, two or three doses in prison 26, assuming a cost of £29 for administration/preparation/administration per dose 32 (based on 30‐minute nurse time) and the cost per vaccine dose (£12.99 per dose) 31.
Direct medical costs associated with the management of HBV infection are taken from the literature and assumptions when appropriate (Supporting information, Table S1) 20, 22, 32, 33, 34.
Utilities
Health‐related quality of life scores (utilities) are assigned to each of the modelled health states based on trial estimates or published literature. The baseline health utility for uninfected PWID and ex‐PWID was estimated as 0.57 ± 0.34 (range = –0.43 to 1.00) based on the mean (SD) Euroqol 5 dimensions score in trial subjects. The decrements in quality of life for patients with active chronic HBV, inactive chronic HBV, compensated cirrhosis, decompensated cirrhosis, hepatocellular carcinoma and post‐liver transplant was taken from Ong et al. 35 in non‐PWID. Individuals with fulminant hepatitis were assumed to have the same decrement in quality of life as individuals with hepatocellular carcinoma. Similarly, the decrement in quality of life in the first year following transplantation was taken as mean of the decrement in quality of life for patients with hepatocellular carcinoma and post‐transplant patients (Supporting information, Table S2). We assumed that individuals with acute symptomatic hepatitis had a reduction in quality‐adjusted life years of 0.0255 (accounting for the duration of illness) 36 and no reduction in quality of life for individuals with asymptomatic hepatitis. Finally, no decrement in quality of life associated with vaccination was considered 27.
Analysis
Results are presented probabilistically to take account of the simultaneous effect of uncertainty relating to model parameter values. A total number of 1000 simulations were performed in order to provide sufficient information on uncertainty. The results of the probabilistic analysis are also presented as cost‐effectiveness planes and acceptability curves.
A number of one‐way sensitivity analyses were conducted. Results are presented in the form of a Tornado diagram.
Results
For 1000 people offered the incentive, we estimated the number of HBV infections to be 44, compared with 62 in the absence of financial incentives (reduction in numbers of HBV infections of 19; 95% CI = 8–30), based on our mathematical model under our base‐case assumptions.
The cost of delivering HBV vaccination (including staff costs, equipment, vaccine cost and cost associated with contingency management) was estimated to be £156.73 (95% CI = £126.44–181.17) per participant receiving the intervention and £78.36 (95% CI = £52.50–101.62) per participant under treatment as usual. The model predicted that 48. 77% (95% CI = 43.08–52.86%) of participants receiving contingency management would be protected against HBV infection, compared with 26.54% (95% CI = 19.36–32.65%) for treatment as usual.
Providing contingency management in the manner of the trial would lead to a small gain in life‐years (0.0045; 95% CI = 0.0017–0.0075) and quality‐adjusted life‐years (0.0032; 95% CI = 0.0013–0.0054) per patient, but at an increased cost (£21.86; 95% CI = –£12.20 to 39.86), despite the reduction in expected HBV management costs (−£53.34; 95% CI = –£96.24 to –33.88) over a life‐time.
Under our base‐case assumptions, the probabilistic incremental cost‐effectiveness ratio associated with the provision of modest financial incentives to increase vaccination completion in PWID in contact with specialist services was estimated to be £6738 (95% CI = £6297–7172) per quality‐adjusted life‐years gained using a life‐time horizon.
The economic analysis was most sensitive to the time horizon, the chronicity rate following HBV exposure, the duration individuals remain at increased risk of HBV infection (i.e. remain PWID), the incidence rate for HBV, discount rates for both costs and benefits and the cost associated with training/supervision (Fig. 3).
Figure 3.

Univariate sensitivity analysis (most sensitive parameters). White line represents the base‐case probabilistic incremental cost‐effectiveness ratio (ICER). CC = compensated cirrhosis; CM = contingency management; HBV = hepatitis B virus; PWID = people who inject drugs
A major uncertainty in the model relates to the incidence of HBV infection in England and Wales among PWID and ex‐PWID. In the base‐case we assumed the incidence in PWID to be approximately 2.16% (95% CI = 1.76–2.67%) based on results estimated from the Unlinked Anonymous Monitoring Survey. However, there is uncertainty around this value. Figure 4 shows that under our current base‐case assumptions (assuming the incidence of HBV in ex‐PWID to be the same as the general population), the incidence of HBV in PWID needs to be greater than 1.2% per year for the incremental cost per quality‐adjusted life years gained to fall below a cost‐effectiveness threshold of £20 000 per quality‐adjusted life years gained. The incremental cost per quality‐adjusted life years gained also improves as the incidence of HBV in ex‐PWID becomes closer to the incidence in PWID and may lead to cost‐savings (data not shown).
Figure 4.

Effect of varying the base‐case incidence of HBV infection in PWID on the incremental cost per QALY gained of CM versus TAU. The blue solid line represents the incremental cost‐effectiveness ratio (ICER) for CM compared with TAU assuming different incidence of Hepatitis B. The black dashed line represents the £20 000 per QALY gained WTP threshold. CM = contingency management; HBV = hepatitis B virus; QALY = quality adjusted life years; TAU = treatment as usual; WTP = willingness to pay
The cost‐effectiveness acceptability curve and cost‐effectiveness planes are presented in Fig. 5a,b). The use of contingency management have 88.51 and 97.60% probabilities of being considered cost‐effective at a willingness to pay of £20 000 and 30 000 per quality‐adjusted life years gained, respectively, under our base‐case assumptions.
Figure 5.

(a) Cost‐effectiveness acceptability curves for the probability that CM is more cost effective than usual care. The blue solid line represents the probability for CM to be cost‐effective at different WTP threshold. The red solid line represents the probability for TAU to be cost‐effective at different WTP threshold. (b) The black dashed line represents the £20 000 per QALY gained WTP threshold. Cost effectiveness plane for CM versus TAU. Solid points represent incremental cost and QALY results (intervention arm minus control arm) from the probabilistic analysis for each of the 1000 samples. The black dashed line represents the £20 000 per QALY gained WTP threshold. CM = contingency management; QALY = quality adjusted life years; TAU = treatment as usual; WTP = willingness to pay
Discussion
Contingency management using financial incentives to improve completion of hepatitis B vaccination in people injecting drugs entering community‐based services is likely to be cost‐effective under current willingness to pay 30. This is the first study to undertake an economic evaluation to calculate the cost‐effectiveness of providing contingency management—financial incentives—to PWID to enhance hepatitis B vaccination completion.
Key strengths of this study include that it is based on a well‐conducted cluster randomized controlled trial of contingency management versus treatment as usual in 12 specialist National Health Service (NHS) services providing opiate substitution treatment in England 14. The trial included direct measurement of the costs of delivering contingency management including staff time, equipment and consumables.
The best available evidence was used. The structure of the model follows the representation of the natural course of HBV in previous systematic reviews describing the natural history of HBV infection 15, 16, 17, 18 and previous economic evaluations 19, 20, 21, 22. The incidence of HBV was estimated from cross‐sectional survey data from the national Unlinked Anonymous Monitoring Survey, which provide robust estimates of prevalence trends of HBV infection and self‐reported vaccination among current and past injectors in the United Kingdom.
The generalizability of our results requires careful consideration. The United Kingdom does not have a programme of universal HBV vaccination. However, intensive targeted efforts in the United Kingdom have resulted in improved coverage of HBV vaccination among PWID, and while the cohorts vaccinated at birth in countries that did implement universal programmes may now be approaching the age of first injection, coverage may be lowest among those most likely to inject. Similar trials conducted in Australia 11 and the United States 12, 13 showed that it is possible to improve adherence to and completion of HBV vaccination programmes significantly using contingency management.
Another key factor in generalizability is the existing rate of HBV incidence. Studies conducted in other countries such as Australia, the United States and the Netherlands report a HBV incidence in current and past injectors ranging between 1.8 and 30.7 per 100 person‐years 37, but these studies are dated. There is also likely to be large subnational variation. However, our sensitivity analysis suggests that the incremental cost‐effectiveness ratio (ICER) would fall below £20 000 per QALY gained when the incidence of HBV in PWID is more than 1.20% per year.
As with any economic evaluation, there are some limitations. There are uncertainties on the future probability for a susceptible PWID to be reached by current targeted vaccination programme in England and Wales, the duration individuals remain at increased risk of HBV infection and the risk of HBV infection among ex‐PWID. It is also difficult to predict seroprotection in this patient group, as some PWIDs are protected after one vaccination and some are not even after three doses. There is also uncertainty concerning the efficacy of incomplete vaccine course and the time to protection. Decrements in utilities associated with hepatitis B were taken from non‐UK data among non‐PWID data. PWID may experience different decrements in quality of life due to high propensity for comorbidities. Transitions between HBV health states among PWID were also taken from studies conducted in cohorts that did not entirely comprise PWID. In order not to overestimate the benefits of vaccination, we allowed for life‐course reductions in risk of HBV infection by introducing an ex‐PWID state. In the absence of specific data for this group, we conservatively assumed the risk of HBV infection among ex‐PWID to be the same as the general population. In reality, ex‐PWID may have higher exposure to HBV than the general population, e.g. due to recommencing injecting or sexual transmission.
In the trial, contingency management was shown to increase vaccination completion rapidity, therefore reducing the period at risk of infection. This is not captured in the economic model. Similarly, attendance at scheduled appointments was increased in patients receiving the intervention, which may therefore reduce the work‐load in clinic and increase efficiency and therefore may lead to a reduction in costs.
Further development of the modelling approach could consider secondary transmission (dynamic/transmission modelling) of HBV and the indirect effect of vaccination (herd immunity). The modelling presented here also does not consider outbreaks or co‐infection associated with hepatitis A, hepatitis C and human immunodeficiency virus.
Our work suggests that further research is needed to determine whether ex‐PWID carry the same risk as PWID. Further research is also required to understand the dynamics of PWID and secondary transmission as well as the natural history in PWID and impact of hepatitis B on quality of life.
The central implication of our study for practice is that contingency management should be considered seriously as a worthwhile additional investment to improve health outcomes. The United Kingdom has seen a sustained programme to improve HBV vaccination coverage in high‐risk groups, including offering HBV vaccination in syringe exchanges and prisons. Contingency management is not a replacement for these efforts, but was able to additional benefits in a cost‐effective manner. Provision of lower financial incentives may potentially be as effective, and determining the optimal incentive would be advantageous. In the trial, attendance at the first vaccination appointment was not different between the two strategies (75.4 versus 76.9%), despite different financial incentives (£5 versus 10) 14.
Wider use of contingency management will require guidance and monitoring. In clinical practice, people may not be screened so thoroughly for eligibility, resulting in more doses given to people with previous immunity. PWID may also not disclose their vaccination status to be eligible to receive the financial incentives. This has some cost implications, as more doses may be given, but it is unclear whether the additional cost is outweighed by the benefits. In practice, it is advised to take blood when possible and give a vaccine dose if uncertain of someone's protective immunity.
This economic evaluation examined only the provision of HBV vaccination. Some sites in the trial offered a bivalent vaccine providing protection for both HBV and hepatitis A, at little extra cost. The demonstrated malleability of health‐adherence behaviours in this population could potentially be leveraged to boost other interventions for little extra cost, e.g. hepatitis C virus testing. If provided in parallel to HBV vaccination, or even as stand‐alone interventions with contingency management, might lead to more PWID tested for hepatitis C virus coming back to get their results, and more of those testing positive then entering a hepatitis C virus care pathway. Evaluation of such combined strategies will require additional research.
Finally, it is unclear whether results are transferable to other injectors, notably people who inject image and performance drugs. 38.
Conclusions
This is the first economic evaluation examining the cost‐effectiveness of providing contingency management using financial incentives to PWID in contact with specialist services in order to enhance hepatitis B vaccination completion. We find that using contingency management to increase vaccination completion among this group is cost‐effective under current willingness to pay thresholds. However, there are considerable uncertainties that need fuller attention in future studies, notably the paucity of evidence on the incidence of HBV infection incidence and the likelihood of PWID being reached by existing targeted vaccination programmes such as prison vaccination in the future. The intervention is likely to be more cost‐effective in settings with higher risk of HBV infection or if the occurrence of outbreaks is considered.
Declaration of interests
J.S. has contributed to UK guidelines, which include consideration of the potential role of contingency management in the management of opiate addiction (NICE, 2007; chaired by J.S.), and J.S. also chaired the broader‐scope pan‐UK working group preparing the 2007 Orange Guidelines for the UK Departments of Health, providing guidance on management and treatment of drug dependence and misuse, including guidance on possible inclusion of contingency management and is also currently chairing the new Expert Group updating these Guidelines for the four UK Departments of Health. J.S. and J.S.'s institution have received support and funding from the Department of Health (England) and National Treatment Agency (England), and J.S. and J.S.'s institution have provided funded consultancy advice on possible novel addiction treatments, products and formulations to a range of pharmaceutical companies, but these do not have any connection to the intervention being investigated nor the analyses in this paper. J.S.'s employer (King's College London) has registered intellectual property on a novel buccal naloxone with which J.S. is involved, and J.S. has been named in a patent registration by a pharmaceutical company as inventor of a potential novel concentrated nasal spray, but these do not have any connection to the work being reported in this paper. A fuller account of J.S.'s interests is on his personal web‐page of the Addictions Department at http://www.kcl.ac.uk/ioppn/depts/addictions/people/hod.aspx. J.S. is supported by the National Institute for Health Research (NIHR) Biomedical Research Centre for Mental Health at South London and Maudsley NHS Foundation Trust and King's College London.
Supporting information
Table S1 Management costs associated with hepatitis B virus (HBV) infection in each state of the Markov model.
Table S2 Mean utility weights and decrement in utility associated with hepatitis B virus (HBV) infection (against baseline).
Supporting info item
Acknowledgements
This paper presents independent research funded by the National Institute for Health Research (NIHR) under its Programme Grants for Applied Research Programme (Grant Reference no. RP‐PG‐0707‐10 149). The views expressed are those of the authors and not necessarily those of the NHS, the NIHR, Public Health England or the Department of Health. J.M.H. and J.S. are supported in part by the NIHR Biomedical Research Centre for Mental Health at South London and Maudsley NHS Foundation Trust and King's College London. The trial was supported by the Mental Health Research Network.
The Trial Team
Professor John Strang, Dr Nicola Metrebian, Vikki Charles (National Addiction Centre, King's College London), Dr Tim Weaver, Dilkushi Poovendran (Middlesex University), Professor Stephen Pilling, Nicholas Little (University College London), Professor Sarah Byford, Hiong Tie, Jennifer Hellier, Caroline Murphy (Institute of Psychiatry, Kings College London), Dr Luke Mitcheson, Mark Allen (South London and Maudsley NHS Foundation Trust), Dr William Shanahan, Dr Owen Bowden‐Jones (Central and North West London NHS Foundation Trust), Dr Ed Day (University of Birmingham and Birmingham and Solihull Mental Health NHS Trust), Dr Frank Ryan, Dr John Dunn (Camden and Islington NHS Trust), Dr Anthony Glasper (Sussex Partnership Trust), Dr Alan Brennan, Dr Petra Meier, Professor Mike Campbell, Rachid Rafia (School of Health and Related Research, University of Sheffield), Peter McDermott (The Alliance, National Drug User Group) and Professor Nancy Petry (University of Connecticut, USA).
Rafia, R. , Dodd, P. J. , Brennan, A. , Meier, P. S. , Hope, V. D. , Ncube, F. , Byford, S. , Tie, H. , Metrebian, N. , Hellier, J. , Weaver, T. , and Strang, J. (2016) An economic evaluation of contingency management for completion of hepatitis B vaccination in those on treatment for opiate dependence. Addiction, 111: 1616–1627. doi: 10.1111/add.13385.
[The copyright line for this article was changed on 26 January 2017 after original online publication.]
References
- 1. World Health Organization (WHO) . Hepatitis B. Fact Sheet no. 204. Geneva, Switzerland: WHO; 2014.
- 2. Hepatitis B: The Green Book, chapter 18. London: Public Health England; 2013.
- 3. Walsh N., Verster A., Doupe A., Vitoria M., Lo Y.‐R., Wiersma S. Chapter 3.1: The silent epidemic: Responding to viral hepatitis among people who inject drugs In: Cook C, editor. The Global State of Harm Reduction 2010. Key Issues for Broadening the Response. London: International Harm Reduction Association, 2010. ISBN 978–0‐9557754‐8‐2. Available at: http://www.ihra.net/files/2010/06/29/GlobalState2010_Web.pdf [accessed 22 April 2016]. [Google Scholar]
- 4. Health Protection Agency Health Protection Services and Microbiology Services Unlinked Anonymous Monitoring Survey of People Who Inject Drugs in Contact With Specialist Services: Data Tables, 2014. London: Health Protection Agency; 2014. [Google Scholar]
- 5. Judd A., Hickman M., Hope V. D., Sutton A. J., Stimson G. V., Ramsay M. E., et al. Twenty years of selective hepatitis B vaccination: is hepatitis B declining among injecting drug users in England and Wales? J Viral Hepatol 2007; 14: 584–91. [DOI] [PubMed] [Google Scholar]
- 6. Lamagni T. L., Hope V. D., Davison K. L., Parry J. V., Gill O. N. Failure to vaccinate current injecting drug users against hepatitis B in England and Wales. Commun Dis Public Health 2001; 4: 71–2. [PubMed] [Google Scholar]
- 7. Andersson M. I., Low N., Irish C. J., Verlander N. Q., Carrington D., Horner P., et al. Investigation of a large community‐based outbreak of hepatitis B infection in the United Kingdom. Epidemiol Infect 2012; 140: 47–57. [DOI] [PubMed] [Google Scholar]
- 8. Gossop M., Marsden J., Stewart D., Treacy S. Outcomes after methadone maintenance and methadone reduction treatments: two‐year follow‐up results from the National Treatment Outcome Research Study. Drug Alcohol Depend 2001; 62: 255–64. [DOI] [PubMed] [Google Scholar]
- 9. National Institute for Health and Care Excellence (NICE) . Drug Misuse: Psychosocial Interventions (CG51). London: National Institute for Health and Care Excellence; 2007.
- 10. Pilling S., Strang J., Gerada C. Psychosocial interventions and opioid detoxification for drug misuse: summary of NICE guidance. BMJ 2007; 335: 203–5. [DOI] [PMC free article] [PubMed] [Google Scholar]
- 11. Topp L., Day C. A., Wand H., Deacon R. M., van Beek I., Haber P. S., et al. A randomised controlled trial of financial incentives to increase hepatitis B vaccination completion among people who inject drugs in Australia. Prev Med 2013; 57: 297–303. [DOI] [PubMed] [Google Scholar]
- 12. Seal K. H., Kral A. H., Lorvick J., McNees A., Gee L., Edlin B. R. A randomized controlled trial of monetary incentives vs. outreach to enhance adherence to the hepatitis B vaccine series among injection drug users. Drug Alcohol Depend 2003; 71: 127–31. [DOI] [PubMed] [Google Scholar]
- 13. Stitzer M. L., Polk T., Bowles S., Kosten T. Drug users' adherence to a 6‐month vaccination protocol: effects of motivational incentives. Drug Alcohol Depend 2010; 107: 76–9. [DOI] [PMC free article] [PubMed] [Google Scholar]
- 14. Weaver T., Metrebian N., Hellier J., Pilling S., Charles V., Little N., et al. Use of contingency management incentives to improve completion of hepatitis B vaccination in people undergoing treatment for heroin dependence: a cluster randomised trial. Lancet 2014; 384: 153–63. [DOI] [PubMed] [Google Scholar]
- 15. McMahon B. J. The natural history of chronic hepatitis B virus infection. Hepatology 2009; 49: S45–55. [DOI] [PubMed] [Google Scholar]
- 16. Fattovich G. Natural history of hepatitis B. J Hepatol 2003; 39: S50–8. [DOI] [PubMed] [Google Scholar]
- 17. Fattovich G., Bortolotti F., Donato F. Natural history of chronic hepatitis B: special emphasis on disease progression and prognostic factors. J Hepatol 2008; 48: 335–52. [DOI] [PubMed] [Google Scholar]
- 18. Yim H. J., Lok A. S. Natural history of chronic hepatitis B virus infection: what we knew in 1981 and what we know in 2005. Hepatology 2006; 43: S173–S81. [DOI] [PubMed] [Google Scholar]
- 19. Hu Y., Grau L. E., Scott G., Seal K. H., Marshall P. A., Singer M., et al. Economic evaluation of delivering hepatitis B vaccine to injection drug users. Am J Prev Med 2008; 35: 25–32. [DOI] [PMC free article] [PubMed] [Google Scholar]
- 20. Siddiqui M. R., Gay N., Edmunds W. J., Ramsay M. Economic evaluation of infant and adolescent hepatitis B vaccination in the UK. Vaccine 2011; 29: 466–75. [DOI] [PubMed] [Google Scholar]
- 21. Tilson L., Thornton L., O'Flanagan D., Johnson H., Barry M. Cost effectiveness of hepatitis B vaccination strategies in Ireland: an economic evaluation. Eur J Public Health 2008; 18: 275–82. [DOI] [PubMed] [Google Scholar]
- 22. National Institute for Health and Care Excellence (NICE). Hepatitis B (chronic) (CG165). London: National Institute for Health and Care Excellence; 2013..
- 23. Sutton A. J., Gay N. J., Edmunds W. J., Hope V. D., Gill O. N., Hickman M. Modelling the force of infection for hepatitis B and hepatitis C in injecting drug users in England and Wales. BMC Infect Dis 2006; 6: 93. [DOI] [PMC free article] [PubMed] [Google Scholar]
- 24. Health Protection Agency (HPA) . Acute Hepatitis B (England): Annual Report for 2012, 7; 35, published 30 August 2013. London: HPA; 2014.
- 25. Martin N. K., Vickerman P., Grebely J., Hellard M., Hutchinson S. J., Lima V. D., et al. Hepatitis C virus treatment for prevention among people who inject drugs: modeling treatment scale‐up in the age of direct‐acting antivirals. Hepatology 2013; 58: 1598–609. [DOI] [PMC free article] [PubMed] [Google Scholar]
- 26. Sutton A. J., Gay N. J., Edmunds W. J. Modelling the impact of prison vaccination on hepatitis B transmission within the injecting drug user population of England and Wales. Vaccine 2006; 24: 2377–86. [DOI] [PubMed] [Google Scholar]
- 27. ENGERIX®‐B Product Information . Rixensart, Belgium: GlaxoSmithKline Biologicals; 2014.
- 28. Beck C. R., Cloke R., O'Moore E., Puleston R. Hepatitis B vaccination coverage and uptake in prisons across England and Wales 2003–2010: a retrospective ecological study. Vaccine 2012; 30: 1965–71. [DOI] [PubMed] [Google Scholar]
- 29. Tillmann H. L., Zachou K., Dalekos G. N. Management of severe acute to fulminant hepatitis B: to treat or not to treat or when to treat? Liver Int 2012; 32: 544–53. [DOI] [PubMed] [Google Scholar]
- 30. National Institute for Health and Care Excellence (NICE) Guide to the Methods of Technology Appraisal. London: NICE; 2013. [PubMed] [Google Scholar]
- 31. British National Formulary. BNF64 . London: British National Formulary; 2014.
- 32. Curtis L. Unit Costs of Health and Social Care. Canterbury: Personal Social Services Research Unit; 2012.
- 33. Brown R. E., De C. E., Colin X., Antonanzas F., Iloeje U. H. Hepatitis B management costs in France, Italy, Spain, and the United Kingdom. J Clin Gastroenterol 2004; 38: S169–74. [DOI] [PubMed] [Google Scholar]
- 34. National Health Service (NHS) . NHS reference cost 2012–2013. London: Department of Health; 2013.
- 35. Ong S. C., Mak B., Aung M. O., Li S. C., Lim S. G. Health‐related quality of life in chronic hepatitis B patients. Hepatology 2008; 47: 1108–17. [DOI] [PubMed] [Google Scholar]
- 36. Luyten J., Marais C., Hens N., De S. K., Beutels P. Imputing QALYs from single time point health state descriptions on the EQ‐5D and the SF‐6D: a comparison of methods for hepatitis a patients. Value Health 2011; 14: 282–90. [DOI] [PubMed] [Google Scholar]
- 37. Winter R. J., Dietze P. M., Gouillou M., Hellard M. E., Robinson P., Aitken C. K. Hepatitis B virus exposure and vaccination in a cohort of people who inject drugs: what has been the impact of targeted free vaccination? J Gastroenterol Hepatol 2013; 28: 314–22. [DOI] [PubMed] [Google Scholar]
- 38. Hope V. D., Mandal S., Cullen J. K., Balogun K., Ncube F. Hepatitis B vaccination for people who inject drugs. Correspondence. Lancet 2015; 385: 115–6. [DOI] [PubMed] [Google Scholar]
Associated Data
This section collects any data citations, data availability statements, or supplementary materials included in this article.
Supplementary Materials
Table S1 Management costs associated with hepatitis B virus (HBV) infection in each state of the Markov model.
Table S2 Mean utility weights and decrement in utility associated with hepatitis B virus (HBV) infection (against baseline).
Supporting info item