

Abstract
Aim
To compare the efficacy and safety of the once‐weekly oral dipeptidyl peptidase‐4 (DPP‐4) inhibitor omarigliptin or once‐daily DPP‐4 inhibitor sitagliptin in patients with type 2 diabetes (T2DM) and inadequate glycaemic control on metformin.
Materials and methods
Patients with T2DM with a glycated haemoglobin (HbA1c) concentration ≥6.5% to ≤9.0% while on a stable dose of metformin (≥1500 mg/d) were randomized in a double‐blind manner to receive omarigliptin 25 mg once weekly (n = 322) or sitagliptin 100 mg once daily (n = 320). The primary analysis assessed whether omarigliptin was non‐inferior to sitagliptin in reducing HbA1c at week 24, based on the criterion of having an upper bound of the 95% confidence interval (CI) about the difference less than the non‐inferiority bound of 0.3%.
Results
The mean baseline HbA1c was 7.5% in both groups. After 24 weeks, the least squares (LS) mean change in HbA1c from baseline was −0.47% in the omarigliptin group and −0.43% in the sitagliptin group, with a between‐group difference of −0.03% (95% CI −0.15, 0.08). This result met the prespecified criterion for declaring non‐inferiority. The LS mean change from baseline in fasting plasma glucose and the percentage of patients with HbA1c <7.0% or <6.5% at week 24 were similar in the two treatment groups. There were no notable differences in adverse events and the incidence of symptomatic hypoglycaemia was low and similar in the groups.
Conclusions
In patients with T2DM and inadequate glycaemic control on metformin, the addition of omarigliptin 25 mg once weekly or sitagliptin 100 mg once daily led to similar improvements in glycaemic control. Both agents were generally well tolerated with a low incidence of hypoglycaemia.
Keywords: incretin therapy, MK‐3102, oral antihyperglycaemic agent
1. INTRODUCTION
Over the past decade, dipeptidyl peptidase‐4 (DPP‐4) inhibitors have become an established therapy for the treatment of patients with type 2 diabetes (T2DM).1, 2 Omarigliptin (MK‐3102) is a selective oral DPP‐4 inhibitor with a half‐life that enables once‐weekly dosing3 and was recently approved in Japan.
The DPP‐4 inhibitor class of drugs improve glycaemic control in patients with T2DM by slowing the inactivation of incretin hormones, including glucagon‐like peptide‐1 (GLP‐1) and glucose‐dependent insulinotropic polypeptide (GIP), which are part of an endogenous system involved in the physiological regulation of glucose homeostasis. When blood glucose concentrations are normal or elevated, GLP‐1 and GIP increase insulin synthesis in, and release from, pancreatic β cells. GLP‐1 also lowers glucagon secretion from pancreatic α cells. The action of these incretins is glucose‐dependent, such that when glucose levels are low, enhancement of insulin secretion and inhibition of glucagon release are not observed, a mechanism associated with a low incidence of hypoglycaemia.1
In the present study, we report the results of a clinical study that compared the glycaemic efficacy and safety of the addition of omarigliptin 25 mg administered once weekly with the addition of sitagliptin 100 mg administered once daily in patients with inadequate glycaemic control on metformin monotherapy.
2. MATERIALS AND METHODS
2.1. Patients
Eligible patients were men and women (aged ≥18 years) with T2DM who had been on a stable dose of metformin (≥1500 mg/d) for ≥12 weeks and had a glycated haemoglobin (HbA1c) concentration ≥6.5% and ≤9.0% at screening and a fasting fingerstick glucose >7.2 and <14.4 mmol/L at randomization. Patients were excluded from the study if they had type 1 diabetes, a history of ketoacidosis, active liver disease, significant cardiovascular disease, a history of malignancy or haematological disorders, or if they had been previously treated with any antihyperglycaemic agents other than metformin within 12 weeks prior to screening or with omarigliptin at any time before signing informed consent. For patients assessed by the investigator as possibly having type 1 diabetes, C‐peptide level was measured, and patients with a fasting C‐peptide level <0.7 ng/mL (0.23 nmol/L) were excluded.
Laboratory exclusion criteria included creatinine levels ≥124 µmol/L (men) or ≥115 µmol/L (women) (≥1.4 or ≥1.3 mg/dL), estimated glomerular filtration rate <60 mL/min/1.73 m2 (calculated by the Modification of Diet in Renal Disease formula), serum alanine aminotransferase or aspartate aminotransferase levels >2 times the upper limit of normal (ULN), triglycerides >6.8 mmol/L (>600 mg/dL) or thyroid‐stimulating hormone outside the central laboratory normal range.
2.2. Study design
The study was a multinational, double‐blind, double‐dummy, randomized, active‐controlled, non‐inferiority trial conducted in 97 sites in 13 countries (6 in Argentina, 6 in Canada, 1 in Croatia, 5 in Estonia, 5 in Georgia, 10 in Hungary, 4 in Israel, 5 in Malaysia, 4 in the Philippines, 9 in Poland, 8 in Romania, 8 in South Africa and 26 in the USA). The study included a 1‐week screening period, a 2‐week single‐blind placebo run‐in period and a 24‐week double‐blind treatment period (Figure S1). After the run‐in period, patients were randomized centrally, using an interactive voice response system, in a 1:1 ratio to omarigliptin 25 mg once weekly (and placebo matching sitagliptin, dosed once daily) or sitagliptin 100 mg once daily (and placebo matching omarigliptin, dosed once weekly). Patients not meeting progressively stricter prespecified glycaemic control criteria post‐randomization (from day 1 through week 6, fasting plasma glucose [FPG] >14.99 mmol/L; from week 6 to week 12, FPG >13.32 mmol/L; after week 12 through week 24 >11.10 mmol/L) were rescued with open‐label glimepiride. The study (MK‐3102‐026; ClinicalTrials.gov Identifier: NCT01841697) was conducted in accordance with the principles of Good Clinical Practice and was approved by the appropriate institutional review boards and regulatory agencies. Informed consent was obtained from all study participants.
2.3. Study evaluations
The primary objectives of the present study were assessment of the efficacy, safety and tolerability of 24 weeks of omarigliptin treatment. The primary study hypothesis was that the mean change from baseline in HbA1c in patients treated with omarigliptin once weekly would be non‐inferior to that in patients treated with sitagliptin once daily.
Secondary objectives were to assess the effect of the addition of omarigliptin compared with sitagliptin on FPG and on the percentage of patients with HbA1c of <7.0% and <6.5% after 24 weeks of treatment.
2.4. Efficacy endpoints
Efficacy endpoints were changes from baseline in HbA1c and FPG after 24 weeks of treatment. The percentages of patients who reached HbA1c goals of <7.0% and <6.5% at week 24 were also calculated.
2.5. Safety endpoints
Safety assessment included collection of adverse events (AEs), physical examination, including vital signs, standard laboratory blood chemistry (eg, liver and renal safety tests), lipid panel, haematology, urine analysis and ECG. In addition, amylase and lipase levels were measured as per regulatory agency request. A standard questionnaire was provided to patients to collect hypoglycaemia information.
Potential cases of pancreatitis (events assessed by the investigator as possibly being pancreatitis, or events meeting prespecified event terms suggestive of pancreatitis) and prespecified hypersensitivity AEs (anaphylactic reaction, angioedema, asthma‐bronchospasm, erythema multiforme, Stevens‐Johnson syndrome, toxic epidermal necrolysis, and drug rash with eosinophilia and systemic symptoms) were evaluated in a blinded manner by external clinical adjudication committees.
2.6. Statistical analyses
All randomized patients who received at least one dose of study treatment and had a baseline or a post‐randomization measurement served as the primary population for efficacy analyses. For analyses of the primary efficacy endpoint, a constrained longitudinal data analysis (cLDA) model4 including terms for treatment, time and the interaction of time by treatment with the restriction of a common baseline mean across treatment groups was used. The primary hypothesis regarding the non‐inferiority of omarigliptin vs sitagliptin in decreasing HbA1c was assessed using the estimated treatment difference from the cLDA model. If the upper bound of the two‐sided 95% confidence interval (CI) for the mean difference between omarigliptin and sitagliptin was less than the non‐inferiority margin (δ = 0.3%), then omarigliptin was declared non‐inferior to sitagliptin. Data acquired after the initiation of rescue therapy were treated as missing to avoid the confounding influence of rescue therapy. FPG level was analysed using the cLDA model described above for HbA1c, substituting the FPG baseline efficacy measurement for HbA1c. Analysis of percentages of individuals at the HbA1c goals of <7.0% and <6.5% at week 24 was based on estimated rates and CIs for between‐group rate differences computed using the Miettinen and Nurminen method,5 stratified by baseline HbA1c (> or ≤ median).
Analysis of safety data used the population of all randomized patients who received at least one dose of study treatment. Safety and tolerability were assessed during the treatment period and through 21 days after treatment, which ended by clinical review of all relevant variables, including AEs, laboratory tests, ECG, vital signs and body weight. Safety data acquired after initiation of glycaemic rescue medication were excluded from the primary analysis. AEs of symptomatic hypoglycaemia were prespecified as events of interest and P values and 95% CIs for between‐treatment group comparisons were calculated. For AEs with incidence of at least 4 patients in any treatment group, change from baseline in body weight, any AE of hypoglycaemia and AEs of severe hypoglycaemia, 95% CIs were calculated for between‐group comparisons using the method of Miettinen and Nurminen.5 For body weight, change from baseline was analysed using the cLDA method described above, substituting baseline body weight for HbA1c.
Using a standard deviation of 0.96% and assuming the true mean difference in HbA1c between omarigliptin and sitagliptin is 0.0% (α = 0.05, two‐sided test), and factoring for expected missing data, 300 randomized patients per treatment group would provide 95.7% power to declare non‐inferiority with a margin = 0.3% in HbA1c reduction at week 24.
3. RESULTS
3.1. Patient disposition and characteristics
A total of 985 patients were screened and 642 were randomized (322 to omarigliptin and 320 to sitagliptin). The most common reasons for a patient not being randomized were not meeting the prior antihyperglycaemic therapy and HbA1c requirements or meeting exclusionary laboratory values. The first dose of study medication was administered on June 20, 2013 and the last patient visit was on November 17, 2014.
Of the 642 randomized patients, 588 (91.6%) completed the study on study medication (Figure S2). Baseline demographics and efficacy variables were generally balanced between treatment groups (Table 1). The mean age was 57.3 years, ~50% were male, the mean body mass index was 32 kg/m2 and the mean duration of diabetes was 7 years.
Table 1.
Baseline demographic, anthropometric and disease characteristics of study treatment groups
| Omarigliptin | Sitagliptin | |
|---|---|---|
| Characteristic | N = 322 | N = 320 |
| Age, years | 57 ± 10 | 58 ± 10 |
| Male, n (%) | 151 (46.9) | 175 (54.7) |
| Race, n (%) | ||
| White | 257 (79.8) | 248 (77.5) |
| Asian | 32 (9.9) | 44 (13.8) |
| Black | 26 (8.1) | 24 (7.5) |
| Multi‐racial | 6 (1.9) | 3 (0.9) |
| Pacific Islander | 1 (0.3) | 0 (0.0) |
| American Indian/Alaska Native | 0 (0.0) | 1 (0.3) |
| Ethnicity, n (%) | ||
| Not Hispanic or Latino | 253 (78.6) | 257 (80.3) |
| Hispanic or Latino | 49 (15.2) | 52 (16.3) |
| Not reported | 12 (3.7) | 7 (2.2) |
| Unknown | 8 (2.5) | 4 (1.3) |
| Body weight, kg | 91.3 ± 20.1 | 87.7 ± 16.9 |
| Body mass index, kg/m2 | 32.7 ± 6.1 | 31.3 ± 5.1 |
| HbA1c, % | 7.5 ± 0.8 | 7.5 ± 0.7 |
| FPG, mmol/L | 8.9 ± 2.0 | 8.5 ± 1.8 |
| Duration of T2DM, years | 7.0 ± 4.5 | 7.5 ± 5.6 |
Values are mean ± standard deviation unless otherwise noted.
3.2. Efficacy
After 24 weeks, the LS mean change from baseline in HbA1c was −0.47% (95% CI −0.55, −0.38) with omarigliptin 25 mg once weekly and −0.43% (95% CI −0.51, −0.35) with sitagliptin 100 mg once daily (Figure 1A and Table 2). The between‐group LS mean difference in change from baseline at week 24 in HbA1c was ‐0.03% (95% CI −0.15, 0.08), with the upper bound of the 2‐sided 95% CI for the between‐group difference below the prespecified non‐inferiority margin of 0.3%. The time course profile for the change in HbA1c was similar for the 2 treatment groups (Figure 1A). Most of the treatment effect on HbA1c was observed by week 12 for both agents and the effect was maintained throughout the remainder of the treatment period. Subgroup analyses by baseline HbA1c showed greater reductions in HbA1c in patients with higher baseline HbA1c (Table 2). In the subgroup with baseline HbA1c ≥8.0% (mean 8.6% for omarigliptin and 8.5% for sitagliptin) the reduction in HbA1c from baseline was −0.79% (95% CI −0.99, −0.58) and −0.71% (95% CI −0.91, −0.51) for the omarigliptin and sitagliptin groups, respectively.
Figure 1.
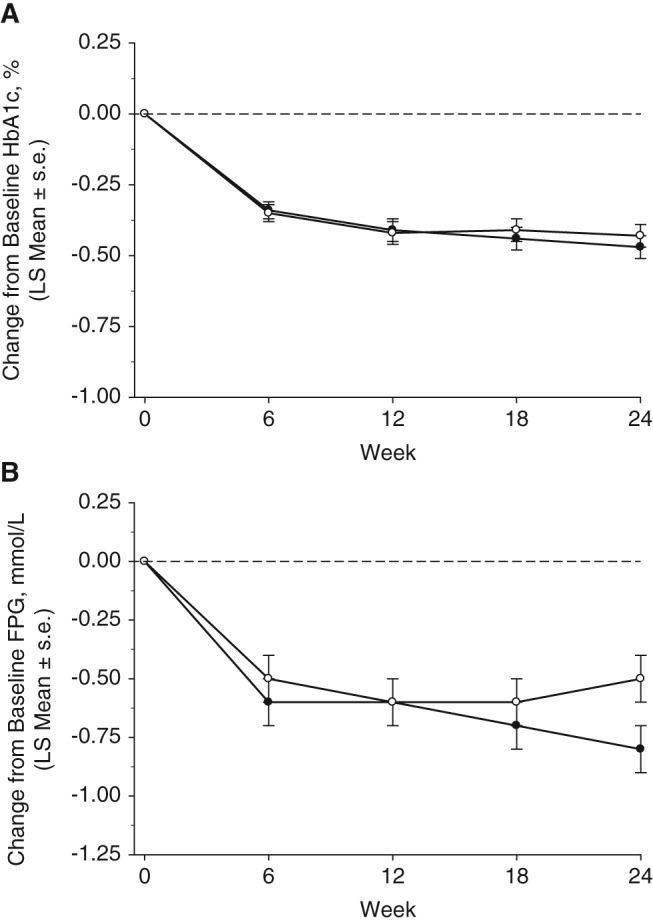
Efficacy measures until week 24. A, Change from baseline HbA1c (%) and B, change from baseline FPG (mmol/L), based on a model with terms for treatment, prior antihyperglycaemic therapy status (yes/no), and the interaction of time by treatment, and time by prior antihyperglycaemic therapy status, with a constraint that the mean baseline was the same for both treatment groups. Black circles: omarigliptin; white circles: sitagliptin. s.e., standard error.
Table 2.
Efficacy endpoints at week 24
| Omarigliptin | Sitagliptin | |
|---|---|---|
| Endpoint | n = 322 | n = 320 |
| HbA1c, % | ||
| Full analysis set | ||
| Baseline | 7.5 ± 0.8 | 7.5 ± 0.7 |
| Week 24 | 7.0 ± 0.9 | 7.0 ± 0.8 |
| Change from baseline1 | −0.47 (−0.55, −0.38) | −0.43 (−0.51, −0.35) |
| Change vs sitagliptin2 | −0.03 (−0.15, 0.08) | |
| Subgroup: baseline HbA1c <7.0% | n = 87 | n = 87 |
| Baseline | 6.6 ± 0.3 | 6.6 ± 0.2 |
| Week 24 | 6.3 ± 0.5 | 6.4 ± 0.5 |
| Change from baseline1 | −0.28 (−0.37, −0.18) | −0.18 (−0.28, −0.09) |
| Change vs sitagliptin2 | −0.09 (−0.23, 0.04) | |
| Subgroup: baseline HbA1c ≥7.0% and <8.0% | n = 149 | n = 145 |
| Baseline | 7.4 ± 0.3 | 7.4 ± 0.3 |
| Week 24 | 7.0 ± 0.8 | 6.9 ± 0.6 |
| Change from baseline1 | −0.39 (−0.51, −0.27) | −0.40 (−0.53, −0.28) |
| Change vs sitagliptin2 | 0.01 (−0.16, 0.19) | |
| Subgroup: baseline HbA1c ≥8.0% | n = 86 | n = 88 |
| Baseline | 8.6 ± 0.4 | 8.5 ± 0.3 |
| Week 24 | 7.7 ± 0.9 | 7.7 ± 1.0 |
| Change from baseline1 | −0.79 (−0.99, −0.58) | −0.71 (−0.91, −0.51) |
| Change vs sitagliptin2 | −0.08 (−0.37, 0.21) | |
| FPG, mmol/L | ||
| Full analysis set | ||
| Baseline | 8.9 ± 2.0 | 8.5 ± 1.8 |
| Week 24 | 7.9 ± 1.9 | 8.0 ± 1.8 |
| Change from baseline1 | −0.8 (−1.0, −0.6) | −0.5 (−0.7, −0.3) |
| Change vs sitagliptin2 | −0.2 (−0.5, 0.0) | |
Values are mean ± standard deviation unless otherwise noted.
To convert mmol/L to mg/dL multiply by 18.
LS mean (95% CI).
Difference in LS means (95% CI).
After 24 weeks of treatment, omarigliptin compared with sitagliptin provided a similar reduction in FPG (Figure 1B and Table 2). In both treatment groups, a near‐maximum reduction from baseline in FPG was observed at week 6, and the treatment effect was maintained throughout the remainder of the treatment period (Figure 1B).
After 24 weeks of treatment, the percentages of patients at HbA1c goals of <7.0% and <6.5% were similar in the two treatment groups. At week 24 the percentages of patients with HbA1c <7.0% were 54.4 (95% CI 48.8, 59.9) and 52.4 (95% CI 46.8, 57.9) in the omarigliptin and sitagliptin groups, respectively, while for those with HbA1c <6.5% they were 28.8 (95% CI 24.0, 34.1) and 24.4 (95% CI 19.9, 29.5; Figure S3).
Five patients (1.6%) in the omarigliptin group and 6 (1.9%) in the placebo group received rescue therapy at or before week 24 and the time‐to‐rescue was similar in the 2 treatment groups.
3.3. Safety and tolerability
The incidence rates of overall AEs, AEs assessed by the investigator as drug‐related and serious AEs were similar between the omarigliptin and sitagliptin groups (Table 3). There were no reported AEs of pancreatitis and no adjudication‐confirmed events of pancreatitis in either treatment group. One death attributable to myocardial infarction was reported in a patient in the sitagliptin group; the patient had a history of ischaemic heart disease.
Table 3.
Adverse events summary
| Omarigliptin | Sitagliptin | ||
|---|---|---|---|
| Subjects, n (%) | N = 322 | N = 320 | Difference 1 |
| With one or more | |||
| AEs | 117 (36.3) | 130 (40.6) | −4.3 (−11.8, 3.2) |
| Drug‐related2 AEs | 12 (3.7) | 12 (3.8) | 0.0 (−3.2, 3.1) |
| Serious AEs | 11 (3.4) | 9 (2.8) | 0.6 (−2.3, 3.5) |
| Serious drug‐related2 AEs | 0 (0.0) | 0 (0.0) | 0.0 |
| Who died | 0 (0.0) | 1 (0.3) | −0.3 |
| Who discontinued due to | |||
| An AE | 3 (0.9) | 7 (2.2) | −1.3 (−3.6, 0.8) |
| A drug‐related2 AE | 0 (0.0) | 1 (0.3) | −0.3 |
| A serious AE | 1 (0.3) | 2 (0.6) | −0.3 |
| A serious drug‐related2 AE | 0 (0.0) | 0 (0.0) | 0.0 |
| With one or more AE of hypoglycaemia | 12 (3.7) | 15 (4.7) | −1.0 (−4.3, 2.3) |
| Symptomatic3 | 10 (3.1) | 13 (4.1) | −1.0 (−4.1, 2.1)4 |
| Asymptomatic5 | 5 (1.6) | 3 (0.9) | 0.6 (−1.4, 2.8) |
Difference in % vs sitagliptin; estimate (95% CI) was computed only for those endpoints with at least 4 patients having events in ≥1 treatment groups.
Assessed by the investigator as related to study drug.
Symptomatic hypoglycaemia: episode with clinical symptoms attributed to hypoglycaemia, without regard to glucose level.
P = .515.
Asymptomatic hypoglycaemia: glucose values ≤3.9 mmol/L without symptoms.
Specific AEs with an incidence ≥2% in ≥1 treatment group are shown in Table 4. All of the AEs of lipase increased as well as amylase increased (incidence <2%) were non‐serious and none led to discontinuation from study medication. One patient in the omarigliptin group had 2 non‐serious AEs of tongue oedema, which were not associated with respiratory distress and which were adjudicated and confirmed to be angioedema (a prespecified hypersensitivity AE). The incidence of patients reporting ≥ 1 AE of hypoglycaemia (symptomatic or asymptomatic) was similar in the two treatment groups (Table 3). There were no events of hypoglycaemia that required medical assistance; one patient in the omarigliptin group had an event of hypoglycaemia that required non‐medical assistance.
Table 4.
Specific AEs with an incidence ≥2% in ≥1 treatment group by system organ class
| Omarigliptin | Sitagliptin | |
|---|---|---|
| N = 322 | N = 320 | |
| Gastrointestinal disorders, n (%) | ||
| Diarrhoea | 3 (0.9) | 9 (2.8) |
| Infections and infestations, n (%) | ||
| Influenza | 1 (0.3) | 7 (2.2) |
| Upper respiratory tract infection | 13 (4.0) | 12 (3.8) |
| Urinary tract infection | 4 (1.2) | 9 (2.8) |
| Investigations, n (%) | ||
| Lipase increased | 8 (2.5) | 13 (4.1) |
| Metabolism and nutrition disorders, n (%) | ||
| Hypoglycaemia | 12 (3.7) | 15 (4.7) |
| Musculoskeletal and connective tissue disorders, n (%) | ||
| Back pain | 8 (2.5) | 2 (0.6) |
There were no clinically meaningful changes from baseline in laboratory safety measures or predefined limits of change. Small increases from baseline at week 24 in mean serum amylase and lipase levels were observed in both treatment groups; the magnitude of the increase was similar in both groups. Both baseline and week 24 mean amylase and lipase values were within normal laboratory limits for both the sitagliptin and omarigliptin groups. At baseline, 11.2% of patients in the omarigliptin group and 11.6% of patients in the sitagliptin group had lipase values greater than the central laboratory upper limit of normal (>ULN). On treatment, at weeks 6, 12, 18 and 24, the incidence of patients with lipase >ULN ranged from 17.4% to 21.2% in the omarigliptin group and 14.1% to 20.4% in the sitagliptin group (Table S1). Lower incidences of amylase >ULN at baseline and on treatment were observed (Table S1). In patients who had a lipase value >ULN at baseline or who had values >ULN during the treatment period, fluctuations above and below the ULN were commonly observed.
There were no clinically meaningful changes from baseline in heart rate, blood pressure or ECG intervals (including QTc). At week 24, there was a small decrease from baseline in body weight in both treatment groups (LS mean change from baseline of −0.7 kg [95% CI −1.2, −0.3] and −0.9 kg [95% CI −1.3, −0.4] in the omarigliptin and sitagliptin groups, respectively).
4. DISCUSSION
The present study showed that in patients with T2DM and inadequate glycaemic control with metformin, the addition of once‐weekly omarigliptin 25 mg provided similar reductions in HbA1c (meeting non‐inferiority criteria) and FPG, with a similar time course to that of daily administered sitagliptin 100 mg. Treatment with omarigliptin also resulted in a similar proportion of patients meeting glycaemic goals to that seen with sitagliptin.
The observed glycaemic efficacy in the present study indirectly serves as further evidence of the feasibility of providing DPP‐4 inhibition over the period of 1 week with a single once‐weekly dose that is similar to that which can be achieved with daily administration. The present results also provide further confirmation that the 25‐mg once weekly dose of omarigliptin is an appropriate dose for achieving clinical efficacy similar to that of a daily DPP‐4 inhibitor. The extent of HbA1c‐lowering from baseline observed in both treatment groups reflects the mild mean baseline hyperglycaemia in this study. It is well recognized that the extent of HbA1c‐lowering across glucose‐lowering therapies, irrespective of class, is proportional to the baseline HbA1c6; consistent with this, larger reductions were observed in patients with higher baseline HbA1c values.
Previous studies have shown the efficacy and safety of omarigliptin 25 mg once weekly as monotherapy for the treatment of T2DM.7, 8 The present study extends the experience with omarigliptin on a background of metformin.
The analysis of AEs and laboratory variables showed that omarigliptin was generally well tolerated, and no safety signals emerged that would suggest omarigliptin has a safety profile that distinguishes it from other presently marketed DPP‐4 inhibitors, including sitagliptin. The incidence of symptomatic hypoglycaemia was low in both treatment groups, which is consistent with the profile of DPP‐4 inhibitors when they are administered as monotherapy or co‐administered with agents that are not associated with hypoglycaemia, such as metformin. The incidence and characteristics (duration) of the hypoglycaemia events reported in association with the agent dosed once weekly (omarigliptin) were not distinguishable from those of the agent dosed once daily (sitagliptin), consistent with the glucose‐dependent mechanism (DPP‐4 inhibition) of both agents.
There were no clinically meaningful changes in laboratory safety measures for either agent. Small increases in lipase >ULN were observed in patients in both the sitagliptin and omarigliptin groups. Patients with elevations of lipase >ULN at baseline, as well as those with elevations on treatment, frequently had subsequent values that fluctuated between normal and >ULN. In the present study there were no cases of investigator‐reported or adjudication‐confirmed pancreatitis in either treatment group. The modest and transient elevations in lipase levels observed in both groups were not associated with any evident increase in the occurrence of AEs of abdominal pain, abdominal discomfort or nausea or vomiting and no patients discontinued the study because of those AEs. The presence of baseline amylase and lipase values >ULN in asymptomatic patients, prior to their first dose of study medication, indicates that asymptomatic elevations in amylase and lipase levels are phenomena observed in a certain percentage of patients with T2DM, which appears to be slightly accentuated with incretin therapy, as has previously been reported.9, 10 Taken together, the small increases in amylase and lipase observed with sitagliptin and omarigliptin are unlikely to be clinically relevant.
In summary, once‐weekly treatment with omarigliptin 25 mg provided improvement in glycaemic control that was non‐inferior to daily dosed sitagliptin 100 mg and provided clinically meaningful glycaemic control without increasing the risk of hypoglycaemia and with a safety profile similar to that of sitagliptin. These results suggest once‐weekly omarigliptin may provide a valuable oral therapeutic option for the treatment of T2DM.
Supporting information
Table S1. Incidence of subjects with amylase or lipase values > upper limit of normal (ULN), >1.5 ULN or >3X ULN.
Figure S1. Study design; T2DM = type 2 diabetes mellitus; q.w. = once weekly; q.d. = once daily; R = randomization.
Figure S2. Disposition of subjects.
Figure S3. Percentage of subjects at HbA1c goals of <7.0% or <6.5% at Week 24. Percentages were estimated using standard multiple imputation techniques.
ACKNOWLEDGMENTS
Editorial assistance was provided by Jennifer Rotonda PhD and Michele McColgan BA of Merck & Co., Inc., Kenilworth, New Jersey.
Conflict of interest
R. G. has received research payments from Merck & Co., Inc. as an investigator. He has also received personal fees from Abbott, Astra Zeneca, Boehringer Ingelheim, Eli Lilly, Janssen, Merck, NovoNordisk, Sanofi, Servier, Takeda, Amgen and Valeant. I. G., P. J. A., E. A. O., K. D. K., E. L., Y. N. W., S. S. and S. S. E. are employees of Merck Sharp & Dohme Corp., a subsidiary of Merck & Co., Inc., Kenilworth, New Jersey, who may own stock and/or hold stock options in the company.
Author contributions
R. G., I. G., P. J. A., E. A. O., K. D. K., E. L., Y. N. W., S. S. and S. S. E. are responsible for the work described in this paper. I. G., P. J. A., K. D. K., E. L., S. S. and S. S. E. conceived, designed and/or planned the study. I. G., E. L., Y. N. W. and S. S. analyzed the data. R. G., I. G., E. A. O., E. L., S. S. and S. S. E. interpreted the results. I. G. and E. A. O. drafted the manuscript. R. G., I. G., P. J. A., K. D. K., E. L., Y. N. W., S. S. and S. S. E. critically reviewed and/or revised the manuscript for important intellectual content. All authors provided final approval of the version to be published and agree to be accountable for all aspects of the work in ensuring that questions related to the accuracy or integrity of any part of the work are appropriately investigated and resolved.
Goldenberg R, Gantz I, Andryuk PJ, O'Neill EA, Kaufman KD, Lai E, Wang YN, Suryawanshi S and Engel SS. Randomized clinical trial comparing the efficacy and safety of treatment with the once‐weekly dipeptidyl peptidase‐4 (DPP‐4) inhibitor omarigliptin or the once‐daily DPP‐4 inhibitor sitagliptin in patients with type 2 diabetes inadequately controlled on metformin monotherapy, Diabetes Obes Metab, 2017;19(3):394–400.
Funding information Funding for this study was provided by Merck & Co., Inc., Kenilworth, New Jersey
The copyright line for this article was changed on 17 February after original online publication.
REFERENCES
- 1. Pratley RE, Salsali A. Inhibition of DPP‐4: a new therapeutic approach for the treatment of type 2 diabetes. Curr Med Res Opin. 2007;23(4):919‐931. [DOI] [PubMed] [Google Scholar]
- 2. Inzucchi SE, Bergenstal RM, Buse JB, et al. Management of hyperglycemia in type 2 diabetes: a patient‐centered approach: position statement of the American Diabetes Association (ADA) and the European Association for the Study of Diabetes (EASD). Diabetes Care. 2012;35(6):1364‐1379. [DOI] [PMC free article] [PubMed] [Google Scholar]
- 3. Biftu T, Sinha‐Roy R, Chen P, et al. Omarigliptin (MK‐3102): a novel long‐acting DPP‐4 inhibitor for once‐weekly treatment of type 2 diabetes. J Med Chem. 2014;57(8):3205‐3212. [DOI] [PubMed] [Google Scholar]
- 4. Liang KY, Zeger SL. Longitudinal data analysis of continuous and discrete responses for pre‐post designs. Indian J Stat. 2000;62:134‐148. [Google Scholar]
- 5. Miettinen O, Nurminen M. Comparative analysis of two rates. Stat Med. 1985;4(2):213‐226. [DOI] [PubMed] [Google Scholar]
- 6. DeFronzo RA, Stonehouse AH, Han J, Wintle ME. Relationship of baseline HbA1c and efficacy of current glucose‐lowering therapies: a meta‐analysis of randomized clinical trials. Diabet Med. 2010;27(3):309‐317. [DOI] [PubMed] [Google Scholar]
- 7. Sheu WH, Gantz I, Chen M, et al. Safety and efficacy of omarigliptin (MK‐3102), a novel once‐weekly DPP‐4 inhibitor for the treatment of patients with type 2 diabetes. Diabetes Care. 2015;38(11):2106‐2114. [DOI] [PubMed] [Google Scholar]
- 8. Gantz I, Okamoto T, Ito Y, Okuyama K, Engel SS. Effect of omarigliptin, a novel once‐weekly DPP‐4 inhibitor, in Japanese patients with type 2 diabetes: a placebo‐ and sitagliptin‐controlled trial. Diabetologia. 2014;57(S1):S55. [DOI] [PMC free article] [PubMed] [Google Scholar]
- 9. Amylin Pharmaceuticals Inc . Bydureon medical review 2011. 2012. http://www.accessdata.fda.gov/drugsatfda_docs/nda/2012/022200Orig1s000MedR.pdf. Accessed April 5, 2016.
- 10. Boehringer Ingleheim Pharmaceuticals Inc . Linagliptin medical review 2010. 2011. http://www.accessdata.fda.gov/drugsatfda_docs/nda/2011/201280Orig1s000MedR.pdf. Accessed April 5, 2016.
Associated Data
This section collects any data citations, data availability statements, or supplementary materials included in this article.
Supplementary Materials
Table S1. Incidence of subjects with amylase or lipase values > upper limit of normal (ULN), >1.5 ULN or >3X ULN.
Figure S1. Study design; T2DM = type 2 diabetes mellitus; q.w. = once weekly; q.d. = once daily; R = randomization.
Figure S2. Disposition of subjects.
Figure S3. Percentage of subjects at HbA1c goals of <7.0% or <6.5% at Week 24. Percentages were estimated using standard multiple imputation techniques.