

Abstract
Background
The aim of this study was to study the effects of gypenosides (GPS) on lowering uric acid (UA) levels in hyperuricemic rats induced by lipid emulsion (LE) and the related mechanisms. GPS are natural saponins extracted from Gynostemma pentaphyllum.
Material/Methods
Forty-eight male SD rats were randomly divided into six groups: normal, model, two positive controls, and two GPS treated groups (two different doses of GPS). The normal group rats were fed a basic diet, and the other rats were orally pretreated with LE. Urine and blood were collected at regular intervals. Full automatic biochemical analyzer was used to detect the concentration levels of serum UA (SUA), serum creatinine (SCr), BUN, and urine UA (UUA), and urine creatinine (UCr) and fractional excretion of UA (FEUA). ELISA kits were used to detect enzymes activities: xanthine oxidase (XOD), adenosime deaminase (ADA), guanine deaminase (GDA), and xanthine dehydrogenase (XDH). Immunohistochemistry was used to observe kidney changes and protein (URAT1, GLUT9, and OAT1) expression levels. RT-PCR was used to detect the relevant mRNA expression levels.
Results
Treatment with GPS significantly reduced the SUA, prevented abnormal weight loss caused by LE, and improved kidney pathomorphology. Treatment with GPS also decreased the levels of XOD, ADA, and XDH expression, increased the kidney index and FEUA, downregulated URAT1 and GLUT9 expression and upregulated OAT1 expression in the kidney.
Conclusions
GPS may be an effective treatment for hyperuricemia via a decrease in xanthine oxidoreductase through the XOD/XDH system; and via an increase in urate excretion through regulating URAT1, GLUT9, and OAT1 transporters.
MeSH Keywords: Fat Emulsions, Hyperuricemia, Uric Acid
Background
Hyperuricemia (HUA) is an abnormally elevated level of uric acid in the blood; it can be of genetic and/or acquired origin, resulting from decreased uric acid excretion and/or increased production of uric acid due to elevated purine metabolism [1–3]. HUA is one of the most common metabolic diseases in the general population, and is associated with a greater risk of developing gout, renal dysfunction, hypertension, hyperlipidemia, cancer, diabetes, and obesity [4–10]. In recent years, the frequency of HUA in China, which ranges from 13% to 25% [11], has gradually risen along with the improvement of living standards, irregular diet, and excessive consumption of fat and flavoring ingredients [12,13]. However, there is no suitable drug for prevention and treatment of HUA.
Uric acid is the final product of purine metabolism and its level increases in the blood of patients with decreased urinary excretion due to a lower glomerular filtration rate and an increase absorption in the proximal tubule [14]. It has been the focus of concern because of its association with various cardiovascular diseases. Accordingly, close attention should be paid to understanding the involvement of HUA in the pathogenesis of these diseases.
Modern research has shown that xanthine oxidoreductase (XOR), whose expression is highest in the liver, is a rate-limiting enzyme that catalyzes uric acid production [15,16] through its involvement in the final two steps in the enzymatic catalysis of purine by modulating the catabolism of hypoxanthine to xanthine and then to uric acid [17]. Additionally, XOR has recently been found to be involved in the regulation of lipogenesis and atherosclerosis [18,19]. However, despite advances in the development of anti-hyperuricemic agents for the treatment of hyperuricemia and gout, long-term use of chemical drugs to suppress uric acid production or promote its excretion, such as allopurinol (XOD inhibitor) and benzbromarone (uricosuric agent), may lead to different adverse reactions in patients, including severe hypersensitivity, agranulocytosis, and aggravated renal toxicity by impairing pyrimidine metabolism. This underlines the urgent need for the development of safe and effective anti-hyperuricemic agents. The potentially serious adverse effects of known therapeutic drugs have led to growing awareness of the role of traditional Chinese medicine in the treatment of HUA. Traditional Chinese medicine has been widely used in many countries, especially in China, from antiquity; however, the use of traditional Chinese herbal remedies in the treatment of HUA has suffered from the lack of scientific evidence. Accordingly, we will investigate the anti-HUA effect of one well-known traditional Chinese herbal remedy.
Gynostemma pentaphyllum, known as “Jiaogulan” or “South ginseng”, has been widely used in Chinese medicine for the treatment of various diseases, including hepatitis, diabetes, and cardiovascular disease, and its wide use confirms its safety for further in vivo application [20]. Current research indicates that gypenosides (GPS), which are saponins, have been shown to possess a variety of pharmacological activities such as cholesterol-lowering, hypoglycemic, immunopotentiation, and antioxidant activities [21–25]. However, studies reporting on the uric acid-reducing effect of Gynostemma pentaphyllum or GPS have been rare until now, and the mechanism is not clear. Our previous study showed that GPS has the potential effect of lowering uric acid in HUA animal models induced by high-purine diets. This study investigated the therapeutic effect of GPS in the experimental HUA rat model by examining its effect on XOR activity, uric acid excretion, and renal protection, and identified possible underlying mechanisms. In addition, it is important to establish a stable animal model for the evaluation of the efficacy of traditional Chinese medicine [26]. As an irregular diet and excessive consumption of fat and flavoring ingredients are closely associated with HUA disease, we used lipid emulsion (LE) containing high cholesterol and high fat to develop the animal model for this study.
The lipid emulsion consisted of 25% lard, 10% cholesterol, 2% sodium deoxycholate, 1% propylthiouracil, 25% Tween-80, and 20% propylene glycol. Recent studies have shown that orally feeding animals with LE for a period of time can raise their cholesterol, increase production of low density lipoprotein cholesterol (LDL-C) and promote the de novo synthesis of purine nucleotide from ribose 5-phosphate to 5-phosphoribosyl pyrophosphate via the common metabolic pathway of NADP-NADPH. This will eventually lead to increased generation of uric acid while its excretion is decreased [27,28]. Another study found that high cholesterol levels can also cause oxidative stress, and oxidative stress can promote the feed-forward loop of uric acid production, which ultimately leads to elevated serum uric acid levels [29]. Both the sodium deoxycholate and propylthiouracil (anti-thyroid hormone secretion drugs) components of the LE can effectively promote the increase of blood lipids in rats. Sodium deoxycholate can stimulate the secretion of bile from liver cells, and then promote the emulsification of fat, and thus increase the absorption of cholesterol. Meanwhile, propylthiouracil can induce the synthesis of HMG-CoA reductase, and then increase the synthesis of cholesterol [30]. After the increase in body lipids, the levels of ketone bodies correspondingly rise. In addition, lipid metabolism disorders can involve the afferent and efferent arterioles, causing vascular stenosis or occlusion, which decreases the renal excretion of UA and increases the level of serum UA. Accordingly, LE containing high cholesterol and high fat is a suitable model that mimics the pathogenesis in humans, and thus can be used to study the causes and pathogenesis of metabolic disorder involving HUA, and the related treatment drug screening.
Material and Methods
Reagents
Gypenosides enriched extract from Gynostemma pentaphyllum was obtained from Zelang Medical Technology Co. (Nanjing, Jiangsu, China).
The biochemical reagents uric acid (UA), creatinine (Cr), and blood urea nitrogen (BUN) were obtained from Ningbo Medical System Biotechnology Co., Ltd (Ningbo, PR China). Enzyme linked immunosorbent assay (ELISA) kits with xanthine oxidase (XOD), adenosime deaminase (ADA), guanine deaminase (GDA), and xanthine dehydrogenase (XDH) were purchased from Shanghai Yuanye Biotech Industry Co., Ltd. (Shanghai, PR China). Lipid emulsion (LE) was prepared according to a standard operation procedure (25% lard, 10% cholesterol, 2% sodium deoxycholate, 1% propylthiouracil, 25% Tween-80, and 20% propylene glycol) [31].
The TRIzol reagent was purchased from Invitrogen Co., Ltd. (USA). PrimeScript™ RT Master Mix and SYBR Premix Ex Taq™ II were purchased from TaKaRa Biotechnology Co., Ltd. (Dalian, China). Rabbit URAT1 (the urate transporter 1, SLC22A12, Cat. No.: 14937-1-AP), GLUT 9 (the glucose transporter 9, SLC2A9, Cat. No.: bs-13388R) and OAT1 (the organic anion transporter 1, SLC22A6, Cat. No.: bs0607R) polyclonal primary antibodies were purchased from Bioss Biotech Co., Ltd. (Beijing, China); mouse and rabbit specific HRP/DAB (ABC) Detection IHC kit (ab64264) was from Abcam (Cambridge, USA). Hematoxylin and Eosin were purchased from Nanjing Technology Co., Ltd. (Jiangsu, China).
Animal treatment of LE-induced hyperuricemia
Forty-eight specific pathogen-free male SD rats weighing 180–220 g were purchased from Zhejiang Academy of Medical Sciences (Zhe Jiang, China). All rats were maintained at approximately 24±2°C, 55±5% humidity on a reverse 12 hour light/dark cycle and had free access to commercial standard chow and tap water. All procedures were performed according to protocols following the guidelines for the Use and Care of Laboratory Animals published by the Zhejiang province (2009).
After two weeks of acclimation to the laboratory, all rats were randomized into six groups (n=8). The normal control group (NC) was fed basic diet and water, while the other groups were orally pretreated with LE and randomly divided into five groups as follows: the lipid emulsion group (LE), two positive control groups (LE + allopurinol-APC, LE + benzbromarone-BPC), LE + low (15 mg/kg) and high dosage (60 mg/kg) of GPS groups (designated as GPS-L, GPS-H, respectively). Rats in the GPS-L and GPS-H groups were administrated with GPS intragastrically (i.g.) daily at the doses of 15 mg/kg or 60 mg/kg for eight weeks, while the NC and LE groups received an equal volume of water. All animals were given free access to food and water during the experimental period. Body weight was recorded every three days.
Biochemical analysis. Determination of UA, Cr, and BUN levels, and fractional excretion of uric acid (FEUA)
During the experimental period, blood samples were drawn from the ophthalmic venous plexus at regular intervals, and then centrifuged at 3,500 rpm for 10 minutes by Thermo Scientific Micro CL 17 (Thermo Ltd., Budapest, Hungary) stored at 4°C. The concentration of serum UA was determined by the ACCUTE (TBA-40FR) full automatic biochemical analyzer (Toshiba, Japan). At the end of the experiment, after fasting for 12 hours the rats were anesthetized with pentobarbital. The blood samples were drawn from the post cava at regular intervals, and then centrifuged at 3,500 rpm for 10 minutes by Thermo Scientific MicroCL 17 and stored at 4°C. The concentrations of serum UA, Cr, and BUN were determined by the ACCUTE (TBA-40FR) full automatic biochemical analyzer (Toshiba, Japan).
Two days before the last administration, urine was collected for 24 hours and stored at 4°C. The urine was centrifuged at 2,000 rpm for 10 minutes and the supernatant was collected. The urine uric acid (UUA) and urine creatinine (UCr) levels were determined by uricase colorimetry and enzyme analysis using the full automatic biochemical analyzer. FEUA was calculated as follows [32]:
UUA – urine uric acid, UCr – urine creatinine, SCr – serum creatinine, SUA – serum uric acid.
Determination of XOD, ADA, and XDH Activities
At the end of experiment, the rats were fasted overnight and anesthetized with pentobarbital. Blood was taken from the abdominal aortic and centrifuged at 3,500 rpm for 10 minutes, and stored at −80°C. Serum was separated to determine XOD and ADA activities by Power wave 340 (Bio-TEK, USA). Livers were excised, rinsed in ice-cold normal saline, gently blotted on filter paper, weighted and clipped to 0.5 g, stored at ice-cold normal saline, then homogenized by XHF-D High Speed Disperser (Scientz, Ningbo, China), and centrifuged at 3,000 rpm for 10 minutes, the liver homogenate was separated to determine XOD, ADA, XDH and GDA activities by Power wave340. All of the procedures were performed as described in the assay kit.
Histopathology and immunohistochemistry observation of kidney
Kidney tissue was dissected rapidly and weighed. A portion of the kidney was sliced and fixed in neutral formaldehyde saline (4%) solution for histopathological examination. After at least 24 hours, the organs were cut into suitable slices, washed, dehydrated and embedded to make tissue wax blocks (MEIKO EC360 Tissue Embedder, Germany). All the specimens were cut into 4 mm thickness (LEICARM2245 slicing machine, Germany, LEICA) and stained by hematoxylin- eosin (H&E, Nanjing Jiancheng Bioengineering Institute, Nanjing, China) for microscopic examination, and analyzed by a registered pathologist who was blinded to the experimental design and treatment protocol.
For IHC, Mouse and Rabbit Specific HRP/DAB (ABC) Detection IHC kit were used for the development of the reaction of URAT1, GLUT9, and OAT1 in the kidney specimens, and tissues were counterstained with hematoxylin. Histopathology observation was performed using a biological microscope B5-223IEP (Germany).
RNA isolation and RT-PCR
Kidney samples of interest were dissected with clean tools, on ice, and as quickly as possible to prevent degradation by proteases. The tissue was placed in round-bottom micro centrifuge tubes and immerse in liquid nitrogen to snap freeze. Samples were stored at −80°C until assayed.
Total RNA was isolated from the kidney tissue by using the TRIzol reagent (Cat. no. 15596-026, Invitrogen Co., USA) according to the manufacturer’s protocol. Reverse transcription were performed with PrimeScript™ RT Master Mix cDNA synthesis kit (Takara Biotechnology Co., Ltd., Dalian, China) by Gene Amplification Instrument (Hangzhou Bioer Technology Co., Ltd.) of TC-XP-G XP Cycler. The synthesized cDNA was diluted by adding 40 μL DNase free water and stored at −20°C for further amplification.
The primers (Sangon Biotech Co., Ltd., Shanghai, China) in Table 1 were diluted to a final concentration of 100 mM with dH2O (Takara Biotechnology Co., Ltd., Dalian, China). RT-PCR was performed using SYBR Premix Ex Taq™ II (Takara Biotechnology Co., Ltd., Dalian, China) against gene expression by a StepOnePlus™ Real-Time PCR System (ABI, Applied Biosystems, USA) with the following cycling conditions: 1) holding stage, initial denaturation at 95°C for 5 minutes; 2) cycling stage, 40 cycles of denaturation at 95°C for 30 seconds, annealing at 55°C (or 60°C) for 30 seconds, and extension at 72°C for 30 seconds; and a final extension at 72°C for 5 minutes; and 3) melt curve stage, run as the default applications. The gene expression levels were compared with those of GAPDH as a reference gene.
Table 1.
Target genes and their primer sequences (5′->3′, forward and reverse).
| Target genes | Gene sequences | |
|---|---|---|
| Forward | Reverse | |
| GAPDH | TGAGGCCGGTGCTGATGT | CAGTCTTCTGGGTGGCAGTGAT |
| URAT1 | CCTCCGAACCTTCATCTCC | TGGCACCACTCCATACACC |
| GLUT9 | ACCAAGAACAGAACCCATGC | ATCTGTCTCAGGCTGGCTGT |
| OAT1 | CATAATACCGAAGAGCCATAC | CTTCCGTTCTCAAAGTCCA |
Statistical analysis
All values are expressed as mean ± standard deviation and subjected to one-way analysis of variance (ANOVA) by using SPSS 19.0 for windows. The LSD-t tests were applied when homogeneity of variance assumptions were satisfied otherwise the Dunnet-t test was used. The value of p<0.05 was considered statistically significant.
Results
GPS effect on body weight in hyperuricemic rats
The effects of the GPS on the body weight of LE induced hyperuricemic rats were compared with those of rats fed a control diet (Figure 1). The initial body weight among all groups was similar at the start of the study and similar to preliminary studies as well as published studies. The body weight of the LE group was significantly low than the NC group (p<0.01). The weights of rats in the two treatment groups were also lower than the NC group (p<0.01), and higher than the LE group (p<0.05, or p<0.01), and there was no difference in body weight among the two treatment groups. We found GPS could prevent rats whose abnormal weight loss caused by LE.
Figure 1.
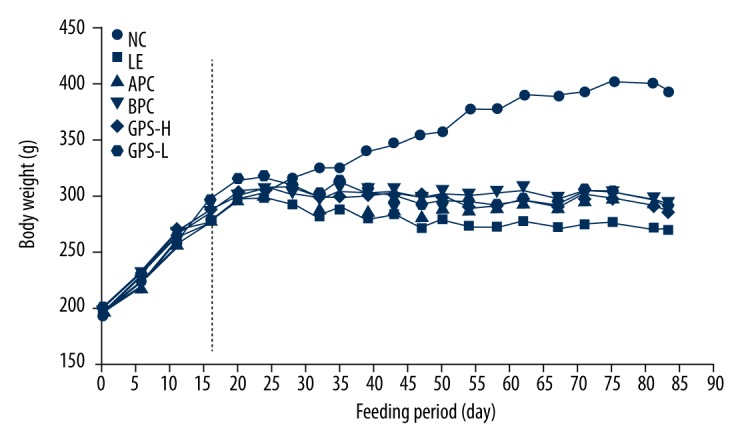
GPS effect on body weight in hyperuricemic rats (n=8). NC – normal control; LE – Lipid Emulsion contained high cholesterol and high fat food group; APC – Lipid Emulsion with positive control of Allopurinol group; BPC – Lipid Emulsion with positive control Benzobromarone group; GPS-H – Lipid Emulsion with high dose of Gypenosides (60 mg/kg body weight); GPS-L – Lipid Emulsion with low dose of Gypenosides (15 mg/kg body weight).
GPS decreased serum uric acid levels in hyperuricemic rats
As show in Figure 2, after four weeks of orally feeding with LE, the level of SUA in the model group was significantly higher than that in the NC group (p<0.05), and dramatically increased by 14.3%, which indicated that the model was successful for inducing HUA in rats. After six weeks, the level of SUA in the model group was significantly higher (p<0.01), and was significantly increased by 41.1%. Compared with the model group (LE group), the two groups treated with GPS (GPS- H, GPS- L) dramatically reduced by 29.1%, 23.1% (p<0.01, p<0.05), respectively, the level of SUA were suppressed significantly with dose-dependence by GPS, with the high dosage of GPS closer to normal (p<0.01). Furthermore, after eight weeks, the level of SUA in the model group was significantly higher (p<0.01); dramatically increased by 72.7%. Compared with the LE group, the level of SUA in the GPS-H group was significantly reduced by 32.7% (p<0.01), but the level of SUA in the GPS-L group was not statistically different. We found serum uric acid levels were greatly reduced by using GPS.
Figure 2.

GPS decreased serum uric acid levels in hyperuricemic rats (n=8). NC – normal control; LE – Lipid Emulsion contained high cholesterol and high fat food group; APC – Lipid Emulsion with positive control of Allopurinol group; BPC – Lipid Emulsion with positive control Benzobromarone group; GPS-H – Lipid Emulsion with high dose of Gypenosides (60 mg/kg body weight); GPS-L – Lipid Emulsion with low dose of Gypenosides (15 mg/kg body weight). The effect of GPS on serum UA was detected at 4 (A), 6 (B), 8 (C) weeks after administration. The data were expressed as mean ±SD. # P<0.05; ## P<0.01, compared with normal control group; * P<0.05; ** P<0.01, compared with Lipid Emulsion group.
GPS promoted renal excretion of uric acid and improved renal function in hyperuricemic rats
As show in Figure 3, after eight weeks of orally feeding with LE, the level of UUA in the model group was significantly decreased compared to the NC group (p<0.01), which indicated that the model was successful for damaging renal excretion in hyperuricemic rats. Compared with the LE group, after oral administration with GPS, the results showed an increasing trend in the level of UUA in the GPS-H group and the GPS-L group (Figure 3A).
Figure 3.

GPS promoted renal excretion of uric acid and improved renal function in hyperuricemic rats (n=8). NC – normal control; LE – Lipid Emulsion contained high cholesterol and high fat food group; APC – Lipid Emulsion with positive control of Allopurinol group; BPC – Lipid Emulsion with positive control Benzobromarone group; GPS-H – Lipid Emulsion with high dose of Gypenosides (60 mg/kg body weight); GPS-L – Lipid Emulsion with low dose of Gypenosides (15 mg/kg body weight). The effect of GPS on Urine UA (A), Urine Cr (B), Serum Cr (C), Serum BUN (E), kidney index (D) and FEUA (F) were detected at 8 weeks after administration. The data were expressed as mean ±SD. # P<0.05; ## P<0.01, compared with normal control group; * P<0.05; ** P<0.01, compared with Lipid Emulsion group.
SCr and BUN levels can be associated with renal dysfunction. Renal damage can be accompanied by an increase in SCr indicating reduced UA and Cr clearance [33]. Compared with the normal group, the level of SCr was significantly increased after orally-feeding with LE (p<0.01, Figure 3C) and the level of kidney index and the renal UA handling parameter FEUA were dramatically reduced (p<0.01, Figure 3D, 3F). But there was no significant difference in UCr or BUN among all treatment groups (Figure 3B, 3E).
Compared with the model group, the group treated with GPS at the higher dose had significantly increased FEUA levels and kidney index (p<0.05), which could enhance UA excretion.
Furthermore, as show in Figure 4, after eight weeks of orally feeding with LE, the expression levels of mURAT1 and mGLUT9 in the model group were significantly increased compared to the NC group (p<0.05), while the expression level of mOAT1 was decreased significantly (p<0.05); suggesting that GPS could improve the changes to some extent (p<0.05).
Figure 4.

GPS modulated the expression of mURAT1, mGLUT9 and mOAT1 in the kidney. NC – normal control; LE – Lipid Emulsion contained high cholesterol and high fat food group; APC – Lipid Emulsion with positive control of Allopurinol group; BPC – Lipid Emulsion with positive control Benzobromarone group; GPS-H – Lipid Emulsion with high dose of Gypenosides (60 mg/kg body weight); GPS-L – Lipid Emulsion with low dose of Gypenosides (15 mg/kg body weight). The effect of GPS on mURAT1 (A), mGLUT9 (B), mOAT (C) were detected at 8 weeks after administration. The data were expressed as mean ±SD. # P<0.05; ## P<0.01, compared with normal control group; * P<0.05; ** P<0.01, compared with Lipid Emulsion group.
In our research, the results showed that LE could inhibit the excretion of UA, while GPS could significantly increase the FEUA and kidney index, which suggested that GPS also could reduce UA by promoting UA excretion, possibly mediated by the regulation of renal mURAT1, mGLUT9, and mOAT1 in hyperuricemic rats.
GPS decreased serum and liver XOD, ADA, liver XDH and GDA in hyperuricemic rats
XOD, a versatile molybdoflavoprotein, is an enzyme involved in the metabolism of purines, while XDH is a precursor of XOD. ADA and GDA also are important enzymes in the metabolism of purine nucleoside.
As show in Figure 5, after eight weeks of oral administration of LE, the level of serum and liver XOD, ADA, liver GDA, and XDH in the model group was significantly increased compared to the normal control group (p<0.01), which indicated that the model was successful for promoting the generation of UA in hyperuricemic rats. Compared with the LE group, after oral administration with GPS, the results showed the levels of serum and liver XOD and ADA in GPS-high dosage group were significantly reduced (Figure 4A–4D, 4F).
Figure 5.

GPS decreased serum and liver XOD, ADA, liver XDH and GDA in hyperuricemic rats (n=8). NC – normal control; LE – Lipid Emulsion contained high cholesterol and high fat food group; APC – Lipid Emulsion with positive control of Allopurinol group; BPC – Lipid Emulsion with positive control Benzobromarone group; GPS-H – Lipid Emulsion with high dose of Gypenosides (60 mg/kg body weight); GPS-L – Lipid Emulsion with low dose of Gypenosides (15 mg/kg body weight). The effect of GPS on serum XOD (A), serum ADA (C), liver XOD (B), liver ADA (D), liver GDA (E) and liver XDH (F) were detected at 8 weeks after administration. The data were expressed as mean ±SD. # P<0.05; ## P<0.01, compared with normal control group; * P<0.05; ** P<0.01, compared with Lipid Emulsion group.
GPS improved hepatic morphology and histopathology as well as nephritic in hyperuricemic rats
The urate transporter 1 (URAT1, SLC22A12) expression is found in the cytoplasm on the lumen side and in luminal brush border [34]; the glucose transporter 9 (GLUT9, SLC2A9) localized in basolateral membranes of renal proximal tubule cells, is another urate transporter involved in urate reabsorption from the cytosolic kidney tubules to the interstitium a voltage-dependent manner [35]; the organic anion transporter 1 (OAT1, SLC22A6) is strongly expressed in the cytoplasm of striated ductal cells [36].
As show in Figure 6, after eight weeks of oral administration with LE, mild renal tubular dilatation and tubular epithelial cell vacuolar degeneration were observed in the hyperuricemic rats (Figure 6A, LE). GPS effectively improved the kidney histopathological changes in the hyperuricemic rats (Figure 6A, GPS). Furthermore, the hyperuricemic rats showed increased renal protein levels of URAT1 and GLUT9, and decreased levels of OAT1 (Figure 6B–6D, LE), while GPS downregulated URAT1 and GLUT9 expressions and upregulated OAT1 expression in the kidney (Figure 6B–6D, GPS).
Figure 6.

Histopathological and immunohistochemical findings of URAT1, GLUT9 and OAT1 in rat’s kidney. NC – normal control; LE – Lipid Emulsion contained high cholesterol and high fat food group; APC – Lipid Emulsion with positive control of Allopurinol group; BPC – Lipid Emulsion with positive control Benzobromarone group; GPS-H – Lipid Emulsion with high dose of Gypenosides (60 mg/kg body weight); GPS-L – Lipid Emulsion with low dose of Gypenosides (15 mg/kg body weight). (A) Hematoxylin-eosin stainingof a serial section (original magnification 200×); (B) URAT1 (original magnification 400×); (C) GLUT9 (original magnification 400×); (D) OAT1 (original magnification 400×). GPS improved kidney histopathological changes in the hyperuricemic rats.
Discussion
Selection of animal model
We can summarize the basic principles for establishing a model of HUA based on current research as follows: 1) inhibition of uricase activity by using drugs that inhibit the activity of uricase such as potassium oxonate, or using genetic engineering technology to knockout the uricase gene; 2) inhibition of the renal excretion of UA by using a high dose of ethambutol, LE, or nicotinic acid, that can cause nephropathy or damage to the kidney function which leads to increased serum UA levels in model animals; 3) supplement of UA precursors, as the precursor substances of UA or purine-rich foods can increase the serum UA levels in model animals, such as using xanthine, hypoxanthine, adenine, or yeast [37]; 4) supplementation with exogenous UA directly. In addition, compound factors are used in many studies, such as adenine with ethambutol, yeast and potassium oxonate.
Since an irregular diet and excessive consumption of fat and flavoring ingredients are closely associated with HUA disease, we adapted the LE diet to contain high cholesterol and high fat to establish our animal model. The results of our research showed that after feeding this LE diet to the rats, their UA production increased along with cholesterol levels and an increase in purine catabolism. On the other hand, LE consumption could impair renal excretion, and reduce clearance of UA. Therefore, it can be concluded that LE containing high cholesterol and high fat is a suitable model to use that conforms to similar pathogenesis in humans, and can thus be used to study the causes and pathogenesis of metabolic disorders involving HUA and to screen for potential use as treatment.
GPS inhibited the production of uric acid
As shown in Figure 7, our current study showed that the rate-limiting enzymes that catalyze UA production included XOD, ADA, XDH, and GDA. In the catabolism of purine nucleotides, purine nucleoside (adenosine and guanosine) are commonly hydrolyzed by a single nucleotide enzyme; in the case of adenosine, it is catalyzed by ADA to produce inosine. In addition, in inosine production by ADA, inosine can be de-ribosylated by another enzyme called purine nucleoside phosphorylase (PNP), converting it to hypoxanthine. Hypoxanthine can be converted into xanthine through a reaction catalyzed by XOR, which is a critical, rate-limiting enzyme in purine metabolism. The enzyme actually existed in two forms, namely XDH and XOD, which have xanthine dehydrogenase activity and xanthine oxidase activity, respectively. It catalyzes the last two steps of purine catabolism, the oxidation of hypoxanthine to xanthine and the oxidation of xanthine to UA, by utilizing either NAD+ or O2 [38,39]. These reactions generate the reactive oxygen species (ROS), specifically superoxide anion (O2−) and hydrogen peroxide (H2O2). Accordingly, XOR is a critical source of UA and ROS. The further oxidation of xanthine to UA is catalyzed by XOD. XDH uses NAD+ as the substrate and XOD uses O2.
Figure 7.
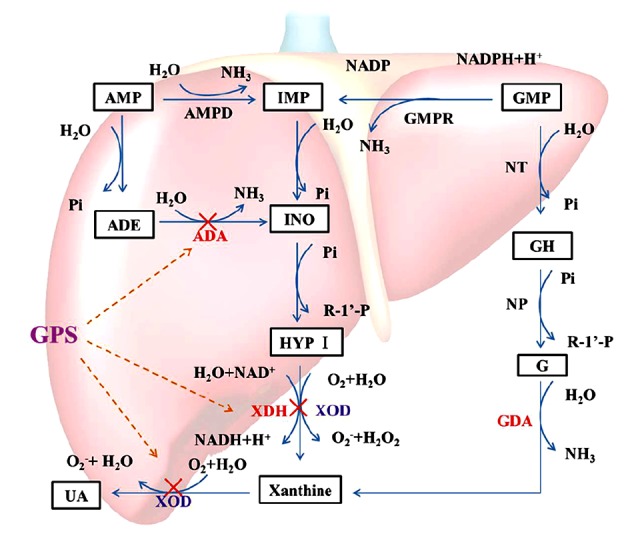
Catabolism of purine nucleotides. Xanthine oxidoreductose (XOR) catazyles the oxidation of hypoxanthine and the oxidation of xanthine to uric acid, by utilizing either NAD+ or O2. As a results of these reactions, superoxide anion (O2−) and hydrogen peroxide (H2O2), are produced. XDH prefers NAD+ as the susbtrate and XOD prefers O2. Uric acid is the final oxidation product of purine (adenine and guanine) metabolism in humans and higher primates. The anti-hyperuricemia effect of GPS may be related to a decrease in Xanthine Oxidoreductase through the XOD/XDH system. “×”– inhibit.
Our results also showed that LE containing high cholesterol and high fat promoted the formation of UA, while GPS exhibited anti-HUA activity by significantly reducing the production of UA through the inhibition of the XOD, ADA, and XDH activities.
GPS promoted uric acid excretion
As it is widely known that UA is the end product of purine metabolism in humans; the average UA pool in the normal human body is 1,200 mg. Every day about 750 mg of UA are produced and about 500–1,000 mg are excreted. About 70% of the daily turnover of UA in humans is excreted by the kidneys, while the other 30% enters the intestines where it is further broken down by colonic bacteria and eliminated [40] (Figure 8). The renal excretion of UA occurs through four processes, namely glomerular filtration, post-secretory reabsorption, active secretion by renal tubules and active tubular secretion, and reabsorption [41]. SCr and BUN levels can be associated with renal dysfunction. In addition, the urate transporter 1 from solute carrier family 22, member 12, also known as SLC22A12 and URAT1, is a protein which in humans is encoded by the SLC22A12 gene, which is responsible for 50% of urate reabsorption and is a key player in urate homeostasis [42]. The glucose transporter 9 (GLUT9) from the ninth member of glucose transporter superfamily, is a protein which in humans is encoded by the SLC2A9 gene, and it has been identified as the protein responsible for urate reabsorption [43]. The organic anion transporter 1 (OAT1) from solute carrier family 22, member 6, is a protein that in humans is encoded by the SLC22A6 gene, which in the basolateral membrane of renal proximal tubules is responsible for renal primary urate excretion [44]. These observations suggest that abnormality in renal URAT1, GLUT9, or OAT1 may have important implications in urate excretion impairment and HUA. If the absorption of UA in the proximal tubule increases and/or secretion function decreases due to renal tubular dysfunction, the serum level of uric acid will increase and HUA will occur.
Figure 8.
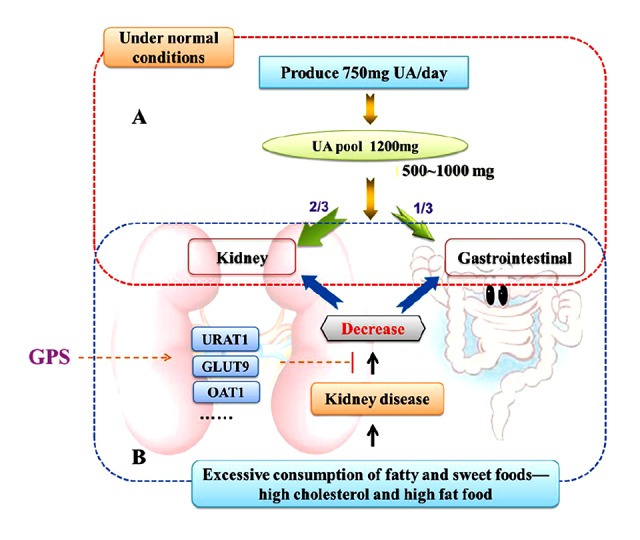
Uric acid removal. (A) Under normal conditions, UA is the end product of purine metabolism in humans and higher primates, the average uric acid pool in the normal human body is 1200 mg, every day produce UA is about 750 mg and excrete about 500~1000 mg. About 70% of the daily turnover of uric acid humans is excreted by the kidneys, while the other 30% enters the intestine where it is further broken down by colonic bacteria and eliminated. (B) Excessive consumption of fatty and sweet foods, like high cholesterol and high fat food affect the kidney functions, and the absorption of uric acid in the proximal tubule increased or (and) secretion function decreased by renal tubular dysfunction, the serum level of uric acid will increase and hyperuricemia will occur. GPS possibly has the uricosuric activity mediated by the regulation of renal mURAT1, mGLUT9 and mOAT1 in hyperuricemic rats.
The present study revealed that GPS downregulated mURAT1 and mGLUT9 expression and upregulated mOAT1 expression in the kidney of hyperuricemic rats, which was consistent with its elevated kidney index and FEUA, indicating the enhancement of urate excretion to reduce serum UA levels. These results suggest that GPS possibly has uricosuric activity, which is mediated by the regulation of renal mURAT1, mGLUT9, and mOAT1 in hyperuricemic rats.
Conclusions
HUA is a common type of metabolic disease. When blood UA levels continue to increase, this can lead to kidney damage, which in turn promotes the development of HUA. In all species, serum UA levels reflect the net balance between its constant production and excretion. Intracellular production of urate occurs from the degradation of exogenous purines that are derived from the diet as well as endogenous purines that result from nucleic acid catabolism [45]. If the production of uric acid surpasses the level that is excreted by the kidney, the serum level of UA will increase and HUA will occur.
In the present study, the catabolism of purine nucleotides and UA excretion were investigated. The results suggest that GPS can directly lower serum UA in hyperuricemic rats. In addition, GPS decreased the levels of XOD, ADA, and XDH, and increased the kidney index and FEUA. GPS also downregulated the expression of URAT1 and GLUT9, and upregulated the expression of OAT1 in the kidney. The anti-HUA effect of GPS is associated in part with the inhibition of hepatic XOR and the enhancement of urate excretion, resulting in the reduction of serum UA levels in hyperuricemic rats. Furthermore, GPS can improve the kidney pathomorphology, which suggests to us the advantages of traditional Chinese medicine. In short, this study provides evidence for the hypouricemic activity of gypenosides in the treatment of hyperuricemia in traditional Chinese medicine.
Footnotes
Conflict of interests
The authors declare that they have no conflict of interests.
Source of support: The project supported by China National Major Scientific and Technological Special Project for “Significant New Drugs Development” (2014ZX09301307-013 to Guiyuan Lv). The reported work was supported by China National Natural Science Foundation (81673638 to Suhong Chen)
References
- 1.Remedios C, Shah M, Bhasker AG, et al. Hyperuricemia: a reality in the Indian obese. Obes Surg. 2012;22:945–48. doi: 10.1007/s11695-012-0655-7. [DOI] [PubMed] [Google Scholar]
- 2.Lioté F. Hyperuricemia and gout. Curr Rheumatol Rep. 2003;5:454–58. doi: 10.1007/s11926-003-0072-y. [DOI] [PubMed] [Google Scholar]
- 3.Rott KT, Agudelo CA. Gout. JAMA. 2003;289:2857–60. doi: 10.1001/jama.289.21.2857. [DOI] [PubMed] [Google Scholar]
- 4.Feig DI, Madero M, Jalal DI, et al. Uric acid and the origins of hypertension. J Pediatr. 2013;162:896–902. doi: 10.1016/j.jpeds.2012.12.078. [DOI] [PMC free article] [PubMed] [Google Scholar]
- 5.Choi HK, Ford ES. Prevalence of the metabolic syndrome in individuals with hyperuricemia. Am J Med. 2007;120:442–47. doi: 10.1016/j.amjmed.2006.06.040. [DOI] [PubMed] [Google Scholar]
- 6.Zhu Y, Hu Y, Huang T, et al. High uric acid directly inhibits insulin signalling and induces insulin resistance. Biochem Bioph Res Co. 2014;447(4):707–14. doi: 10.1016/j.bbrc.2014.04.080. [DOI] [PubMed] [Google Scholar]
- 7.Zhang JX, Zhang YP, Wu QN, et al. Uric acid induces oxidative stress via an activation of the renin-angiotensin system in 3T3-L1 adipocytes. Endocrine. 2015;48:135–42. doi: 10.1007/s12020-014-0239-5. [DOI] [PubMed] [Google Scholar]
- 8.Xu C, Wan X, Xu L, et al. Xanthine oxidase in nonalcoholic fatty liver disease and hyperuricemia: One stone hits two birds. J Herpetol. 2015;62:1412–19. doi: 10.1016/j.jhep.2015.01.019. [DOI] [PubMed] [Google Scholar]
- 9.Chuengsamarn S, Rattanamongkolgul S, Jirawatnotai S. Association between serum uric acid level and microalbuminuria to chronic vascular complications in Thai patients with type 2 diabetes. J Diabetes Complicat. 1900;28:124–29. doi: 10.1016/j.jdiacomp.2013.12.002. [DOI] [PubMed] [Google Scholar]
- 10.Su P, Hong L, Zhao Y, et al. Relationship between hyperuricemia and cardiovascular disease risk factors in a Chinese population: A cross-sectional study. Med Sci Monit. 2015;21:2707–17. doi: 10.12659/MSM.895448. [DOI] [PMC free article] [PubMed] [Google Scholar]
- 11.Liu R, Han C, Wu D, et al. Prevalence of hyperuricemia and gout in mainland China from 2000 to 2014: A systematic review and meta-analysis. Biomed Res Int. 2015;2015:1–12. doi: 10.1155/2015/762820. [DOI] [PMC free article] [PubMed] [Google Scholar]
- 12.Zhang XS, Yu WG, Yu LX, et al. An epidemiologic study on hyperuricaemia and gout in residents of coastal areas of Haiyang City in Shandong. Chin J Gene Pract. 2006;5:216–19. [Google Scholar]
- 13.Ping GU. The incidence of hyperuricemia in 26621 health checkup persons in Guangzhou City and analysis of associated diseases. Chin Trop Med. 2006;6:1082–84. [Google Scholar]
- 14.Vázquez-Rodríguez JG, Rico Trejo EI. Role of uric acid in preeclampsia-eclampsia. Ginecol Obstet Mex. 2011;79:292–97. [PubMed] [Google Scholar]
- 15.Harrison R. Physiological roles of xanthine oxidoreductase. Drug Metab Rev. 2004;36:363–75. doi: 10.1081/dmr-120037569. [DOI] [PubMed] [Google Scholar]
- 16.Kurosaki M, Licalzi M, Scanziani EE, et al. Tissue and cell specific expression of mouse xanthine oxidoreductase gene in vivo – regulation by bacterial lipopolysaccharide. Biochem J. 1995;306(Pt 1):225–34. doi: 10.1042/bj3060225. [DOI] [PMC free article] [PubMed] [Google Scholar]
- 17.Harrison R. Structure and function of xanthine oxidoreductase: Where are we now? Free Radical Bio Med. 2002;33:774–80. doi: 10.1016/s0891-5849(02)00956-5. [DOI] [PubMed] [Google Scholar]
- 18.Cheung KJ, Tzameli I, Pissios P, et al. Xanthine oxidoreductase is a regulator of adipogenesis and PPARγ activity. Cell Metab. 2007;5:115–28. doi: 10.1016/j.cmet.2007.01.005. [DOI] [PubMed] [Google Scholar]
- 19.Kushiyama A, Okubo H, Sakoda H, et al. Xanthine oxidoreductase is involved in macrophage foam cell formation and atherosclerosis development. Arterioscl Throm Vas. 2012;32:291–98. doi: 10.1161/ATVBAHA.111.234559. [DOI] [PubMed] [Google Scholar]
- 20.Li Y, Lin W, Huang J, et al. Anti-cancer effects of Gynostemma pentaphyllum (Thunb.) Makino (Jiaogulan) Chin Med. 2016;11 doi: 10.1186/s13020-016-0114-9. [DOI] [PMC free article] [PubMed] [Google Scholar]
- 21.Norberg A, Hoa NK, Liepinsh E, et al. A novel insulin-releasing substance, phanoside, from the plant Gynostemma pentaphyllum. J Biolog Chem. 2004;279:41361–67. doi: 10.1074/jbc.M403435200. [DOI] [PubMed] [Google Scholar]
- 22.Zhang GL, Deng JP, Wang BH, et al. Gypenosides improve cognitive impairment induced by chronic cerebral hypoperfusion in rats by suppressing oxidative stress and astrocytic activation. Behav Pharmacol. 2011;22:633–44. doi: 10.1097/FBP.0b013e32834afef9. [DOI] [PubMed] [Google Scholar]
- 23.Huyen VTT, Phan DV, Thang P, et al. Antidiabetic effect of Gynostemma pentaphyllum tea in randomly assigned type 2 diabetic patients. Horm Metab Res. 2010;42:353–57. doi: 10.1055/s-0030-1248298. [DOI] [PubMed] [Google Scholar]
- 24.Liao C, Zheng K, Li Y, et al. Gypenoside L inhibits autophagic flux and induces cell death in human esophageal cancer cells through endoplasm reticulum stress-mediated Ca2+ release. Oncotarget. 2016;26:47387–402. doi: 10.18632/oncotarget.10159. [DOI] [PMC free article] [PubMed] [Google Scholar]
- 25.Sun H, Zheng Q. Haemolytic activities and adjuvant effect of Gynostemma pentaphyllum saponins on the immune responses to ovalbumin in mice. Phytother Res. 2005;19:895–900. doi: 10.1002/ptr.1754. [DOI] [PubMed] [Google Scholar]
- 26.Su-Hong C, Qi C, Bo L, et al. Antihypertensive effect of radix Paeoniae alba in spontaneously hypertensive rats and excessive alcohol intake and high fat diet induced hypertensive rats. Evid Based Complement Alternat Med. 2015;2015:1–8. doi: 10.1155/2015/731237. [DOI] [PMC free article] [PubMed] [Google Scholar]
- 27.Cardona F, Tinahones FJ, Collantes E, et al. Contribution of polymorphisms in the apolipoprotein AI-CIII-AIV cluster to hyperlipidaemia in patients with gout. Ann Rheum Dis. 2005;64:85–88. doi: 10.1136/ard.2003.019695. [DOI] [PMC free article] [PubMed] [Google Scholar]
- 28.Johnson RJ, Kang DH, Feig D, et al. Is there a pathogenetic role for uric acid in hypertension and cardiovascular and renal disease? Hypertension. 2003;41:1183–90. doi: 10.1161/01.HYP.0000069700.62727.C5. [DOI] [PubMed] [Google Scholar]
- 29.Bainbridge SA, Roberts JM. Uric acid as a pathogenic factor in preeclampsia. Placenta. 2008;29(Suppl A):67–72. doi: 10.1016/j.placenta.2007.11.001. [DOI] [PMC free article] [PubMed] [Google Scholar]
- 30.Zhao JM, Zhu JH, Chen H, et al. Study of hyperlipidemia model in rats on different fat emulsion. Pharmacol Chin Mater Med. 2012;28:177–80. [Google Scholar]
- 31.Ma YY, Wu YL, Zhu EW, et al. Rats hyperuricemia model established by lipid emulsion simulating irregular of diet. China J Chin Mater Med. 2015;40:2009–13. [PubMed] [Google Scholar]
- 32.Liu YW, Sun WF, Zhang XX, et al. Compound tufuling granules regulate glucose transporter 9 expression in kidney to influence serum uric acid level in hyperuricemia mice. Chin J Integr Med. 2015;21:823–29. doi: 10.1007/s11655-015-2052-2. [DOI] [PubMed] [Google Scholar]
- 33.Wu XH, Ruan JL, Zhang J, et al. Pallidifloside D, a saponin glycoside constituent from Smilax riparia, resist to hyperuricemia based on URAT1 and GLUT9 in hyperuricemic mice. J Ethnopharmacol. 2014;157:201–5. doi: 10.1016/j.jep.2014.09.034. [DOI] [PubMed] [Google Scholar]
- 34.Vázquez-Mellado J, Jiménez-Vaca AL, Cuevas-Covarrubias S, et al. Molecular analysis of the SLC22A12 (URAT1) gene in patients with primary gout. J Rheumatol. 2007;46:215–19. doi: 10.1093/rheumatology/kel205. [DOI] [PubMed] [Google Scholar]
- 35.Anzai N, Ichida K, Jutabha P, et al. Plasma urate level is directly regulated by a voltage-driven urate efflux transporter URATv1 (SLC2A9) in humans. J Biolog Chem. 2008;283:26834–38. doi: 10.1074/jbc.C800156200. [DOI] [PubMed] [Google Scholar]
- 36.Deguchi T, Kouno Y, Terasaki T, et al. Differential contributions of rOat1 (Slc22a6) and rOat3 (Slc22a8) to the in vivo renal uptake of uremic toxins in rats. Pharm Res. 2005;22:619–27. doi: 10.1007/s11095-005-2486-x. [DOI] [PubMed] [Google Scholar]
- 37.Lin Weiqing XJ. Research progress of hyperuricemia animal model. Chin Remed Clin. 2005;5:115–18. [Google Scholar]
- 38.Hille R, Nishino T. Flavoprotein structure and mechanism. 4. Xanthine oxidase and xanthine dehydrogenase. Faseb J. 1995;9:995–1003. [PubMed] [Google Scholar]
- 39.Chen CY, Lü JM, Yao Q. Hyperuricemia-related diseases and xanthine oxidoreductase (XOR) inhibitors: An overview. Med Sci Monit. 2016;22:2501–12. doi: 10.12659/MSM.899852. [DOI] [PMC free article] [PubMed] [Google Scholar]
- 40.Sørensen LB. The elimination of uric acid in man: Studies by means of C[14]-labeled uric acid: Uricolysis. Scand J Clin Lab Invest. 1959;12(Suppl):54. [Google Scholar]
- 41.Rafey MA, Lipkowitz MS, Leal-Pinto E, et al. Uric acid transport. Curr Opin Nephrol Hypertens. 2003;12(5):511–16. doi: 10.1097/00041552-200309000-00005. [DOI] [PubMed] [Google Scholar]
- 42.Enomoto A, Kimura H, Chairoungdua A, et al. Molecular identification of a renal urate anion exchanger that regulates blood urate levels. Nature. 2002;417:447–52. doi: 10.1038/nature742. [DOI] [PubMed] [Google Scholar]
- 43.Vitart V, Rudan I, Hayward C, et al. SLC2A9 is a newly identified urate transporter influencing serum urate concentration, urate excretion and gout. Nature Genet. 2008;40:437–42. doi: 10.1038/ng.106. [DOI] [PubMed] [Google Scholar]
- 44.Habu Y, Yano I, Takeuchi A, et al. Decreased activity of basolateral organic ion transports in hyperuricemic rat kidney: Roles of organic ion transporters, rOAT1, rOAT3 and rOCT2. Biochem Pharmacol. 2003;66:1107–14. doi: 10.1016/s0006-2952(03)00466-0. [DOI] [PubMed] [Google Scholar]
- 45.Campbell PN. In: Principles of biochemistry. second edition. Lehninger AL, Nelson DL, Cox MM, editors. Worth, New York: 1993. p. 1013. £30. [Google Scholar]; Biochem Mol Biol Edu. 1993;21:114. [Google Scholar]