

Abstract
The detection of orthologs is a key approach in genomics, useful to understand gene evolution and phylogenetic relationships and essential for gene function prediction. However, a reliable annotation of the encoded protein regions is still a limiting aspect in genomics, mainly due to the lack of confirmatory experimental evidence at proteome level. Nevertheless, the current ortholog collections are generally based on protein sequence comparisons, in addition to the availability of large transcriptome sequence collections. We developed Transcriptologs, a method for the prediction of orthologs based on similarities of translated fragments from messenger RNAs of 2 species. We implemented a procedure to extend BLAST-based alignments and to define orthologs based on the Bidirectional Best Hit approach. Results from a test case on Arabidopsis thaliana and Sorghum bicolor transcript collections revealed in some cases outperformance of Transcriptologs in comparison with a classical protein-based analysis in terms of alignment quality, revealing similarities otherwise not detectable.
Keywords: Functional genomics, sequence analysis, RNA, proteins
Introduction
The detection of ortholog genes is a relevant issue in molecular biology useful for structure, functional, and evolutionary inferences.1–14 Ortholog genes, ie, 2 gene copies from 2 different species that derived from a common ancestor and that diverged after a speciation event, are usually investigated for a wide range of applications in comparative genomics, phylogenetic analysis, genome annotation, and function prediction.4,15 In particular, it is common to investigate orthology relationships based on sequence similarities for transferring functional information from model organisms to still uncharacterized genes in newly sequenced genomes.16–18 These efforts pave the way for understanding speciation and gain loss of gene functionalities, highlighting peculiarities or conservation among species. The increasing number of fully sequenced genomes further pushed the flourishing of computational methods to detect orthol-ogs1,2,5,6,10,13–15,17,19–22 and to identify blocks of syntenic regions among species.23–28 Most of the approaches for inferring orthology can be grouped into graph-based methods, which define orthologs based exclusively on sequence similarity, or tree-based methods, which classify all the splits of a given gene tree as duplication or speciation, trying to reconcile the splits to the phylogeny of the analyzed species.8,21,22 Graph-based methods include 2 steps: first, pairs of ortholog genes are detected, and graphs, with nodes representing genes and edges representing relationships, are defined; second, clusters of ortholog genes are organized based on the structure of the graphs. The simplest approaches identify orthologs between genes in pair of genomes.29 The key assumption is that orthologs are those genes among homologs with the minimum divergence. Orthologs from 2 genomes are all those genes detected as being the reciprocal best hit of each other.19,30,31 This widespread methodology is generally defined as the search for the Bidirectional Best Hit (BBH). It establishes that genes xi and yj, from species X and Y, are best putative orthologs if xi is the best hit of yj, and yj is the best hit of xi, when considering all versus all similarity searches.32 The BBH detection between 2 genomes is computationally efficient because sequence alignments can be computed by well-established approaches, either based on dynamic programming33 or on more efficient heuristic algorithms, such as the BLAST set of programs.34 The BBH detection has some constraints. Some genes in a species can have more than 1 ortholog with another species. This can reflect a gene duplication after a speciation event, whereas the ortholog counterpart in the other genome remains in single copy, namely, a singleton gene.35 Remm et al36 referred to these duplicated genes after a speciation event as in-paralogs, developing a dedicated algorithm for their detection called Inparanoid. Another approach for detecting the in-paralogs consists in the implementation of a similarity threshold or a confidence range around the best score between BBHs to define groups of best hits, the extended BBHs (eBBHs), to identify one-to-many or many-to-many orthologs.3,37
Another constraint of graph-based methods includes the limit of working with only 2 species at a time and of not being effective for large evolutionary distances31 because low sequence similarities may not be detected at all. However, although tree-based methods can work on more species and provide more information than pairs or groups of orthologs, such as evolutionary distances and the order of duplication and speciation events, these methods are computationally much more expensive than graph-based algorithms.22,29 Moreover, they may be less reliable when large evolutionary distances occur.
The BBH detection is faster and easy to automate when based on heuristic approaches.22 To compare results from graph-based methods and tree-based ones, statistical approaches were considered.7,8,15,21,38 By these measures, none of the 2 methods revealed to be optimal. Overall, many BBH algorithms reached higher sensitivity at the cost of specificity, whereas the tree-based methods showed the opposite trend. At short evolutionary distances, instead, graph-based methods and tree-based methods produced similar sets of orthologs.22 A recent study,15 however, showed that sometimes more complex tree reconstruction/reconciliation methods are outperformed by pairwise comparison approaches such as BBH. This suggests that tree reconciliation, although more specific in theory, does not reveal to be the best methodology in practice. These issues probably explain why many people prefer to use simple BBH implementations rather than a more complex tree-based approach.15,22
Protein sequences have been the widespread exploited reference to identify orthology relationships, mainly because these analyses are useful to find functional counterparts among species. However, orthology should refer to evolutionary relationships traceable at genome level. Similarity at protein sequence level does not always represent similarity at gene level. Indeed, it does not permit to exploit similarities embedded in untranslated regions (UTRs), or may lead to misinterpretations due to open reading frame (ORF) misassignments, difficult to be detected because of the lack of consistent confirmatory data at proteome level, or to sequencing errors. In a study by Trachana et al,39 gene annotation emerged as the largest single influencer of the quality of orthology detection procedures, affecting up to 30% of the performance of these methods.
To overcome the limitations due to the poor quality of protein sequence predictions, especially in preliminary gene annotations, we developed Transcriptologs, a method for the detection of orthologs based on transcript references.
We tested our approach considering 2 plant species, Arabidopsis thaliana40 and Sorghum bicolor,41 both endowed with well-established gene annotations. To accomplish the task, protein-based ortholog collections from the same genome release versions of the 2 species were also considered and the quality of currently available database resources was assessed.5,11
Materials and Methods
Data sets
Transcriptome and proteome collections for A. thaliana (release TAIR 10) and S. bicolor (release JGI 1.4) were downloaded from the TAIR42 and the JGI43 genome source websites, respectively. Moreover, the ortholog gene collections between A. thaliana and S. bicolor were downloaded from the Ensembl Plant BioMart5 and PLAZA best hits and in-paralogs collection.11
Similarity detection
Reciprocal all-against-all sequence similarity searches of the protein and messenger RNA (mRNA) collections of the 2 species were performed using the BLASTp and tBLASTx programs of the BLAST package,44 respectively. The analysis was performed fixing the Expect-value (E-value, E) cutoff at 10−3.
Moreover, an all-against-all protein sequence similarity search using the BLASTp program was performed to validate and compare the results from simple BLASTp-based comparisons and reference ortholog databases. A less stringent E-value cutoff at 1000 was used to include even low similarity in the assignment of reciprocal hits.
Algorithm description
To identify BBHs and eBBHs based on transcript collections, we developed Transcriptologs, a dedicated method consisting of 2 procedures, namely, alignment_reconstruction (Figure 1) and BBH (Figure 2), implemented by the Python Programming Language (v3.3.3).
Figure 1.
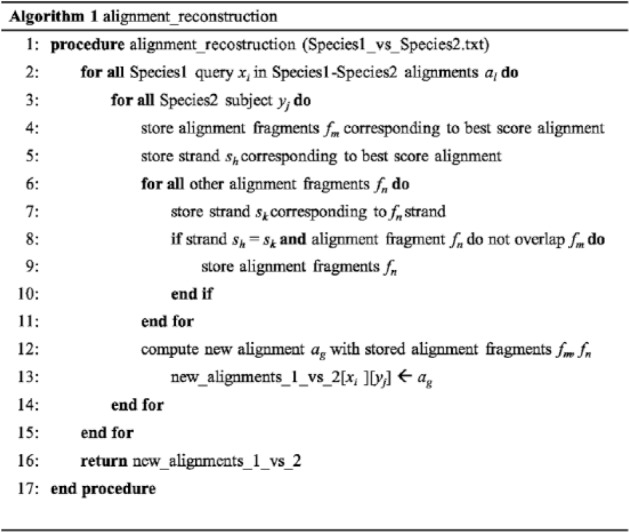
Pseudocode of the alignment reconstruction algorithm we developed.
Figure 2.
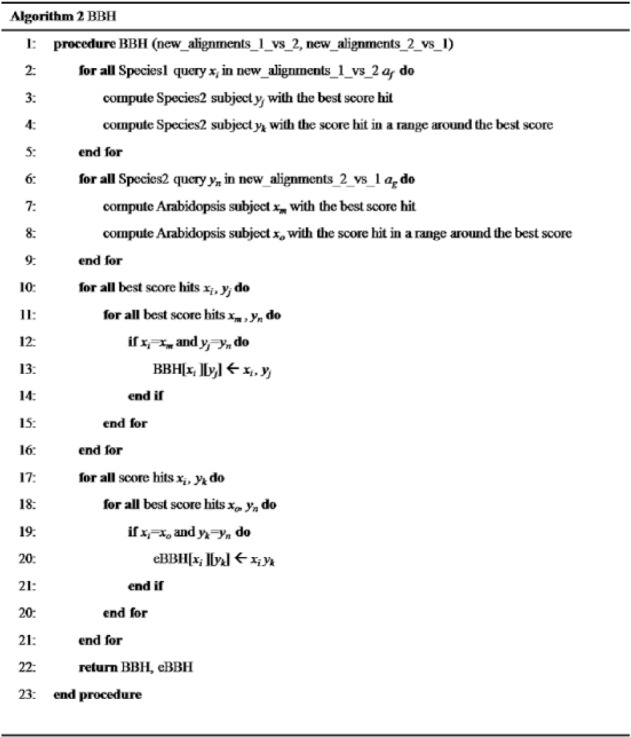
Pseudocode of BBH algorithm we developed. BBH indicates Bidirectional Best Hit; eBBH, extended BBH.
The method considers the 2 resulting files from the reciprocal tBLASTx transcript similarity searches (eg, Species1_vs_Species2.txt and Species2_vs_Species1.txt). The tBLASTx results may include possible different alignments between a query sequence xi and a subject sequence yj from the set of sequences X and Y of the 2 species under comparison, each alignment defined by different fragments fm all belonging to the same frame. To define more extended alignments, we designed a dedicated procedure (alignment_reconstruction, Figure 1) that selects the alignment fragments corresponding to the best scored alignment and then adds other fragments from alignments from different reading frames on the same strand sh, if present. The fragments are added exclusively if they do not overlap regions already considered in the procedure of alignment reconstruction (Figure 3). The score of the extended final alignment is defined as the sum of the scores of the single alignment fragments added during the reconstruction.
Figure 3.

Improvement example of the total alignment length. If we have to align 2 sequences AT1G50940.1 and Sb01g002210.2 (highlighted in green), the tBLASTx program provides different alignment fragments (highlighted in gray), each one corresponding to a given reading frame (highlighted in red) of the 2 sequences. In this example, the algorithm we designed is able to rebuild an entire alignment using an alignment fragment with a reading frame of +3/+1 and an alignment fragment with a reading frame of +2/+3 because they do not share overlapping segments of the aligned sequences.
When selecting reciprocal hits, we also implemented the possibility to set a tolerance threshold around the score associated with the BBH to define eBBHs. This permits to define other sequences yk which are similar, in an established range, to the query sequence xi. Therefore, the method can detect not only the best hit that is bidirectional but also other bidirectional hits with score in preferred ranges from the best one (Figure 2). Transcriptologs software is free and available at https://github.com/LucaAmbrosino/Transcriptologs.git.
Results and Discussion
Comparison of reference databases
To compare the orthology relationships available from reference ortholog collections, namely, Ensembl Plant BioMart5 and PLAZA,11 with those from a simple BLASTp analysis, we performed a protein-based all-against-all similarity search between A. thaliana and S. bicolor collections, setting a loose E-value cutoff (1000) to include all the possible reciprocal similarities. The results are summarized in Figure 4. Considering the Arabidopsis genes that showed a relationship with a Sorghum counterpart, the in-house BLASTp results included all the genes detected by both BioMart and PLAZA (Figure 4A). Considering the Sorghum genes related to an Arabidopsis counterpart (Figure 4B), there was a significant number of genes that were detected as orthologs among the 3 collections (15 515). However, 117 genes from Sorghum were detected exclusively by BioMart, 2806 genes were detected only by PLAZA, and 711 genes were detected in both databases, although they were not detected by the BLASTp analysis. A similar behavior resulted also when considering the exact relationships between 2 transcript sequences (Figure 4C). In total, 1323 relationships were detected exclusively by BioMart, 13 469 were detected exclusively by PLAZA, and 909 were detected by both collections but not by the BLASTp analysis. Moreover, due to the loose stringency of the E-value threshold used in our analysis, it came out that a huge number of relationships were detected only by the BLASTp analysis (6 830 728, Figure 4C). Filtering out only significant matches from the BLASTp collection by setting an E-value cutoff at 10−100, a very large number (65 996) of relationships still held as exclusively detected by the BLASTp analysis.
Figure 4.
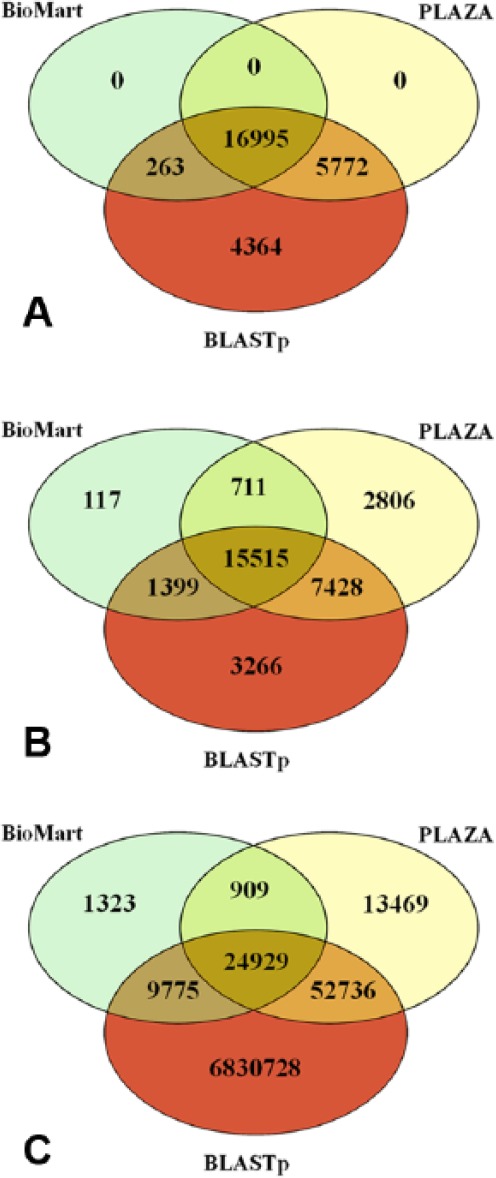
Comparison of results detected by BioMart, PLAZA, and an in-house BLASTp analysis. Venn diagram showing (A) the number of Arabidopsis genes that have a relationship with a Sorghum counterpart, (B) the number of Sorghum genes that have a relationship with an Arabidopsis gene, and (C) the number of exact relationships between Arabidopsis and Sorghum genes.
Although the looser BLASTp E-value cutoff was set to include all the possible relationships among the respective protein sequence collections, interestingly, they were not covering all of the ones described in the considered databases. However, we detected a huge amount of relationships with very high significant E-values (E ⩽ 10−100), which were not found in the results from public collections of orthologs. The comparison here presented highlights that ortholog collections available in open-access databases, although all based on similarity levels among protein sequences, are quite heterogeneous, and they could not be confirmed by simple similarity searches. The limited reproducibility of the results from publicly available collections affects their role as references and requires methods to appropriately address the reliability of the single relationships.
Orthology inference
Transcriptologs results were compared with protein-based sequence similarity searches performing all-against-all independent analyses. Protein sequences (BLASTp) and translated mRNA (tBLASTx) sequences were both analyzed setting an E-value cutoff at 10−3.
We considered translated nucleotide because the protein similarity scoring is more sensitive than the nucleotide-based one. Moreover, the results could be appropriately compared with results from classical protein-based approaches. In addition, this approach would also assess similarity between 2 sequences in the presence of frameshifts due to sequencing errors, annotation limits, or true evolutionary divergence.
For each detected pair of query-subject hit, the tBLASTx provides a list of alignment fragments grouped by frame, corresponding to different alignments with an associated score. The alignment reconstruction algorithm (Figure 1) attempts to reconstruct the most extended alignment between the 2 mRNAs. Indeed, the algorithm collects all the fragments with the same reading frame originated from the BLAST best score alignment. Then, it adds fragments coming from different reading frames as long as they are on the same strand, and they do not overlap the already collected ones. The new alignments and their scores, defined by the sum of the scores of the contributing fragments, are the final results of the alignment reconstruction algorithm.
In the example test we considered, the resulting 82 721 tBLASTx alignments out of 1 181 628 total matches (Table 1) were reconstructed adding at least 1 alignment fragment among those included in the tBLASTx original output. The improved algorithm led to an increase in (a) the average score values of about 54 units compared with the original tBLASTx output, (b) the average number of alignment fragments forming the final complete alignment, (c) the average number of identity matches, and (d) the average alignment length (Table 1).
Table 1.
Comparison of results from tBLASTx and Transcriptologs.
| Normal algorithm | Modified algorithm | Δ (Modified algorithm − normal) | |
|---|---|---|---|
| Score | 200.02 | 254.73 | +54.71 |
| No. of fragments | 2.60 | 4.00 | +1.40 |
| Identity | 112.05 | 142.83 | +30.78 |
| Alignment length | 167.77 | 217.36 | +49.59 |
Mean values of the score, number of fragments, number of identities matches, and alignment length, related to the alignments that were refined by our implementation, are shown.
Subsequently, BBHs between A thaliana and S bicolor were detected using results from the protein- and transcript-based reciprocal BLAST results, respectively. In detail, 11 284 BBHs were detected using protein sequences, whereas 11 235 BBHs were detected using mRNA sequences, with 8674 common results (Figure 5B). Moreover, 2610 BBHs were exclusively detected by the protein-based analysis, whereas 2561 BBHs were exclusively from transcript sequences (Figure 5B). Figure 6 shows the distribution of the scores and E-values of the alignments of these 2 specific BBH data sets. We evaluated the quality of the resulting alignments by considering the score and the E-value of each alignment. Because the score is a numerical value used to assess the biological relevance of a finding, while the E-value associated with a score expresses the probability to obtain that score by chance, the lower the E-value, the more the alignment is significant. Figure 6A and C shows that the scores of tBLASTx BBHs, although generally comparable with those of BLASTp BBHs, reached higher figures (in the upper right of Figure 6A). A similar behavior was confirmed by the E-value distribution (Figure 6B and D), where the number of less significant E-values of some of the BLASTp BBHs was larger (Figure 6B and D).
Figure 5.
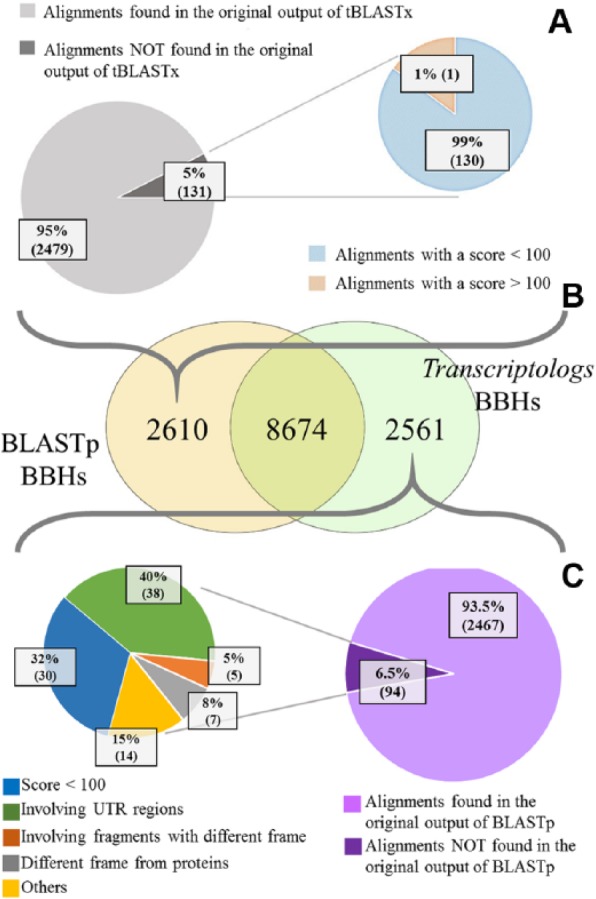
Comparison between Transcriptologs and BLASTp analyses. (A) Pie charts showing some features of BBHs detected only using protein sequences. (B) Venn diagram showing differences and similarities in the number of BBHs detected using protein sequences and transcript sequences. (C) Pie charts showing some features of BBHs detected only using transcript sequences. In the pie chart on the left, the number of alignments that involve UTRs is shown in green, the number of alignments obtained from at least 2 fragments having different reading frames between them is shown in orange, the number of alignments with a different reading frame in comparison with the predicted proteins is shown in gray, the number of alignments with a similarity score less than 100 is shown in blue, and the remaining number of alignments is shown in yellow. BBHs indicates Bidirectional Best Hits; UTRs, untranslated regions.
Figure 6.

Comparison between Transcriptologs and protein Bidirectional Best Hits (BBHs). Distribution of the (A) BBH scores detected only using transcript sequences, (B) BBH E-values detected only using transcript sequences, (C) BBH scores detected only using protein sequences, and (D) BBH E-values detected only using protein sequences.
Then, among the BBHs exclusively detected by the BLASTp (2610 matches) and by the tBLASTx (2561 matches) methods, we considered the cases in which the same Arabidopsis gene found a different Sorghum ortholog when considering the transcript-based comparison or the protein-based comparison (Figure 7A), and vice versa (Figure 7B). Plotting the score distribution of the corresponding alignments based on the 2 different approaches, we noticed higher scores of the similarities detected by tBLASTx considering the 2 species (Figure 7). This highlighted that transcript-based comparisons detect alignments with a higher score when compared with the ones obtained from protein sequences, finding more valuable associations. As an example, the dot highlighted in Figure 7A by an arrow indicates the score of an A. thaliana gene matching the corresponding BBH in S. bicolor using transcripts (on the “y”-axis) or protein sequences (on the “x”-axis). Figure 8 shows that the similarity between the 2 genes at transcript level lies in a different region of the same reading frame. Interestingly, this region corresponds to a different ORF, longer in comparison with the ORF associated with the protein involved in the protein-based alignment. It is out of the scope of this article to assess whether the protein-coding region reported in this gene annotation may represent a misassigned ORF. Nevertheless, the ortholog detected at transcript level is different from the one at protein level because of a longer aligned region sharing a higher similarity. The ortholog detected at transcript level represents a more appropriate result because the similarity for determining the BBH should be assessed on the overall nucleotide region.
Figure 7.
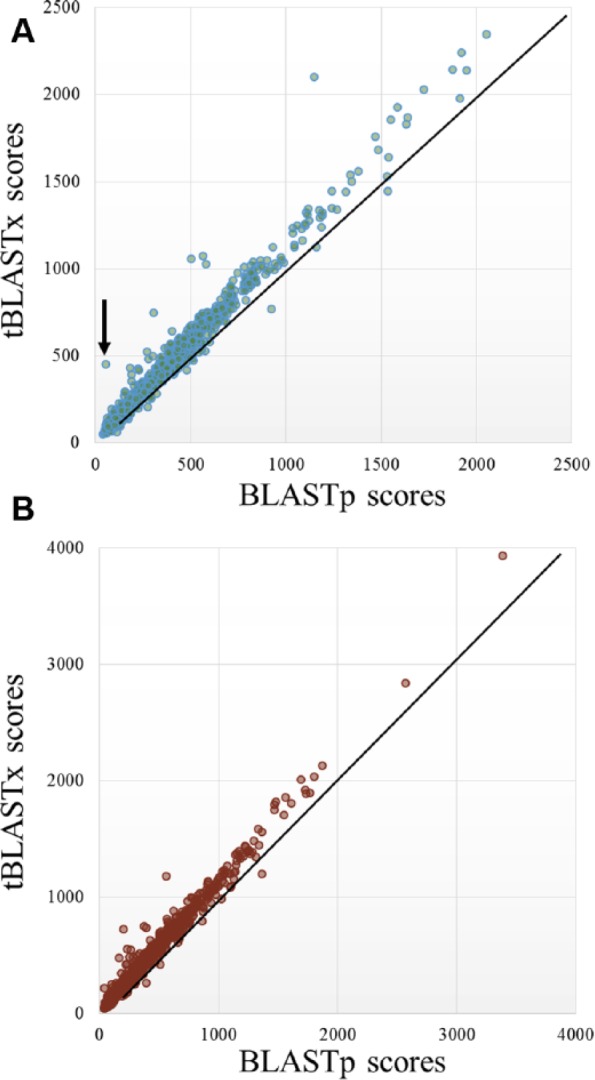
Comparison between Transcriptologs and protein BBHs. Distribution of the BBH scores detected exclusively using transcript and protein sequences, involving (A) the same Arabidopsis thaliana gene (example of an outlier is pointed by a black arrow) and (B) the same Sorghum bicolor gene.
Figure 8.
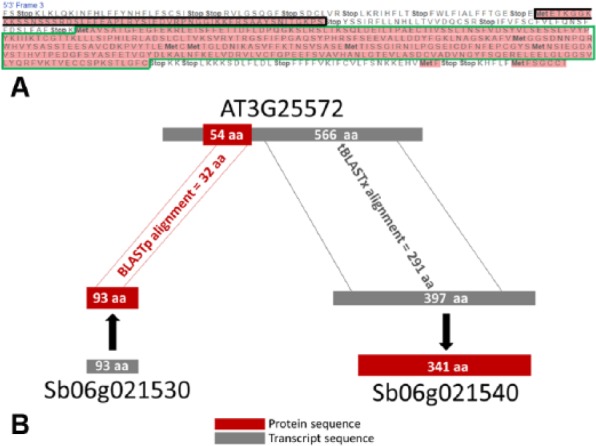
Example of improved similarity detection based on transcript. (A) Arabidopsis thaliana AT3G25572 translated transcript sequence on the frame +3. The protein sequence region released by the TAIR official annotation is highlighted by a black line, and the longest ORF is highlighted by a green line. (B) Schematic view of alignments between the transcript (in gray) and the protein (in red) regions and Sb06g021540 and Sb06g021530 genes, respectively, these 2 representing the BBHs of the Arabidopsis gene AT3G25572, based on transcript or protein similarity; transcripts and proteins alignments lengths (291 aa and 32 aa) are shown as number of amino acids.
In detail, most of the protein BBHs (2479 on 2610) were detected also by the tBLASTx analysis before the selection of the BBHs (Figure 5A and B). Indeed, they were not selected because they were not best reciprocal hits. However, these relationships would have been detected by the method by setting a tolerance threshold around the best hit. However, 131 relationships within these BBHs exclusively detected starting from protein sequences were not found by the similarity search based on transcript sequences (Figure 5A). Interestingly, only in 1 case, the score resulted higher than 100, highlighting the minor relevance of the lost alignments associated with the protein-based approach.
Next, considering details of the transcript BBHs, most of them (2467 on 2561) were included in the results from the BLASTp analysis (Figure 5B and C). Also in this case, a small group of relationships (94) were not found by the similarity search based on protein sequences (Figure 5C). Among them, 78% (64 of 94 matches) had a score higher than 100, indicating relevant similarities to be considered for the BBH definition. To further investigate the reasons of the lack of relationships detected at protein sequence level, we deeply analyzed these 64 matches. We observed that (a) 38 matches had extended alignments when compared with those from proteins because they involved UTRs and (b) 12 alignments involved reading frames not corresponding to the annotated protein-coding regions. Specifically, 7 alignments involved alternative reading frames when compared with the expected protein-coding ones, probably solving an error in the protein prediction, whereas 5 alignments were reconstructed with fragments from different reading frames (Figure 5C). These results highlight that the BBHs based on transcript sequences show an overall better assessment of the sequence similarity of the involved genes. In addition, the presence of these 94 alignments exclusively detected by the transcript-based approach was cross-checked with results from public ortholog databases, namely, PLAZA11 and BioMart.5 Despite both databases containing orthologs, the methods used for their detection are different and not exclusively based on the comparison of protein sequences, such as the tree reconciliation of the phylogenetic tree of a gene family in PLAZA or directly the genome comparison in BioMart. In total, 22 orthologs in PLAZA and 21 alignments in BioMart out of 94 found confirmation, in which 16 are common to both resources. This highlights that the transcript-based approach is sensitive as more complex approaches as the ones just cited.
Conclusions
In this work, we presented Transcriptologs, a method for the identification of orthologs exploiting transcript sequences. The Transcriptologs represent orthologs detected by BBHs defined based on revisited tBLASTx results.
As a case study, we tested Transcriptologs to define ortholog genes between A. thaliana and S. bicolor because reference annotations as well as ortholog collections from several external resources are available for these species.
Transcriptologs was implemented for a straightforward exploitation of transcript sequences because of the widespread sequencing of transcriptomes and, therefore, the higher reliability of the transcript region in comparison with protein sequences, which are usually predicted based on similarity and/or ORF detection. Indeed, large-scale definition of transcript sequences is today easily achievable, thanks to classical (expressed sequence tag sequencing) and novel (RNAseq) technologies in comparison with proteome sequencing. Moreover, the revisiting of tBLASTx output performed by Transcriptologs overcomes possible limits in the definition of the correct coding frame. The method also exploits a wider region for the detection of similarities, including the UTRs. Therefore, as demonstrated here, it has a higher sensitivity in the detection of the BBHs.
Although classical approaches and publicly available collections are based on protein sequence similarity searches, we first showed the heterogeneity of the collections available today, including results that are often incomparable. Then, considering the E-value of an alignment between 2 sequences as a surrogate of the alignment quality, we showed that orthology relationships available from these collections can neither be comparable nor can be interpreted based on a BLAST similarity search.
We compared the results from protein-based BBHs and transcript-based BBHs, and we investigated on the main differences between them. We highlighted that similarity searches at transcript level can lead to different results when compared with protein-based analyses. In particular, considering the quality of the alignments, we assert that orthologs detected using transcriptomic data have higher scoring, taking advantages of reconstructed alignments that are extended along the transcripts, including also regions with different coding frames. The proposed approach may also overcome sequencing errors and possible limits in the detection of similarities that could be hidden at protein level. The method may integrate classical approaches because it confirms results from previous ortholog collections based on protein sequences and it can highlight new relationships, thanks to the exploitation of a higher information content.
Moreover, Transcriptologs can support a widespread analytical approach, such as the ortholog detection, exploiting more accessible and reliable data, such as those from transcript sequences. In the era of fast genome and transcript sequencing, draft gene annotations are often released without consistently undergoing human curation. Although these efforts are usually supported by incredible enrichment of transcriptome data sets, the proteome complement is still limited, and alternative approaches for ortholog detection may lead to results that are more reliable.
Acknowledgments
The authors thank the anonymous reviewers for their comments and suggestions, which were helpful in improving the manuscript. This work is the frame of the Cost Action FA1106 and of the Genopom Pro and HORT Projects (Ministero dell’Istruzione, dell’Università e della Ricerca [MIUR], Italy).
Footnotes
Peer review:Seven peer reviewers contributed to the peer review report. Reviewers’ reports totaled 2116 words, excluding any confidential comments to the academic editor.
Funding:The author(s) disclosed receipt of the following financial support for the research, authorship, and/or publication of this article: This work was supported by the Genopom Pro and HORT Projects (Ministero dell’Istruzione, dell’Università e della Ricerca [MIUR], Italy).
Declaration of conflicting interests:The author(s) declared no potential conflicts of interest with respect to the research, authorship, and/or publication of this article.
Author Contributions: LA developed the method and analyzed the data. MLC conceived the approach and directed all the work. Both the authors participated in the study and wrote the manuscript. Both the authors approved the final version of the manuscript.
Disclosures and Ethics: As a requirement of publication, author(s) have provided to the publisher signed confirmation of compliance with legal and ethical obligations including, but not limited to, the following: authorship and contributorship, conflicts of interest, privacy and confidentiality, and (where applicable) protection of human and animal research subjects. The authors have read and confirmed their agreement with the ICMJE authorship and conflict of interest criteria. The authors have also confirmed that this article is unique and not under consideration or published in any other publication, and that they have permission from rights holders to reproduce any copyrighted material. Any disclosures are made in this section. The external blind peer reviewers report no conflicts of interest.
References
- 1. Altenhoff AM, Schneider A, Gonnet GH, Dessimoz C. OMA 2011: orthology inference among 1000 complete genomes. Nucleic Acids Res. 2011;39:D289–D294. [DOI] [PMC free article] [PubMed] [Google Scholar]
- 2. Chen F, Mackey AJ, Stoeckert CJ, Jr, Roos DS. OrthoMCL-DB: querying a comprehensive multi-species collection of ortholog groups. Nucleic Acids Res. 2006;34:D363–D368. [DOI] [PMC free article] [PubMed] [Google Scholar]
- 3. Dessimoz C, Cannarozzi G, Gil M, et al. OMA, a comprehensive, automated project for the identification of orthologs from complete genome data: introduction and first achievements. Comp Genom. 2005;2005:61–72. [Google Scholar]
- 4. Dessimoz C, Gabaldon T, Roos DS, Sonnhammer EL, Herrero J. Toward community standards in the quest for orthologs. Bioinformatics (Oxford, England). 2012;28:900–904. [DOI] [PMC free article] [PubMed] [Google Scholar]
- 5. Flicek P, Ahmed I, Amode MR, et al. Ensembl 2013. Nucleic Acids Res. 2013;41:D48–D55. [DOI] [PMC free article] [PubMed] [Google Scholar]
- 6. Huerta-Cepas J, Capella-Gutierrez S, Pryszcz LP, Marcet-Houben M, Gabaldon T. PhylomeDB v4: zooming into the plurality of evolutionary histories of a genome. Nucleic Acids Res. 2014;42:D897–D902. [DOI] [PMC free article] [PubMed] [Google Scholar]
- 7. Hulsen T, Huynen MA, de Vlieg J, Groenen PM. Benchmarking ortholog identification methods using functional genomics data. Genome Biol. 2006;7:R31. [DOI] [PMC free article] [PubMed] [Google Scholar]
- 8. Kuzniar A, van Ham RC, Pongor S, Leunissen JA. The quest for orthologs: finding the corresponding gene across genomes. Trends Genet. 2008;24:539–551. [DOI] [PubMed] [Google Scholar]
- 9. O’Brien KP, Remm M, Sonnhammer EL. Inparanoid: a comprehensive database of eukaryotic orthologs. Nucleic Acids Res. 2005;33:D476–D480. [DOI] [PMC free article] [PubMed] [Google Scholar]
- 10. Powell S, Forslund K, Szklarczyk D, et al. eggNOG v4.0: nested orthology inference across 3686 organisms. Nucleic Acids Res. 2014;42:D231–D239. [DOI] [PMC free article] [PubMed] [Google Scholar]
- 11. Proost S, Van Bel M, Sterck L, et al. PLAZA: a comparative genomics resource to study gene and genome evolution in plants. Plant Cell. 2009;21:3718–3731. [DOI] [PMC free article] [PubMed] [Google Scholar]
- 12. Rouard M, Guignon V, Aluome C, et al. GreenPhylDB v2.0: comparative and functional genomics in plants. Nucleic Acids Res. 2011;39:D1095–D1102. [DOI] [PMC free article] [PubMed] [Google Scholar]
- 13. Schreiber F, Patricio M, Muffato M, Pignatelli M, Bateman A. TreeFam v9: a new website, more species and orthology-on-the-fly. Nucleic Acids Res. 2014;42:D922–D925. [DOI] [PMC free article] [PubMed] [Google Scholar]
- 14. Waterhouse RM, Tegenfeldt F, Li J, Zdobnov EM, Kriventseva EV. OrthoDB: a hierarchical catalog of animal, fungal and bacterial orthologs. Nucleic Acids Res. 2013;41:D358–D365. [DOI] [PMC free article] [PubMed] [Google Scholar]
- 15. Altenhoff AM, Dessimoz C. Phylogenetic and functional assessment of orthologs inference projects and methods. PLoS Comput Biol. 2009;5:e1000262. [DOI] [PMC free article] [PubMed] [Google Scholar]
- 16. Dolinski K, Botstein D. Orthology and functional conservation in eukaryotes. Annu Rev Genet. 2007;41:465–507. [DOI] [PubMed] [Google Scholar]
- 17. Koonin EV. Orthologs, paralogs, and evolutionary genomics. Annu Rev Genet. 2005;39:309–338. [DOI] [PubMed] [Google Scholar]
- 18. Sonnhammer EL, Koonin EV. Orthology, paralogy and proposed classification for paralog subtypes. Trends Genet. 2002;18:619–620. [DOI] [PubMed] [Google Scholar]
- 19. Tatusov RL, Koonin EV, Lipman DJ. A genomic perspective on protein families. Science. 1997;278:631–637. [DOI] [PubMed] [Google Scholar]
- 20. Alexeyenko A, Lindberg J, Pérez-Bercoff Å, Sonnhammer ELL. Overview and comparison of ortholog databases. Drug Discov Today Technol. 2006;3:137–143. [DOI] [PubMed] [Google Scholar]
- 21. Gabaldon T. Large-scale assignment of orthology: back to phylogenetics? Genome Biol. 2008;9:235. [DOI] [PMC free article] [PubMed] [Google Scholar]
- 22. Kristensen DM, Wolf YI, Mushegian AR, Koonin EV. Computational methods for Gene Orthology inference. Brief Bioinform. 2011;12:379–391. [DOI] [PMC free article] [PubMed] [Google Scholar]
- 23. Ghiurcuta CG, Moret BM. Evaluating synteny for improved comparative studies. Bioinformatics (Oxford, England). 2014;30:i9–i18. [DOI] [PMC free article] [PubMed] [Google Scholar]
- 24. Lechner M, Hernandez-Rosales M, Doerr D, et al. Orthology detection combining clustering and synteny for very large datasets. PLoS ONE. 2014;9:e105015. [DOI] [PMC free article] [PubMed] [Google Scholar]
- 25. Semeria M, Tannier E, Gueguen L. Probabilistic modeling of the evolution of gene synteny within reconciled phylogenies. BMC Bioinformatics. 2015;16:S5. [DOI] [PMC free article] [PubMed] [Google Scholar]
- 26. Anselmetti Y, Berry V, Chauve C, Chateau A, Tannier E, Berard S. Ancestral gene synteny reconstruction improves extant species scaffolding. BMC Genomics. 2015;16:S11. [DOI] [PMC free article] [PubMed] [Google Scholar]
- 27. Drillon G, Fischer G. Comparative study on synteny between yeasts and vertebrates. C R Biol. 2011;334:629–638. [DOI] [PubMed] [Google Scholar]
- 28. Delseny M. Re-evaluating the relevance of ancestral shared synteny as a tool for crop improvement. Curr Opin Plant Biol. 2004;7:126–131. [DOI] [PubMed] [Google Scholar]
- 29. Altenhoff AM, Dessimoz C. Inferring orthology and paralogy. Methods Mol Biol (Clifton, N.J.). 2012;855:259–279. [DOI] [PubMed] [Google Scholar]
- 30. Hughes AL. Gene duplication and the origin of novel proteins. Proc Natl Acad Sci U S A. 2005;102:8791–8792. [DOI] [PMC free article] [PubMed] [Google Scholar]
- 31. Huynen MA, Bork P. Measuring genome evolution. Proc Natl Acad Sci U S A. 1998;95:5849–5856. [DOI] [PMC free article] [PubMed] [Google Scholar]
- 32. Overbeek R, Fonstein M, D’Souza M, Pusch GD, Maltsev N. The use of gene clusters to infer functional coupling. Proc Natl Acad Sci U S A. 1999;96:2896–2901. [DOI] [PMC free article] [PubMed] [Google Scholar]
- 33. Smith TF, Waterman MS. Identification of common molecular subsequences. J Mol Biol. 1981;147:195–197. [DOI] [PubMed] [Google Scholar]
- 34. Moreno-Hagelsieb G, Latimer K. Choosing BLAST options for better detection of orthologs as reciprocal best hits. Bioinformatics (Oxford, England). 2008;24:319–324. [DOI] [PubMed] [Google Scholar]
- 35. Sangiovanni M, Vigilante A, Chiusano ML. Exploiting a reference genome in terms of duplications: the network of paralogs and single copy genes in Arabidopsis thaliana. Biology. 2013;2:1465–1487. [DOI] [PMC free article] [PubMed] [Google Scholar]
- 36. Remm M, Storm CE, Sonnhammer EL. Automatic clustering of orthologs and in-paralogs from pairwise species comparisons. J Mol Biol. 2001;314:1041–1052. [DOI] [PubMed] [Google Scholar]
- 37. Fulton DL, Li YY, Laird MR, Horsman BG, Roche FM, Brinkman FS. Improving the specificity of high-throughput ortholog prediction. BMC Bioinformatics. 2006;7:270. [DOI] [PMC free article] [PubMed] [Google Scholar]
- 38. Chen F, Mackey AJ, Vermunt JK, Roos DS. Assessing performance of orthology detection strategies applied to eukaryotic genomes. PLoS ONE. 2007;2:e383. [DOI] [PMC free article] [PubMed] [Google Scholar]
- 39. Trachana K, Larsson TA, Powell S, et al. Orthology prediction methods: a quality assessment using curated protein families. Bioessays. 2011;33:769–780. [DOI] [PMC free article] [PubMed] [Google Scholar]
- 40. The Arabidopsis Genome Initiative. Analysis of the genome sequence of the flowering plant Arabidopsis thaliana. Nature. 2000;408:796–815. [DOI] [PubMed] [Google Scholar]
- 41. Paterson AH, Bowers JE, Bruggmann R, et al. The Sorghum bicolor genome and the diversification of grasses. Nature. 2009;457:551–556. [DOI] [PubMed] [Google Scholar]
- 42. The Arabidopsis Information Resource (TAIR). http://www.arabidopsis.org/. Published 2011.
- 43. Joint Genome Institute (JGI). ftp://ftp.jgi-psf.org/pub/JGI_data/Sorghum_bicolor/v1.0/Sbi/annotation/Sbi1.4/. Published 2008.
- 44. Camacho C, Coulouris G, Avagyan V, et al. BLAST+: architecture and applications. BMC Bioinformatics. 2009;10:421. [DOI] [PMC free article] [PubMed] [Google Scholar]