Abstract
While many mouse models of hearing loss have been described, a significant fraction of the genetic defects in these models affect both the inner ear and middle ears. A common method used to separate inner-ear (sensory-neural) from middle-ear (conductive) pathologies in the hearing clinic is the combination of air-conduction and bone-conduction audiometry. In this report, we investigate the use of air- and bone-conducted evoked auditory brainstem responses to perform a similar separation in mice. We describe a technique by which we stimulate the mouse ear both acoustically and via whole-head vibration. We investigate the sensitivity of this technique to conductive hearing loss by introducing middle-ear lesions in normal hearing mice. We also use the technique to investigate the presence of an age-related conductive hearing loss in a common mouse model of presbycusis, the BALB/c mouse.
Keywords: air conduction, bone conduction, air-bone gap, presbycusis
1. Introduction
The identification of the conductive component in hearing loss in humans is achieved by the standard audiologic method of comparing an individual’s sensitivity to air-conducted (AC) and bone-conducted (BC) sounds (e.g. Schlauch and Nelson 2009). In animal models of hearing loss, such methods require the development of techniques for AC and BC stimulation, as well as the definition of standard thresholds to both stimuli for each species or strain. A previous method of BC stimulation in mice (Steel et al. 1987) has not been well accepted, and other techniques have been used to attempt to identify conductive pathology (e.g. Doan et al 1996; Qin et al. 2010).
One technique measures the sound-induced motion of the tympanic membrane (TM) or umbo as an estimator of middle-ear structural and functional changes (Doan et al. 1996; Yoshida et al. 2000; Samadi et al. 2005), and has been applied to mice of different strains and genetic background (Rosowski et al. 2003) as well as in aging ears (Doan et al. 1996; Rosowski et al. 2003). While the technique is relatively straightforward, it is not equally sensitive to all conductive pathology: ossicular abnormalities that cause 30 to 40 dB increases in ABR thresholds can have much smaller effects on TM and umbo motion (Qin et al., 2010).
Qin et al. (2010) suggest an alternative indicator of conductive hearing loss by comparing changes in distortion product otoacoustic emissions (DPOAE) and evoked auditory brainstem responses (ABR). The proposed rule of thumb is that conductive impairments alter the effective sound stimulus that reaches the inner ear, reducing the stimulus to the ABR and DPOAE generators, and that the same impairment equally reduces the magnitude of the DPOAEs that come back through the middle ear to generate sound pressures in the ear canal. Such a scenario predicts the DPOAEs recorded in the ear canal will be reduced by a factor equal to the square of the conductive loss in ABR sensitivity (in dB terms, the dB change in ear canal DPOAE sensitivity should be twice the dB change in ABR sensitivity). However, this rule only approximates a more complex relationship between ABR and DPOAE threshold changes produced by controlled conductive pathologies (Qin et al. 2010).
Bone conduction stimuli have been used in animal models (e.g. Tonndorf and Tabor, 1962; Tonndorf et al. 1966a&b; Tonndorf 1972; Steel et al., 1987; Chhan et al. 2013, 2016), but in general their use has been limited to investigations of how specific anatomical manipulations affected the response to BC sound. Here, we examine the use of a new technique to quantify the sensitivity to BC in different strains of mice with the idea of developing test standards, which, when combined with well-controlled standard AC sensitivity measurements, will allow independent determinations of conductive and sensory-neural hearing function.
The first aim of our study is to measure AC and BC hearing sensitivity in seven to eight week old CBA/CaJ mice before and after introducing controlled lesions to the middle-ear conductive apparatus. The second aim is to investigate the presence of an age-dependent conductive hearing loss in BALB/c mice that has been suggested by other methods (Doan et al. 1996). The outcomes of both experiments test how well ABR measurements of AC and BC sensitivity quantify conductive hearing loss in mice.
2. Methods
2.1 Animal preparation
All animal procedures were approved by the Animal Care Committee of the Massachusetts Eye and Ear Infirmary and follow the Guide for the Care and Use of Laboratory Animals of the US National Research Council. A total of 15, seven to eight-week CBA/CaJ mice for Experiment I, and 58 BALB/c mice of different age groups (Table 1) for Experiment II (Jackson Lab, ME, USA) were used in terminal procedures to quantify their ABR thresholds to both AC and BC stimuli. Mice were anesthetized with Ketamine (100mg/kg i.p.) and Xylazine (10mg/kg i.p.), with booster injections of 1/3 to 1/2 the original dose as needed during all surgical and measurement procedures.
Table 1.
Five Age Groups of BALB/c mice
| Group | N | Age range (days) | Mean Age (days) | stdev (days) |
|---|---|---|---|---|
| A | 12 | 35-43 | 37.3 | 3.5 |
| B | 13 | 52-67 | 56.2 | 6.0 |
| C | 11 | 107-110 | 108.4 | 1.1 |
| D | 12 | 245 | 245 | 0 |
| E | 10 | 360 | 360 | 0 |
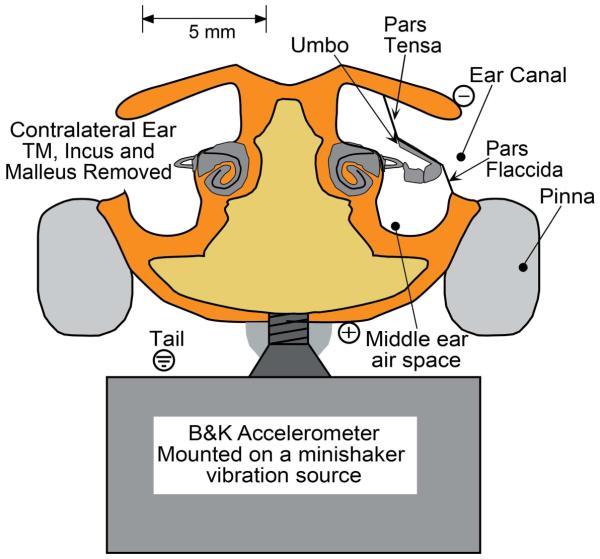
A slit was made in the cartilaginous external ear canal of the tested ear to enable inspection of the middle ear. Only animals with a normal appearing tympanic membrane (TM) and middle ear were used in the experiments. The tympanic membrane, malleus and incus of the untested ear were removed to reduce cross acoustic stimulation (Figure 1). Controlled AC sound stimuli (tone bursts and clicks) were used to determine the sensitivity of the measurement ear to sound (Qin et al. 2010, Maison et al. 2006).
Figure 1.
Technique for BC stimulation in mice: A metal screw is threaded into the mouse skull near the vertex and additionally supported with dental acrylic. The flat-head of the screw is tightly coupled to the vibrator-driven accelerometer by cyanoacrylic glue. The TM, malleus and incus of the non-test ear are removed. ABRs are differentially recorded with the positive electrode placed in the vertex (+) and the negative electrode (−) placed behind the test ear. A ground electrode is placed near the tail.
For bone conduction stimulation, the skin and muscle over the vertex of the skull were removed and a fine drill used to make a 1.5 mm diameter hole in the skull. A 5 mm long ‘flat headed’ metal screw (a #2 machine screw with 2 mm diameter and 56 threads per inch) was threaded into the hole without touching the brain beneath, and dental acrylic was used to fill in the space between the head of the screw and the skull. Once the dental acrylic was set, the animal was placed on its back with its head supported by a shaker (Brüel and Kjaer 4810) mounted accelerometer (Brüel and Kjaer 4375)1. Cyanoacrylic glue fixed the flat head of the screw to the flat surface of the accelerometer. The high-stiffness of the threaded screw and the dental- and cyano-acrylics that coupled the head to the shaker should lead to near-equality of shaker and head movements; however, it is possible that some relative motions occurred.2 Controlled BC whole-head vibrations of pulses and tone bursts were used to determine the sensitivity of the measurement ear to vibration.
2.2. Stimulation and measurement of evoked Auditory Brainstem Responses
The ABR measurement method was that of Maison et al. (2006) and Qin et al. (2010) using the Eaton-Peabody Laboratory Cochlear Function Test Suite3. Stimuli were generated and delivered, and responses monitored with digital signal generation and analysis techniques based on National Instruments (Austin TX) signal-generation and measurement hardware.
Air-conducted (AC) sound stimuli were delivered using a custom sound source fitted to the ear canal to form a closed acoustic system (Maison et al. 2006). A calibrated probe-tube integrated in the sound system was used to quantify the sound pressures produced by controlled electrical stimuli. After completion of the AC measurements, the animal was prepared for BC testing (Figure 1) and BC stimuli were produced by electrical excitation of the shaker and attached accelerometer. A unity-gain power amplifier drove the shaker (BC) or the earphone (AC).
Both AC and BC ABRs were elicited using 5-ms electrical tone pip stimuli (presented to either the sound source or the shaker) of frequencies between 5.6 and 45.2 kHz, cos2 shaping with a 0.5-ms rise/fall and a repetition rate of 30/s. The stimulus voltage levels varied between 10 volts and 10 μvolts in 5 dB steps. The sound pressures of AC stimuli were generally limited to be less than 85 dB SPL, except in cases where we observed significant hearing loss. The stimulus voltages delivered to the shaker for BC stimulation were limited to the 10 volt maximum output of the digital stimulus generation system.
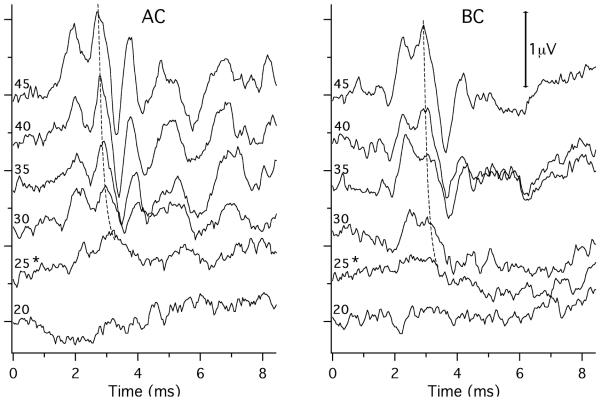
ABR responses were detected by sub-dermal needle electrodes placed at the vertex (+, active), ventro-lateral to the test ear (−, reference), and base-of-tail (common) (Figure 1). The responses were amplified (×10000), filtered (0.3-3 kHz band pass) and averaged (512 sweeps at each frequency level combination; artifact reject = 15-μv peak to peak). ABR thresholds were defined as the lowest stimulation levels where response peaks were clearly present. Figure 2 shows ABR waveforms at different stimulus levels in response to AC and BC stimuli at 11.3 kHz. Threshold estimates determined by visual detection by two or three individual observers were averaged. The thresholds estimated by the different observers generally differed by less than ± 5 dB.
Figure 2.
ABR waveforms at different stimulus levels in response to AC and BC stimuli at 11.3 kHz. The 5-ms tone pips started at time 0. Near vertical thin, dashed lines connect points of similar activity on the curves. The ‘*’s mark the estimated thresholds, which was defined as the lowest level where we see a repeating temporal pattern in the waveform that has a magnitude above the background variation and is visible with higher stimulus levels. The left-hand sides of the curves are labeled by the stimulus level used to produce the averaged waveforms: AC is reported in dB SPL; BC is reported in dB re 1 cm/s2.
2.3. Conductive manipulations: Experiment I
CBA/CaJ mice, seven to eight weeks in age, were used in this study. After AC and BC measurements of ABR thresholds were first measured with normal middle ears, the middle ear was manipulated in one of two ways (Qin et al. 2010): 1) the TM, malleus and incus were removed gently using a small hook. 2) In other mice, the middle-ear air space of the intact ear was filled slowly with saline via a small puncture made in the inferior-anterior TM. A 27-gauge needle was used in fluid filling and about 0.05 ml saline was injected until saline flowed back out of the perforation. Any saline in the external ear canal was removed with a soft paper towel. If air bubbles were observed behind the TM, the saline was removed and the filling procedure repeated.
2.4 Ageing study: Experiment II
ABRs in response to air-conducted and bone-conducted stimuli were measured in BALB/c mice of ages between 5 weeks and 1 year (Table 1). This strain was selected because of its well-documented age-related hearing loss (Willot et al. 1998) and the suggestion that part of this loss is conductive in nature (Doan et al. 1996). The quantification of a conductive loss by an ‘Air-Bone gap’ requires the definition of some standards for normal AC and BC threshold (e.g. Steel et al., 1987; Schlauch & Nelson 2009). In our investigation of age-related hearing loss we use the AC and BC thresholds measured in our youngest group as a standard and define the age-related change in both AC and BC thresholds.
2.5 Statistics
Statistical tests were performed using StatPlus:Mac 2009. The tests included: a) The use of means, standard errors, paired t-tests and two-way ANOVA’s to describe and compare the responses measured in CBA/CaJ mice before and after conductive pathology where the data appear normally distributed, b) the use of medians and inter-quartile ranges (IQR) to describe the data in the ageing BALB/c mice where ceiling effects in stimulation led to non-normal distributions, and c) least-squares linear regressions to quantify the effects of age on AC and BC thresholds. In all statistical tests we first report the computed two-tailed probability that our results are explained by chance without the use of any corrections for repeated testing. We then applied post-hoc the Benjamini-Hochberg procedure to determine the significance of multiple comparisons. We used a threshold of significant probability of p=0.05, with an acceptable false-positive rate of 5% as defined by McDonald (2007).
3. Results
3.1 Conductive manipulations: Experiment I
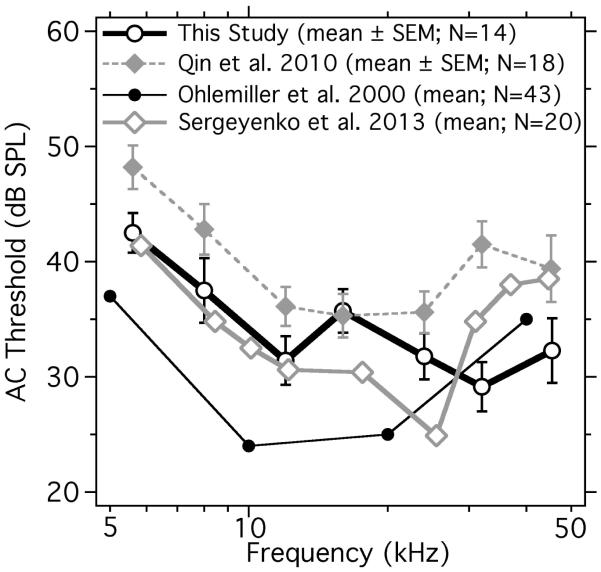
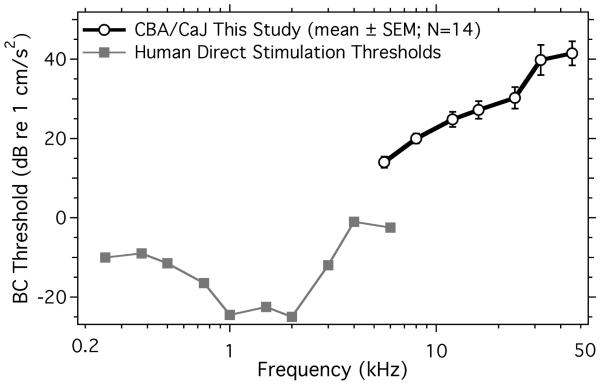
We measured auditory brainstem response in 14 normal CBA/CaJ ears (a 15th animal died before the measurements were completed). The animals were divided into two manipulation groups: 1) TM, malleus and incus removed, and 2) saline filling of the middle ear. Figures 3 and 4 respectively show ABR thresholds in the normal ears computed as the threshold sound pressure levels (dB SPL) in the ear canal in AC, or accelerations (cm/s2) applied to the skull in BC. The AC ABR thresholds in the current study were generally within 10 dB of the thresholds measured by others (Figure 3).
Figure 3.
Mean and standard error of the mean (SEM) of AC ABR thresholds of normal CBA mice (N=14) of this study compared with two studies done with similar stimulus and recording software and hardware (Qin et al. 2010; Sergeyenko et al. 2013) and a study from another laboratory (Ohlemiller et al. 2000).
Figure 4.
Mean and standard error of the mean (SEM) of BC ABR thresholds in 14 young CBA mice compared to the mean of behavioral thresholds from direct skull acceleration experiments in seven humans (Håkansson et al. 1985). Thresholds are scaled in dB re 1 cm/s2.
Figure 4 is a comparison of the mean threshold ABR head accelerations (BC) in normal CBA/CaJ ears to psychophysically determined direct-bone acceleration thresholds in humans (Håkansson et al., 1985). The BC acceleration threshold levels in mice are higher than those of human, though the comparison is complicated by the large difference in the measured frequency ranges. The near proportionality of the mouse ABR BC acceleration thresholds with frequency is suggestive of a near constant head velocity at BC threshold. The relationship between human psychophysical thresholds and mouse ABR thresholds is not simple. Our use of threshold acceleration allows us to plot the two data sets within a similar ordinate range; plotting the threshold forces applied to the heads (which is the audiometric standard) would provide a different comparison.
To test if BC-driven ABR responses result from head vibrations and not sound produced by the vibration source, we measured the ABR produced by stimulation of the shaker when the animal’s head was coupled to and uncoupled from the shaker. The voltages required to produce a visible ABR response when the head was uncoupled were 20 to 40 dB higher than the voltages necessary when the head was attached to the shaker by the head screw. These results indicate the effect of vibrator-induced sound in air during BC stimulation is small.
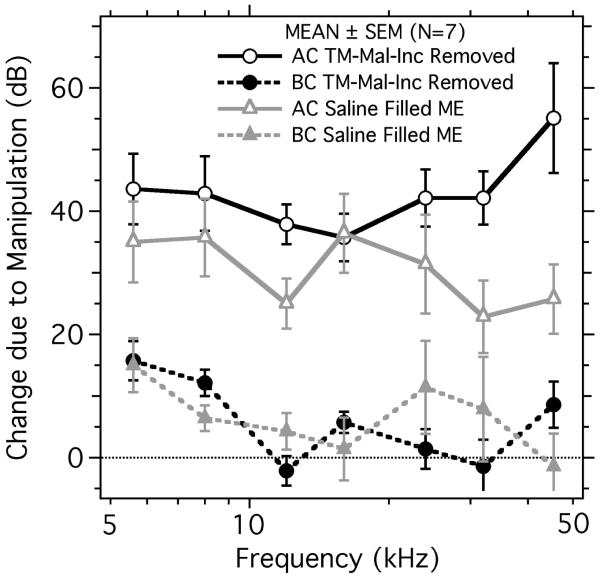
The changes in AC and BC ABR thresholds produced by the two conductive manipulations are shown in Figure 5. Both manipulations produced 20 to 50 dB increases in AC driven ABR thresholds, with little effect on the BC driven ABR thresholds, with the exception of a consistent increase of 5-15 dB at frequencies below 10 kHz. Comparisons of the threshold changes in the different groups indicate: (1) Changes in AC threshold due to the manipulations are 10 to 30 dB higher than the changes in BC thresholds. (2) While the effect of the manipulations on the BC thresholds are small, ANOVA analyses quantify a statistically significant effect of the manipulations on both AC and BC thresholds, where the frequency of the stimulus had a significant effect on the threshold change in all conditions (Table 2), with a significant interaction between manipulation and frequency in the BC ossicles-removed group. (3) The 10 to 20 dB BC thresholds shifts observed with BC stimulation at 5.6 and 8 kHz suggest both manipulations also reduced some component of BC stimulation, e.g. the manipulations may have interfered with the contributions of either ossicular inertia (Tonndorf 1972; Stenfelt and Goode 2005) or the middle-ear load on the inner ear (Chhan et al. 2013; Stenfelt 2015) to the BC response. (4) Consistent with the localized low-frequency effect of the conductive manipulations on the BC thresholds, the statistically determined effect of the manipulations on the BC scores is made non-significant by removing the data from the two lowest frequencies from the ANOVA analyses (Table 2).
Figure 5.
Manipulation induced changes in AC and BC evoked ABR thresholds. Manipulations include removal of the TM, malleus and incus (TM-Mal-Inc Removed) in seven ears and filling the middle ear with saline in another set of seven ears. Each data point represents the mean and the error bars the standard error mean (SEM).
Table 2.
Results from two-way ANOVAs of middle-ear manipulation data.
| Stimulus | Test Conditions | Degrees of Freedom (DF) |
‘within group’ DF |
F statistic | ‘uncorrected’ Probability of chance effect |
|---|---|---|---|---|---|
| All Seven Frequencies | |||||
| AC | Oss Rmv vs. control | 1 | 84 | 404.9 | <0.00001 |
| Freq | 6 | 4.94 | 0.00020 | ||
| Interaction | 6 | 1.20 | 0.314 | ||
| AC | Saline vs. control | 1 | 83 | 135.7 | <0.00001 |
| Freq | 6 | 4.27 | 0.00085 | ||
| Interaction | 6 | 0.37 | 0.894 | ||
| BC | Oss Rmv vs. control | 1 | 84 | 14.08 | 0.00032 |
| Freq | 6 | 52.90 | <0.00001 | ||
| Interaction | 6 | 2.88 | 0.013 | ||
| BC | Saline vs. control | 1 | 84 | 10.00 | 0.0022 |
| Freq | 6 | 28.34 | <0.00001 | ||
| Interaction | 6 | 1.10 | 0.366 | ||
| Five Highest Frequencies | |||||
| BC | Oss Rmv vs. control | 1 | 60 | 1.46 | 0.232 |
| Freq | 4 | 31.56 | <0.00001 | ||
| Interaction | 4 | 1.05 | 0.387 | ||
| BC | Saline vs. control | 1 | 60 | 3.23 | 0.077 |
| Freq | 4 | 19.41 | <0.00001 | ||
| Interaction | 4 | 0.76 | 0.559 | ||
Tests of differences between the AC and BC thresholds before and after the middle-ear manipulations. Columns describe the stimulus, the test conditions (including an entry for the effect of frequency on each condition and the interaction of condition and frequency), the degrees of freedom (DF) of the different conditions, the ‘within’ group DF, the F statistic and the uncorrected probability that differences between the conditions are due to chance. The tests of the BC data were repeated with only the 5 highest frequencies. Post-hoc Benjamini and Hochberg corrections determine all of the tests with uncorrected p values < 0.02 are significant at the p < 0.05 level with a 5% false positive rate.
3.2 Ageing study: Experiment II
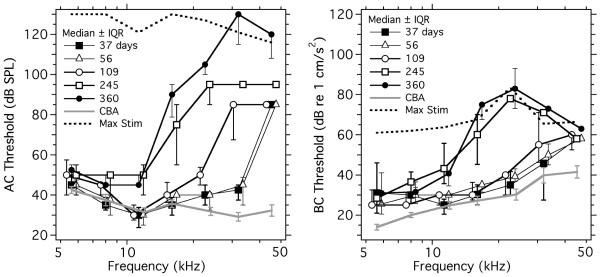
The AC and BC evoked ABR thresholds of five different age groups of BALB/c mice (Table 1) were investigated. Figure 6 compares the medians and interquartile ranges (IQR) of the AC (left) and BC (right) ABR thresholds of the different groups along with the thresholds in young CBA/CaJs. As expected, AC and BC ABR thresholds in BALB/c mice were elevated compared to the CBA/CaJ thresholds at the highest frequencies, and the frequency range with increased BALB/c thresholds spread from high to low as age increased. At multiple ages and frequencies the thresholds exceeded the maximum stimulus either that we wished to apply (AC), or we could generate (BC) and the threshold was estimated as 5 dB greater than the maximum stimulus used. (Figure 6 includes measurements of the stimulus ceiling, and the caption includes more description of the threshold estimates above the stimulus ceiling.) The normally imposed AC stimulation limit of 80 dB SPL was at least 40 dB above the CBA/CaJ thresholds at all frequencies. A 10 volt stimulus maximum to the shaker during BC stimulation limited the supra-CBA/CaJ threshold dynamic stimulus range to only 20 dB at 36 and 44 kHz and 40 dB at lower frequencies.
Figure 6.
AC (left-hand panel) & BC (right-hand panel) ABR thresholds of 5 age groups each of ten to twelve BALB/c mice plotted as medians and interquartile ranges (IQR) as a function of frequency. Thresholds in 49-56 day-old CBA/CaJ mice are included for comparison. Also included are the means of 5 measurements of the maximum stimulus level achievable when the sources were driven by a 10 volt stimulus. The maximum varied by ± 5 dB from ear to ear dependent on the coupling of the source to the animal. The BC maximum stimulation limit or ceiling was a hard and constant upper limit in our measurements. The AC stimulus ceiling was more arbitrary and usually 80 dB SPL, which was selected to prevent damage to the inner ear. When threshold events where not visible at the stimulus ceiling, the threshold was coded as 5 dB above the ceiling. In order to reduce symbol overlap, some of the data points are shifted along the frequency axis.
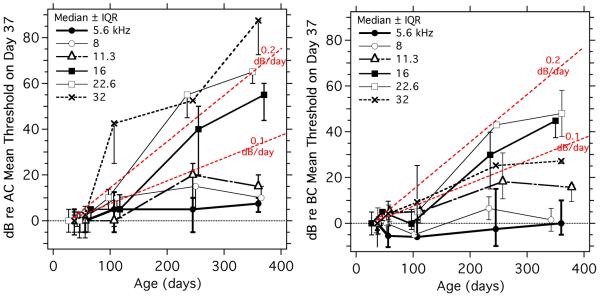
Age-related changes in the AC and BC thresholds (Figure 7) were computed by normalizing the data to the median threshold measured in the youngest group (37 days of age). The size of these age-related threshold shifts can be limited by the maximum stimulus ceiling for each frequency and stimulus condition. These limitations are most often observed with greater age and greater frequency, where they cause an artificial compression of the interquartile range. Included in Figure 7 are lines that describe exponential increases in thresholds of 0.1 and 0.2 dB/day. The data are consistent with observations that the magnitude of the age-related changes in both AC and BC are positively related to the frequency of the stimulus, with increased rates of threshold change linked to higher frequencies, and the slowest changes with age occurring at the lowest frequencies. The data of Figure 7 suggest that the rates of increase in the AC thresholds are greater than the rates of increases in the BC thresholds. This suggestion is consistent with the presence of a growing conductive hearing loss in the BALB/c mice and is further examined in the discussion section.
Figure 7.
Medians and interquartile ranges of the change in AC and BC ABR threshold with age in BALB/c mice. The threshold changes are relative to the median threshold in the 37-day-old group. Each curve represents a different stimulus frequency. Thresholds that were limited by the stimulus ceiling were coded as 5 dB above the ceiling as described in the caption to Figure 6. The dotted lines without symbols display exponential increases in threshold sensitivity of 0.1 and 0.2 dB/day.
3.3 A naturally occurring conductive hearing loss in a young BALB/c mouse.
An unplanned test of our techniques to quantify conductive impairments via AC and BC measurements came about when we observed serous fluid had naturally filled the middle ear of a 37-day-old BALB/c mouse. (Because of the effusion, the mouse is not included in the data we use to investigate age-related hearing loss. We suspect the relatively clear effusion was the sign of a chronic condition [e.g. Rosowski et al. 2003] and was not associated with our methods.) Figure 8 illustrates a large difference in AC, but not BC, thresholds in the effusion ear compared to other normal ears. The ear shows AC thresholds that are 30 to 50 dB higher than the normal mean at all but the two highest frequency (32 and 45 kHz), coupled with near normal BC thresholds between 10 and 45 kHz, and a 7 to 10 dB increases in BC threshold compared to normal at the lowest frequencies. These increased thresholds in the effusion ear are quite similar to the fluid-induced increases described in Figure 5. Differences between the two sets of results include: (a) the fluid-associated increases in AC threshold in Figure 8 are somewhat larger (40 to 50 dB compared to 30 to 40 dB) at frequencies less than 30 kHz, and (b) there is a smaller AC loss at the highest frequency (45 kHz) in Figure 8. Whether these differences reflect individual variability in the response to fluid filling or differences in the degree of filling in an ear with natural effusion or injected saline is not clear.
Figure 8.
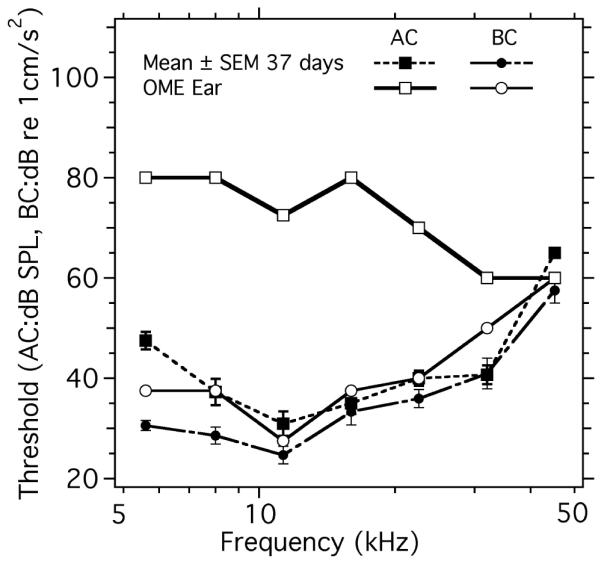
A comparison of AC and BC evoked ABR thresholds in a 37-day-old BALB/c mouse with naturally occurring middle-ear effusion (OME) and the means ± SEM from 11 other mice of the same strain and age with normal middle ears.
4. Discussion
We now discuss the implications of our ABR measurements in response to AC and BC stimulation in young mice before and after conductive impairments, and in ageing mice.
4.1 Our techniques allow repeatable measurements of the sensitivity of mice to sinusoidal head accelerations.
The use of head acceleration to estimate BC thresholds in mice has been previously reported (Steel et al. 1987); however, the present study is more extensive. Here we demonstrate methods that produce consistent inter-ear ABR thresholds with small standard errors of the mean in populations of young mice of two different strains (Figures 4 & 6). Furthermore, we demonstrate: (1) the relative insensitivity of the BC thresholds to induced conductive disorders (Figures 5 and 8), and (2) an increase in BC-induced ABR thresholds in aging BALB/c mice consistent with a sensory-neural presbycusis (Figure 6 & 7). We also performed control measurements that demonstrated a 20 to 40 dB reduction in the ABR sensitivity to shaker acceleration when the heads of young mice were physically disconnected from the shaker, but remained at a similar distance from the shaker.
A weakness of the present BC methods is the limited supra-normal threshold dynamic range, where this range is as small as 20 dB at 30 kHz and above, and 40 dB between 10 and 30 kHz. As we will see, this limitation complicates the discrimination of conductive hearing losses, when the sensory-neural loss is moderate to severe. There a similar, but less severe, limitations in human AC and BC testing in cases of severe to profound sensory-neural loss (Schlauch and Nelson 2009).
4.2 Head acceleration and sound-pressure evoked ABRs are differentially sensitive to conductive impairments.
Our methods reliably and reproducibly indicate the presence of conductive loss when sensory-neural function is near normal. The data of Figures 5 and 8 demonstrate an insensitivity (with the exception of the lowest frequencies) of the BC-evoked ABR thresholds to conductive impairments that increase the threshold to AC stimuli by 20 to 40 dB. The 5 to 15 dB repeatable increases in BC thresholds at 5 and 8 kHz with induced conductive impairments are reminiscent of small changes in human BC thresholds with conductive impairment, e.g. Carhart’s notch (Carhart 1950). A difference is that the ‘notch’ occurs in the middle of the human auditory range (2 to 4 kHz), while the BC sensitivity changes we observe in mice with conductive impairments are in the lower frequency range of hearing, 5 to 8 kHz. Since only a little is known about the contribution of the multiple stimulus pathways that contribute to BC in different animals (Tonndorf et al. 1966b; Chhan et al. 2013; 2016), the difference in the frequency range where conductive impairments affect BC thresholds in mice and men may reflect a difference in the frequency dependence of components of BC hearing that depend on ossicular transmission of sound or the normal middle-ear load (Stenfelt et al. 2002; Stenfelt & Goode 2005; Kim et al. 2011; Stenfelt 2015; Chhan et al. 2016). Consistent with such interspecies variations, the largest effects of middle-ear manipulation on BC-evoked cochlear potentials in cats occurred between 250 and 1000 Hz (Tonndorf et al. 1966a; Tonndorf, 1972). Bone-conduction experimental work in chinchillas, dogs, and rats, however, suggests that middle-ear bone conduction pathways make significant contributions to the BC response in a mid-range of frequencies (Tonndorf et al. 1966b; Chhan et al., 2013, 2016).
4.3 The observed conductive impairments in AC are similar to those reported by others
Removing the TM, malleus and incus reduces the conduction of airborne sound to the inner ear. Such pathology is generally observed to cause a decrease of hearing sensitivity of 30 to 60 dB in mice and other mammals (Wever et al. 1948; Steel et al. 1987; Qin et al. 2010; Peake, et al. 1992). Likewise, filling the middle ear cavity with saline produces a conductive hearing loss by adding an extra load to the middle-ear system making it harder to move the ossicles (Ravicz et al. 2004; Dai & Gan 2008). Both pathologies, therefore, have a significant effect on the conduction of AC sound. Bone conduction, which reaches the inner ear through multiple pathways (Tonndorf 1972; Stenfelt and Goode 2005), is less dependent on the middle ear system to elicit inner ear responses, thus manipulations of the middle ear’s conductive apparatus cause only small changes in BC response.
4.4 Variations in AC and BC sensitivity with strain
There are many comparison of the threshold of AC-related hearing response in different strains of mice (e.g. Erway et al. 1993; Willot et al. 1998; Zheng et al. 1999; Ohlemiller et al. 2000; Yoshida et al. 2000), but Figure 6 is the first quantitative comparison of BC thresholds in two mouse strains4. While a comparison of the CBA/CaJ and the youngest BALB/c thresholds is instructive, reasons for some of the differences are less than clear. The similarities in BC thresholds between the two strains include: (a) the general upward shape of the threshold function, with acceleration thresholds increasing as frequency increases, and (b) an overlap in the actual threshold values at frequencies between 10 kHz and 32 kHz. The measured thresholds in the two strains differ by 10 to 20 dB at the lowest and highest frequencies, where the CBA/CaJ thresholds are more sensitive. The difference at low frequencies is consistent across all of the BALB/c ages. The observed difference between the thresholds in the youngest mice of the two strains at 45 kHz is consistent with AC measurements that show poorer high-frequency hearing in the BALB/c strain. Precise comparison of the BC thresholds in young mice of the two strains are complicated by the lack of dynamic range in the BC stimulator at frequencies above 30 kHz. While the CBA/CaJ thresholds are well defined at these high frequencies, many of the thresholds in the young BALB/c mice at 45 kHz were above the maximum stimulus level. The BC data in Figures 6 and 7 describe a clear age-dependence in the sensitivity of the BALB/c mice to BC stimulation, which was not investigated in the CBA/CaJ.
4.5 Age related AC and BC hearing loss in BALB/c mice
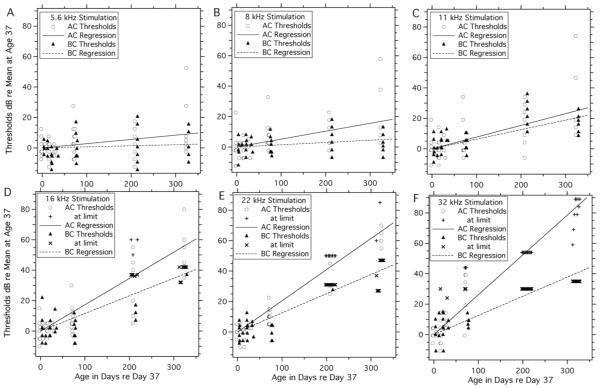
The data of Figure 6 and 7 describe age-related increases in the ABR thresholds measured in BALB/c mice, where comparisons of the mean thresholds at different ages and frequencies suggest that the AC and BC thresholds in BALB/c can increase at rates as high as 0.1 to 0.2 dB per day. This suggestion is investigated more quantitatively in Figure 9 and Table 3. In Figure 9, we plot each measured threshold normalized by the mean threshold measured (at the same frequency) in the 37-day-old BALB/c group and plotted at its age relative to age 37. We also include measurements (plotted as +s or xs) at frequencies and age where the threshold estimate was limited by the stimulus ceiling. The results are plots of changes in threshold at each different frequency as a function of increasing age from day 37. One feature visible in Figure 9 is the general similarity of air and bone thresholds measured in our two youngest groups. Since we plot each individual threshold measurement, we can observe that within the 37 and 56 day old groups the normalized thresholds generally varied by no more than ± 10 dB, with no clear indication of any significant age effect within the two age groups.
Figure 9.
Age-related changes in threshold (relative to the thresholds at day 37) plotted vs Age in days minus 37, at six stimulus frequencies. Individual AC thresholds are plotted as open circles, and BC thresholds are plotted as filled triangles. As frequency and age increases, the number of thresholds at the ceiling of the measurement system (coded with + and x) increases. The six panels include linear fits to all of the thresholds (including those below and those at the measurement ceiling). The fits describe exponential increases in threshold on a dB scale. The slopes and their significance are described in Table 3. The BC data are shifted in age by a few days to reduce overlap of the two sets of points. At locations with multiple measurements limited by the ceiling, the points are spread along the horizontal plot space.
Table 3.
Regression analyses of changes in ABR thresholds with age.
| Air Conduction | Bone Conduction | Air - Bone | |||
|---|---|---|---|---|---|
| frequency (kHz) |
N | slope±SE (dB/day) |
N | Slope±SE (dB/day) |
Differences in slope |
| 5.6 | 56 | 0.028±0.008 (p =0.0016) |
53 |
0.007±0.007
(p=0.3149)# |
0.021 |
| 8.0 | 56 | 0.052±0.008 (p <0.0001) |
53 | 0.015±0.005 (p=0.0036) |
0.037 |
| 11.3 | 56 | 0.077±0.010 (p <0.0001) |
53 | 0.063±0.006 (p <0.0001) |
0.014 |
| 16 | 56 | 0.173±0.010 (p <0.0001) |
53 | 0.116±0.007 (p <0.0001) |
0.057 |
| 52 | 0.153±0.009 (p <0.0001) |
40 | 0.066±0.012 (p <0.0001) |
0.087 | |
| 22.6 | 56 | 0.205±0.006 (p <0.0001) |
55 | 0.126±0.006 (p <0.0001) |
0.079 |
| 45 | 0.186±0.007 (p <0.0001) |
35 | 0.063±0.019 (p <0.0024) |
0.123 | |
| 32.0 | 56 | 0.262±0.010 (p <0.0001) |
55 | 0.126±0.009 (p <0.0001) |
0.136 |
| 29 | 0.331±0.055 (p <0.0001) |
27 | 0.085±0.051 (p=0.108)# |
0.246 | |
Entries include all frequency and age conditions that contain measurements of both AC and BC sensitivity. The first column is the frequency, the second and third columns describe the number of points and the computed slope, standard error slope and uncorrected level of significance for the AC data, the fourth and fifth columns describe the same for the BC data, and the sixth column describes the difference between the slopes computed for the Air and Bone data. The Ns associated with the entries at frequencies of 5.6, 8, and 11.3 kHz and the second entries at the higher frequencies describe the number of the AC and BC thresholds determined below the maximum stimulus ceiling. The first entries at 16, 22.6 and 32 kHz describe the Ns and the slopes estimated when we include threshold estimates at 5 dB above the ceiling. As illustrated in Figure 9, all the individual age and threshold data (including the 37-day-old data) were normalized to the mean age and mean thresholds in the 37-day-old group. The regression coefficients were computed using least-squares techniques assuming a linear intercept of 0 dB at a relative age of 0 days. The calculated slopes have units of dB/day. Application of a Benjamini - Hochberg compensation for multiple tests suggest that all uncompensated p values ≤ 0.0294 are significantly different from 0 at a level equal to or better than p=0.05 with a 5% chance of a false positive. Non-significance is marked by a #.
The plotted lines in Figure 9 are computed by least-squares linear regression analyses done on the dB vs. age data, where the analysis assumes an intercept of 0 dB relative to the mean hearing level and mean age of the 37 day old group. A linear relationship with dB values increasing with age is consistent with an exponential increase in hearing threshold with time. Linear fits to all of the normalized AC and BC thresholds are noted in Table 3. All of the slopes describing the increase in AC thresholds with age are statistically different from 0 at better than the p=0.05 level (see the caption to Table 3 for a description of significance testing). Fits to the BC thresholds at 8, 11, 16 and 22.6 kHz also reach this level of significance. These slopes are consistent with presbycutic increases in AC and BC thresholds that range from 0.02 to 0.3 dB/day with an increase in the growth rate of the hearing loss with increased frequency.
Differences between the observed rate of growth of the AC and BC thresholds (the right-most column in Table 3) are consistent with a developing conductive loss: the BC slopes are smaller than the AC slopes. However, detecting the presence of a conductive loss in our data is complicated by the limited dynamic range of the BC measurements, which leads to a significant number of thresholds at the ceiling of our measurements system at the higher stimulus frequencies and older ages. We also see ceiling events in the AC measurements at the highest frequencies and ages. This issue is especially acute at 32 kHz (Figure 9F), where the estimates of the AC and BC growth rates are heavily influenced by the out-of range measurements at the two oldest ages.
Alternatively, we estimate the age-related growth of AC and BC hearing thresholds from the subset of data points where we were able to visualize real threshold events. Growth rates estimated from these restricted data sets are also tabulated in Table 3. The growth rates calculated from the restricted data set tend to be faster than the growth rates computed including ceiling effects, this is because the data gathered with the measurement ceiling are generally low-estimates of threshold. The estimated rates of the increase in BC thresholds with age from the restricted data set continue to be slower than the rate of increase in AC thresholds, again consistent with a growing conductive hearing loss with age.
4.6 Is there a conductive component to the age-related hearing loss in mice?
The evidence for conductive hearing losses in multiple mouse strains is varied. Much of the evidence is morphologic in nature, where multiple authors have observed ossicular malformations in different mice strains and have assumed a conductive hearing loss (Chole & Henry 1983; Steel et al. 1987; Kanzaki et al. 2006; Richter et al. 2010; Hurd et al. 2011; Tyrer et al. 2013). There are a few functional measurements. Steel et al. (1987) used a different bone-conduction technique to suggest that certain individual LP/J mice have Air-Bone gaps that varied between 0 and 60 dB where the largest gaps are consistent with the ossicular malformations observed in that strain. Doan et al. (1996) and Rosowski et al. (2003) used measurements of sound-induced tympanic-membrane motion to investigate age-related conductive hearing losses in BALB/c, CBA/CaJ and SEV190 mice, where two-year-old BALB/c mice have been shown to demonstrate small (6 dB) but statistically significant reductions in TM/umbo velocities compared to young mice of the same strain (Doan et al. 1996).
An issue with alterations in TM and umbo velocity is that they tend to underestimate the magnitude of the conductive hearing loss (Qin et al. 2010). At least one study has supplemented umbo velocity with incus velocity measurements, which helped to identify an 8 to 12 dB mid-range conductive loss in a Brn4/Pou3f4 mutant mouse strain (Samadi et al. 2005). Other investigations of conductive hearing loss are less direct, and include observations of differences in the magnitude of threshold losses determined by ABR and DPOAE measurements or consistencies in latency and amplitude shifts in ABR growth (Zehnder et al. 2006; Qin et al. 2010; Hurd et al. 2011; Lysaght et al. 2014).
In this paper we investigate the presence of a conductive hearing loss in ageing BALB/c mice using measurements of AC and BC driven ABR potentials. We demonstrate that this technique can reliably quantify an Air-Bone gap in mice with relatively normal sensory-neural hearing function, where BC thresholds are within 10 dB of normal at frequencies above 10 kHz, and within 20 dB at frequencies below 10 kHz (Figure 5 and 8). However, methodological restrictions in our ability to produce larger accelerations of the mouse head resulted in limited dynamic range of BC stimulation that interfered with our ability to separate conductive and sensory-neural hearing loss in cases of moderate to severe sensory-neural impairment (Figures 6, 7 and 9). Nonetheless, our measurements show differences in the growth of age-related AC- and BC-produced hearing thresholds in BALB/c mice that are consistent with the presence of a conductive component to the loss over a broad frequency range (Figure 9, Table 3).
The magnitude of the predicted conductive loss in BALB/c mice at one year of age can be easily measured in Figure 9, by quantifying the gap between the AC and BC loss predictions computed at 328 days post the 37 day baseline measurement, this can either be done graphically or by multiplying the differences in the slope noted in Table 3 by 328 days (328=365-37). Such an exercise suggests air-bone gaps of 7, 12, 5, 19, and 26 dB at 5.6, 8, 11, 16 and 22 kHz respectively. Figure 9F suggests the gap continues to grow with increasing frequency, however estimates of the gap at such frequencies is complicated by the stimulus ceiling at those frequencies. The predicted gaps at the 5.6, 8 and 11 kHz are comparable to the decreases in umbo velocity quantified by Doan et al. (1996) at those frequencies. The 20 to 25 dB gaps we predict at 16 and 22 kHz are much larger than the loss in umbo motion quantified by Doan et al. (1996).
The primary significance of the age-related conductive hearing loss in mice suggested by our results, is the possibility that such a phenomenon could be generalized to humans. Investigations of conductive presbycusis in humans generally come to the conclusion that the phenomenon exists, but its contribution to the overall hearing loss is small (e.g. Wiley et al. 1999; Whittemore at al. 2004). The presence of an animal model where an age-related conductive loss is a significant fraction of the overall hearing loss should spur further investigations into the significance of such losses in ageing humans.
5. Summary and Conclusion
We describe a technique that yields bone conduction (BC) thresholds in mice that vary little between young individuals of the same strain and are insensitive to the sound produced by our vibration source. We also demonstrate that BC-driven ABR responses are insensitive to conductive pathologies produced by either removal of the TM and malleus or filling the middle-ear cavity with saline, except for small manipulation-induced losses at frequencies below 10 kHz. Application of the BC technique to ageing BALB/c mice demonstrates both the AC and BC-evoked response thresholds increase significantly with age with the rate of increase that increases with stimulus frequency; however, estimation of the magnitude of age-related increases in BC thresholds at higher frequencies and increased ages is limited by the lack of the dynamic range in the BC stimulation method. Comparisons of the rate of growth of the AC and BC thresholds with age in BALB/c mice are consistent with a conductive hearing loss that grows with age that can be 20 dB or greater at one year of age at stimulus frequencies of 16 kHz and greater.
Highlights.
ABR measurements in response to bone-conduction stimuli are described.
Bone-conduction responses are little affected by conductive lesions.
Air- and bone-conduction responses suggest a conductive presbycusis.
The presented bone-conduction techniques have a limited dynamic range.
Acknowledgement
The authors would like to thank Heidi Nakajima and Mike Ravicz for useful discussions. We also thank the staff of the Eaton-Peabody Laboratory for their technical support. This work was supported by NIDCD: R01DC000194 (JJR PI) and T32DC000038 (DC).
Footnotes
Publisher's Disclaimer: This is a PDF file of an unedited manuscript that has been accepted for publication. As a service to our customers we are providing this early version of the manuscript. The manuscript will undergo copyediting, typesetting, and review of the resulting proof before it is published in its final citable form. Please note that during the production process errors may be discovered which could affect the content, and all legal disclaimers that apply to the journal pertain.
Author contributions: All of the authors made significant contributions to this work. All three were involved in the animal preparation and data taking. All three contributed to the data analysis, though JJR is primarily responsible for the statistical analyses. DC prepared the first draft of the paper and preliminary figures. Subsequent drafts were prepared by JJR. Final figures were prepared by JJR and MLM.
The frequency response of this combination was tested through 40 kHz via comparisons with laser-Doppler measurements of the shaker-induced velocity of the accelerometer head.
Future measurements should use independent motion measurements of the accelerometer and the head to test for relative motion between the head and the accelerometer.
The work of Steel et al. (1987) measures BC sensitivity in CBAs and the LP/J mice. However, the absolute thresholds are not presented in the paper and there is much variability in the individual BC thresholds that are reported for the LP/J mice.
Contributor Information
David Chhan, Army Research Lab, Aberdeen Proving Ground, MD, USA.
Melissa L. McKinnon, Eaton-Peabody Laboratory, Massachusetts Eye and Ear Infirmary, Boston, MA.
John J Rosowski, Eaton-Peabody Laboratory, Massachusetts Eye and Ear Infirmary, and Department of Otolaryngology, Harvard Medical School, Boston, MA.
References
- Carhart R. Clinical application of bone conduction audiometry. Arch Otolaryngol. 1950;51:798–808. doi: 10.1001/archotol.1950.00700020824003. [DOI] [PubMed] [Google Scholar]
- Chhan D, Roosli C, McKinnon ML, Rosowski JJ. Evidence of inner ear contribution in bone conduction in chinchilla. Hear Res. 2013;301:66–71. doi: 10.1016/j.heares.2012.11.014. [DOI] [PMC free article] [PubMed] [Google Scholar]
- Chhan D, Bowers P, McKinnon ML, Rosowski JJ. Middle-ear and inner-ear contribution to bone conduction in chinchilla: the development of Carhart’s notch. Hear Res. 2016 doi: 10.1016/j.heares.2016.02.015. (in press) [DOI] [PMC free article] [PubMed] [Google Scholar]
- Chole RA, Henry KR. Otosclerotc lesions in the inbred LP/J mouse. Science. 1983;221:881–882. doi: 10.1126/science.6879187. [DOI] [PubMed] [Google Scholar]
- Dai C, Gan RZ. Change of middle ear transfer function in otitis media with effusion model of guinea pigs. Hear Res. 2008;243:78–86. doi: 10.1016/j.heares.2008.05.010. [DOI] [PMC free article] [PubMed] [Google Scholar]
- Doan DE, Erulkar JS, Saunders JC. Functional changes in the aging mouse middle ear. Hear Res. 1996;97:174–177. [PubMed] [Google Scholar]
- Erway LC, Willott JF, Archer JR, Harrison DE. Genetics of age-related hearing loss in mice: I. Inbred and F1 hybrid strains. Hear Res. 1993;65:125–132. doi: 10.1016/0378-5955(93)90207-h. [DOI] [PubMed] [Google Scholar]
- Håkansson B, Tjellström A, Rosenhall U. Acceleration levels at hearing threshold with direct bone conduction versus conventional bone conduction. Acta Otolaryngol. 1985;100:240–252. doi: 10.3109/00016488509104786. [DOI] [PubMed] [Google Scholar]
- Hurd EA, Adams ME, Layman WS, Swiderski DL, Beyer LA, Halsey KE, Benson JM, Gong TW, Dolan DF, Raphael Y, Martin DM. Mature middle and inner ears express Chd7 and exhibit distinctive pathologies in a mouse model of CHARGE syndrome. Hear Res. 2011;282:184–195. doi: 10.1016/j.heares.2011.08.005. [DOI] [PMC free article] [PubMed] [Google Scholar]
- Kanzaki S, Ito M, Takada Y, Ogawa K, Matsuo K. Resorption of auditory ossicles and hearing loss in mice lacking osteoprotegerin. Bone. 2006;39:414–419. doi: 10.1016/j.bone.2006.01.155. [DOI] [PubMed] [Google Scholar]
- Kim N, Homma K, Puria S. Inertial bone conduction: symmetric and anti-symmetric components. JARO. 2011;12:261–279. doi: 10.1007/s10162-011-0258-3. [DOI] [PMC free article] [PubMed] [Google Scholar]
- Lysaght AC, Yuan Q, Fan Y, Kalwani N, Caruso P, Cunnane M, Lanske B, Stankovic KM. FGF23 deficiency leads to mixed hearing loss and middle ear malformation in mice. PLoS One. 2014;9:e107681. doi: 10.1371/journal.pone.0107681. [DOI] [PMC free article] [PubMed] [Google Scholar]
- Maison SF, Rosahl TW, Homanics GE, Liberman MC. Functional role of GABAergic innervation of the cochlea: phenotypic analysis of mice lacking GABA(A) receptor subunits alpha 1, alpha 2, alpha alpha 6, beta 2, beta 3, or delta. J. Neurosci. 2006;26:10315–10326. doi: 10.1523/JNEUROSCI.2395-06.2006. [DOI] [PMC free article] [PubMed] [Google Scholar]
- McDonald JH. Handbook of biological statistics. Sparky House Press; Baltimore MD: 2007. p. 305. [Google Scholar]
- Ohlemiller KK, Wright JS, Heidbreder AF. Vulnerability to noise-induced hearing loss in 'middle-aged' and young adult mice: A dose-response approach in CBA, C57BL, and BALB inbred strains. Hearing Res. 2000;149:239–247. doi: 10.1016/s0378-5955(00)00191-x. [DOI] [PubMed] [Google Scholar]
- Peake WT, Rosowski JJ, Lynch TJ., III Middle-ear transmission: Acoustic vs. ossicular coupling in cat and human. Hear Res. 1992;57:245–268. doi: 10.1016/0378-5955(92)90155-g. [DOI] [PubMed] [Google Scholar]
- Qin Z, Wood M, Rosowski JJ. Measurement of conductive hearing loss in mice. Hear Res. 2010;263:93–103. doi: 10.1016/j.heares.2009.10.002. [DOI] [PMC free article] [PubMed] [Google Scholar]
- Ravicz ME, Rosowski JJ, Merchant SN. Mechanisms of hearing loss resulting from middle-ear fluid. Hear Res. 2004;195:105–130. doi: 10.1016/j.heares.2004.05.010. [DOI] [PubMed] [Google Scholar]
- Richter CA, Amin S, Linden J, Dixon J, Dixon MJ, Tucker AS. Defects in middle ear cavitation cause conductive hearing loss in the Tcof1 mutant mouse. Hum Mol Genet. 2010;19:1551–1560. doi: 10.1093/hmg/ddq028. [DOI] [PubMed] [Google Scholar]
- Rosowski JJ, Brinsko KM, Tempel BL, Kujawa SG. The ageing of the middle ear in 129S6/SvEvTac and CBA/CaJ mice: Measurements of umbo velocity, hearing function and the incidence of pathology. JARO. 2003;4:371–383. doi: 10.1007/s10162-002-3047-1. [DOI] [PMC free article] [PubMed] [Google Scholar]
- Samadi DS, Saunders JC, Crenshaw EBC., III Mutation of the POU-domain gene Brn4/Pou3f4 affects middle-ear sound conduction in the mouse. Hear Res. 2005;199:11–21. doi: 10.1016/j.heares.2004.07.013. [DOI] [PubMed] [Google Scholar]
- Schlauch RS, Nelson P. Pure-tone evaluation. In: Katz J, Medwetsky L, Burkard R, Hood L, editors. Handbook of Clinical Audiology. 6th Lippincott Williams and Wilkins; Baltimore MD: 2009. pp. 30–49. [Google Scholar]
- Sergeyenko Y, Lall K, Liberman MC, Kujawa SG. Age-related cochlear synaptopathy: An early-onset contributor to auditory functional decline. J Neuroscience. 2013;33:13686–13694. doi: 10.1523/JNEUROSCI.1783-13.2013. [DOI] [PMC free article] [PubMed] [Google Scholar]
- Steel KP, Moorjani P, Bock GR. Mixed conductive and sensorineural hearing loss in LP/J mice. Hear Res. 1987;28:227–236. doi: 10.1016/0378-5955(87)90051-7. [DOI] [PubMed] [Google Scholar]
- Stenfelt S. Inner ear contribution to bone conduction hearing in the human. Hear Res. 2015;329:41–51. doi: 10.1016/j.heares.2014.12.003. [DOI] [PubMed] [Google Scholar]
- Stenfelt S, Goode RL. Bone-conducted sound: physiological and clinical aspects. Otol Neurotol. 2005;26:1245–1261. doi: 10.1097/01.mao.0000187236.10842.d5. [DOI] [PubMed] [Google Scholar]
- Stenfelt S, Hato N, Goode RL. Factors contributing to bone conduction: The middle ear. J Acoust Soc Am. 2002;111:947–959. doi: 10.1121/1.1432977. [DOI] [PubMed] [Google Scholar]
- Tonndorf J. Bone conduction. In: Tobias JV, editor. Foundations of Auditory Theory. Academic Press; New York: 1972. pp. 197–237. [Google Scholar]
- Tonndorf J, Campbell RA, Bernstein L, Reneau JP. Quantitative evaluation of bone conduction in cats. Acta Oto-Laryngol. 1966a;213(Suppl):10–38. [Google Scholar]
- Tonndorf J, Duvall AJ, III, Voots RJ. Comparative studies in bone conduction in cats, dogs, guinea pigs and rats. Acta Oto-Lar. 1966b;213(Suppl):55–71. [Google Scholar]
- Tonndorf J, Tabor JR. Closure of the cochlear windows: its effects upon air and bone-conduction. Ann Otol Rhinol Laryngol. 1962;71:5–29. doi: 10.1177/000348946207100101. [DOI] [PubMed] [Google Scholar]
- Tyrer HE, Crompton M, Bhutta MF. What have we learned from murine models of otitis media? Curr Allergy Asthma Rep. 2013;13:501–511. doi: 10.1007/s11882-013-0360-1. [DOI] [PubMed] [Google Scholar]
- Wever EG, Lawrence M, Smith KR. The middle ear in sound conduction. Arch Otolaryngol. 1948;48:19–35. doi: 10.1001/archotol.1948.00690040026003. [DOI] [PubMed] [Google Scholar]
- Whittemore KR, Merchant SN, Poon BB, Rosowski JJ. A normative study of tympanic membrane motion in humans using a laser Doppler vibrometer (LDV) Hear Res. 2004;187:85–104. doi: 10.1016/s0378-5955(03)00332-0. [DOI] [PubMed] [Google Scholar]
- Wiley TL, Cruickshanks KJ, Nondahl DM, Tweed TS. Aging and middle ear resonance. J Am Acad Audiol. 1999;10:173–179. [PubMed] [Google Scholar]
- Willot JF, Turner JG, Carlson S, Ding D, Bross LS, Falls WA. The BALB/c mouse as an animal model for progressive sensorineural hearing loss. Hear Res. 1998;115:162–174. doi: 10.1016/s0378-5955(97)00189-5. [DOI] [PubMed] [Google Scholar]
- Yoshida A, Hequembourg SJ, Atencio CA, Rosowski JJ, Liberman MC. Acoustic injury in mice: 129/SvEv is exceptionally resistant to noise-induced hearing loss. Hear Res. 2000;141:97–106. doi: 10.1016/s0378-5955(99)00210-5. [DOI] [PubMed] [Google Scholar]
- Zehnder AF, Kristiansen AG, Adams JC, Kujawa SG, Merchant SN, McKenna MJ. Osteoprotegrin knockout mice demonstrate abnormal remodeling ofthe otic capsul and progressive hearing loss. The Laryngoscope. 2006;116:201–206. doi: 10.1097/01.mlg.0000191466.09210.9a. [DOI] [PMC free article] [PubMed] [Google Scholar]
- Zheng QY, Johnson KR, Erway LC. Assessment of hearing in 80 inbred strains of mice by ABR threshold analyses. Hear Res. 1999;130:94–107. doi: 10.1016/s0378-5955(99)00003-9. [DOI] [PMC free article] [PubMed] [Google Scholar]


