Abstract
The Endoplasmic Reticulum (ER) is a critical organelle that synthesizes secretory proteins and serves as the main calcium storage site of the cell. The accumulation of unfolded proteins at the ER results in ER stress. Although the association between ER stress and the pathogenesis of many metabolic conditions have been well characterized using both in vivo and in vitro models, no standardized model concerning ER stress exists. Here we report a standardized model of ER stress using two well characterized ER stress inducing agents, thapsigargin and tunicamycin. Our aim in this current study was two-fold: (1) to characterize and establish which agent is optimal for in vitro use to model acute ER stress and (2) to evaluate which agent is optimal for in vivo use. To study aim 1 we used two well-established metabolic cell lines; human hepatocellular carcinoma (HepG2s) and differentiated mouse adipocytes (3T3-L1). In aim 2 we utilized C57BL/6J mice that were randomized into 3 treatment groups of sham, thapsigargin, and tunicamycin. Our in vitro results showed that tunicamycin worked as a rapid and efficacious inducer of ER stress in adipocytes consistently, whereas thapsigargin and tunicamycin were equally effective in inducing ER stress in hepatocytes. In regards to our in vivo results, we saw that tunicamycin was superior in not only inducing ER stress but also recapturing the metabolic alterations associated with ER stress. Thus, our findings will help guide and inform researchers as to which ER stress agent is appropriate with regards to their model.
Keywords: Tunicamycin, Thapsigargin, ER stress, Liver, Hypermetabolism, Unfolded protein response
Introduction
The endoplasmic reticulum (ER) is a vital organelle involved in the synthesis and maintenance of secretory membrane proteins. It also houses a number of chaperone proteins that ensure quality control by ensuring proper protein folding. During periods of stress, the ER initiates a series of coping mechanisms termed the unfolded protein response (UPR) in attempt to resolve the pathological alterations in protein folding (1, 2). Upon activation, the UPR restructures the cellular transcriptional, translational, and degradation pathways to help resolve the defects in protein folding(3-5). These actions are accomplished through the activation of three trans-membrane ER proteins, namely protein kinase RNA-dependent-like ER kinase (PERK), inositol requiring ER-to-nucleus signal kinase 1 (IRE-1) and activating transcription factor 6 (ATF6) (1, 3-5). The activation of PERK halts protein translation through the phosphorylation of eukaryotic translation initiator factor 2α (eIF2α) (6). While IRE-1 activation initiates the degradation of mis-folded proteins(4), under instances where ER stress is prolonged, the UPR initiates programmed cell death through the actions of C/EBP homologous protein (CHOP) and activating transcription factor 6 (ATF6) (7).
Interestingly, chronic ER stress has been implicated in the pathology of a number of conditions like diabetes, traumatic brain injury, sepsis and neurodegenerative diseases (8-10). Therefore, studying the ER stress response in both an in vitro and in vivo context can help uncover and shed light on the pathology and development of these diseases. Presently there is a number of ER stress inducing drugs that recapitulate the pathological alterations mediated by ER stress. Among these are the well-characterized thapsigargin (TG), an inhibitor of Ca2+-ATPase pump and tunicamycin (TUN), an inhibitor of protein glycosylation. However, currently there is a lack of literature characterizing the optimal dose and specificity of each drug. Since, the ER is one of the major organelles involved in protein synthesis and acts as an intracellular space for calcium storage. We examined the effectiveness of two distinct prominent ER stress inducers; TG and TUN using an in vitro and in vivo model. Thus, our findings help to provide a closer look at each ER stress inducing drug and how they manifest differently in the context of in vitro and in vivo research.
METHODS
Induction of ER stress in vitro
HepG2 cells were cultured in Dulbecco’s Modified Eagle Medium (DMEM low glucose, 1g/L glucose) (Wisent, Toronto, ON, Canada) supplemented with 10% Fetal Bovine Serum (FBS) and 1% Antibiotic/Antimicotic (Wisent). HepG2 cells were seeded in wells 24-48hrs prior to treatments, and treated when cells reached 70% confluence. Medium was removed and replaced with treatments consisting of thapsigargin (25nM, 50nM, 100nM, 200nM) or tunicamycin (2.5ug/ml, 5ug/ml, 10ug/ml, 20ug/ml) (Sigma Aldrich, St. Louis, MO, USA) diluted in medium. 3T3L1 and C3H/10T1/2 adipocytes were maintained in DMEM (4.5g/L glucose) supplemented with fetal bovine serum and differentiated for 10 days following incubation with a differentiation protocol previously described (11). Differentiation was initiated two days post-confluency in DMEM containing 10% Fetal Bovine Serum in presence of a differentiation cocktail (insulin, Dexamethasone, IBMX) for two days. In the two following days, dexamethasone and IBMX were removed. In the following days, the cells were maintained in DMEM, 10% FBS until full differentiation was achieved (day 8) (11). Following differentiation, medium was removed and replaced with treatments consisting of thapsigargin (25nM, 50nM, 100nM) or tunicamycin (2.5ug/ml, 5ug/ml, 10ug/ml) (Sigma Aldrich, St. Louis, MO, USA) diluted in medium.
Induction of ER stress in vivo
Male Balb/c mice (Taconics) were housed and cared in accordance with the Guide for the Care and Use of Laboratory Animals. All procedures performed in this study were approved by the Sunnybrook Research Institute Animal Care Committee (Toronto, Ontario, Canada). Tunicamycin and thapsigargin were purchased from Sigma and dissolved in dimethyl sulfoxide (DMSO) and diluted in sterile 150mM dextrose to obtain a concentration of 10μg/μl. Male Balb/c mice (20-25g) were injected intraperitoneally with tunicamycin solution (1μg/g body mass) as described previously. For thapsigargin solution a dose response was conducted using (0.25ug/g, 0.5ug/g and 1ug/g body mass). As controls, mice were injected intraperitoneally with control buffer (150mM dextrose containing 1% DMSO). Adipose and liver tissues were harvested 24hrs post treatment, where as liver tissues utilized for Oil Red O staining was harvested 5 days post treatment with the ER stress inducing agents.
Immunoblotting
Tissues were homogenized in RIPA lysis buffer (50mM Tris-HCl pH 7.5, 150mM NaCl, 1% Igepal, 0.5% sodium deoxycholate, 0.1% SDS, 1mM NaF and protease inhibitors) incubated on ice for 20 min and centrifuged at 10 000 x g for 10 min at 4°C. The infranatant was removed and proteins quantified using the BCA Protein Assay Kit (Pierce). Proteins were resolved by SDS-PAGE followed by Western blotting using antibodies recognizing GRP78 (BiP), inositol-requiring enzyme (IRE1α), eukaryotic initiation factor (eIF2α), CCAAT-enhancer-binding protein (CHOP), alpha/ beta tubulin, glyceraldehyde-3-phosphate dehydrogenase (GAPDH), isocitrate dehydrogenases (IDH1), and Activating transcription factor 6 (ATF-6) (Novus Biologicals). All antibodies were purchased from Cell Signaling unless otherwise stated. Species appropriate secondary antibodies conjugated to horse radish peroxidise (HRP) (BioRad) were used and proteins visualized by enhanced chemiluminescence using the BioRad ChemiDoc MP Imaging System.
Semi-Quantitative PCR
Total RNA was extracted from mouse liver using TRIzol-chloroform (Life Technologies) with subsequent purification using the RNeasy Kit (Qiagen) according to the manufacturer’s instructions. RNA (2μg) was transcribed to cDNA using the high capacity cDNA reverse transcription kit (Applied Biosystems). Real-time quantitative PCR was performed using the Applied Biosystems StepOnePlus Real-Time PCR System. The sequences of all primers are listed in Supplementary Table 1.
Oil Red O Staining
Tissues were perfused with phosphate-buffered saline, coated with OCT (optimal cutting temperature compound) (Tissue-Tek), placed on dry ice and stored at -80°C until further analysis. Frozen tissue blocks were sectioned 10μm thick, mounted on slides and fixed in formaldehyde (40%) for 1 min. The slides were stained with Oil Red O for 10 min at room temperature, rinsed with water and stained using Gill's hematoxylin for 1 min. The slides were washed with water, mounted with aqueous mounting medium and imaged using the Leica DM 2000 LED microscope.
Immunofluorescence staining & microscopy
Cells on eight chamber slides were fixed in paraformaldehyde, blocked with 1% serum bovine serum albumin in PBS and were stained with antibodies against cleaved-ATF6, BiP at a dilution ratio of 1:200 overnight. Slides were washed and incubated for 1 hr at room temperature with the appropriate secondary antibodies (each at a dilution factor of 1:500). The ER tracker used was from Invitrogen and used according to the manufacturers protocol. Slides were washed and counterstained with DAPI before mounting. Slides were stored in 4°C. Slides were imaged using a Zeiss spinning disk confocal microscope. Cytokine/inflammatory profile. Rodent sera was collected and utilized to compare inflammatory profiles between control, thapsigargin and tunicamycin treated samples. Using the Multiplex platform (Millipore, MA), a panel of pro-inflammatory cytokines, chemokines and growth factors were all analyzed. Raw data was processed using Millipore Analyst software and all values are presented as mean ± SEM for the respective cytokine concentration, expressed in μg/ml.
Statistical analysis
All the mouse data was analyzed using student’s t-test, where as the in vitro data a one-way ANOVA with a Bonferroni post-hoc test was used in comparing the groups. Heatmaps are represented as the mean cytokine concentration for each of the control, TG and TUN groups respectively using GNU Octave. All other graphs were created using Graphpad Prism 5.0 (San Diego, CA) and analyzed statistically using SPSS 20 (IBM Corp., NY), with significance accepted at p<0.05.
RESULTS
Characterizations of ER stress inducers TG and TUN in vitro
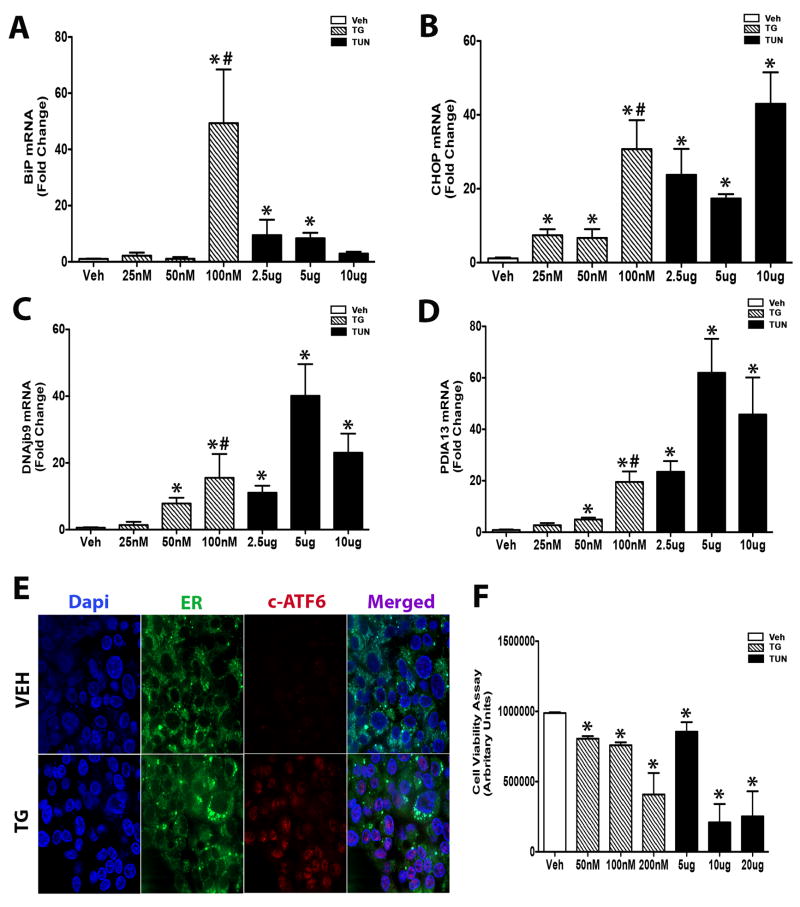
To assess which of drug, TG or TUN is more effective at inducing ER stress in an in vitro modeling system, we treated human hepatocellular carcinoma cells (HepG2) and primary mouse embryonic adipocytes (3T3-L1 and C3H/10T1/2) with both drugs and performed a comparative analysis. The selection of these specific cell lines were based on the criteria that they have been widely used in the in vitro study of ER stress in numerous disease models. Treatment of hepatocytes with TUN yielded a consistent heightened ER stress response as compared to TG at the treated concentrations. Up-regulation of binding immunoglobulin protein (BiP) and C/EBP homology protein (CHOP) gene expression was seen with TUN doses tested (Figure 1A-B). Additionally, key unfolded protein response (UPR) markers DNAj homologue (DNAjb9) and protein Disulfide Isomerase Family A Member 3 (PDAI3) transcript were consistently induced with TUN relative to control (Figure 1C-D). Thapsigargin treatment induced ER stress gene expression consistently only at the elevated concentrations of 50 and 100 nM (Figure 1A-D). We also confirmed the effects of TG to induce ER stress at 100nM by assessing ATF-6 shuttling, which upon ER stress is cleaved and transported to the ER from the Golgi (Figure 1E). To eliminate the possibility of cytotoxicity effects of these ER stress inducers, we performed a cell viability assay to further assess their efficacy at the preferred doses. Viability was quantifiably reduced with both ER stress-inducing agents relative to control (Figure 1F). However, significant effects on cell viability were noticed with the higher TG (200nM) and TUN (10 and 20ug) (Figure 1F). In summary, TG at a dose of 100nM and TUN at a dose of 5ug both yielded robust ER stress induction with limited adverse effects on cell viability relative to control and other doses tested.
Figure 1. Tunicamycin and thapsigargin are equally induce ER stress in Hepatocytes.
A-D) HepG2 cells were exposed to either TG (25nM, 50nM, 100nM) or TUN (2.5ug, 5ug, 10ug) for 24 Hrs, and total RNA was extracted and transcribed to cDNA. Relative mRNA levels of the indicated ER stress/UPR genes were quantified using real-time PCR and normalized to 18S rRNA. E) Immunostaining of cleaved-ATF6 (red), ER (green), and nuclei (blue) upon stimulation with vehicle or TG (100 mM) for 24hrs. F) Cell viability assay were performed after HepG2s were incubated with various doses of TG or TUN based on quantitation of the ATP present. Thapsigargin TG); tunicamycin (Tun). Data shown are in mean ± SEM, *p<0.05 vs vehicle, # p<0.05 vs TUN (5ug) (n=6).
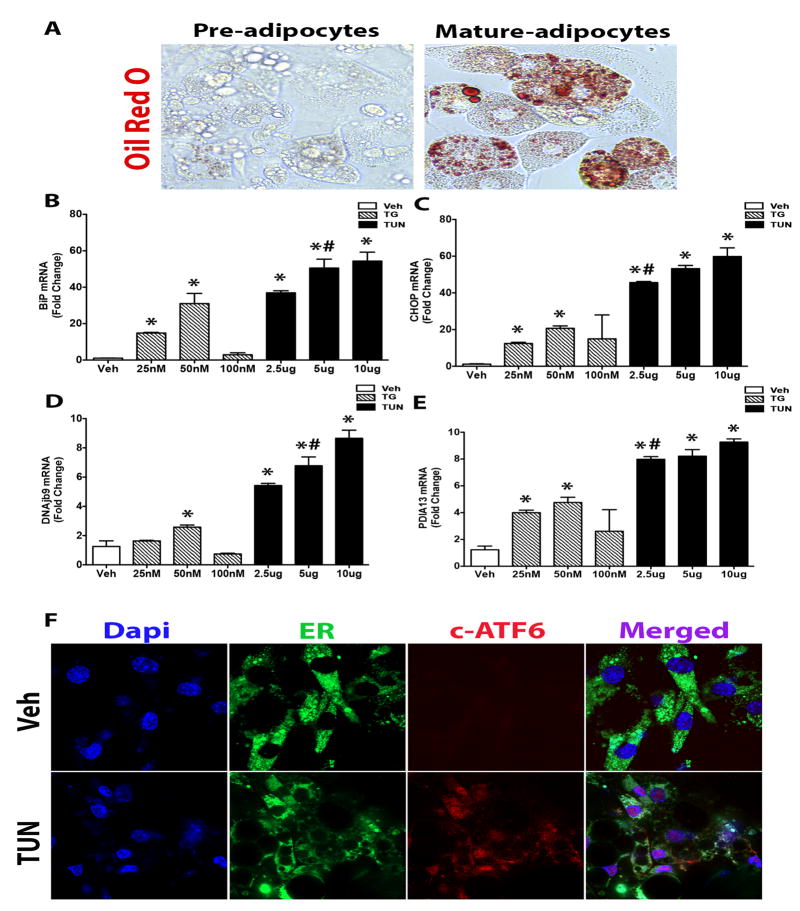
Similarly to hepatocytes, differentiated mature adipocytes showed a heightened sensitivity to TUN as assessed by enhanced gene expression of ER stress and UPR markers BiP, CHOP, DNAjb9, and PDAI3 when compared to TG in 3T3-L1 (Figure 2A-E). In fact, TUN at a dose of 5ug consistently yielded robust ER stress induction, which was also confirmed by immunofluorescence staining of cleaved-ATF6 (Figure 2F). Similar findings were also observed in C3H/10T1/2 mature adipocytes, confirming our 3T3-L1 adipocyte data (Supplementary Figure 1). Additionally, TUN at a dose of 5ug/ml compared to 10ug has previously been shown not to adversely affect cell viability (16). Interestingly, TG doses lower than 100nM was effective also in activating ER stress in these mature adipocytes, although not to the same degree as TUN at a dose 5ug/ml (Figure 2B-E). We believe that 100nM of TG was toxic to the adipocytes as gross observation of these cells indicated unhealthy morphology, which explains why lower doses of TG (25mM, 50mM) was able to induce ER stress. Collectively, this data indicates that the level of ER stress induction by these two drugs is casually linked to cell type and further demonstrates selective sensitivity in expression. Nevertheless, since both cells types responded well to TUN at a dose of 5ug consistently, we suggest that this dose and agent is superior when it comes to the in vitro study of ER stress.
Figure 2. Tunicamycin is a more robust inducer of ER stress in Adipocytes.
A) Oil Red O staining confirming full differentiation of 3T3-L1 cells to mature adipocytes before treatments were initiated. B-E) 3T3-L1 cells were exposed to either TG (25nM, 50nM, 100nM) or TUN (2.5ug, 5ug, 10ug) for 24 Hrs, and total RNA was extracted and transcribed to cDNA. Relative mRNA levels of the indicated ER stress/UPR genes were quantified using real-time PCR and normalized to 18S rRNA. F) Immunostaining of cleaved-ATF6 (red), ER (green), and nuclei (blue) upon stimulation with vehicle or TUN (5ug) for 24hrs. Thapsigargin (TG); tunicamycin (Tun). Data shown are in mean ± SEM, *p<0.05 vs vehicle, # p<0.05 vs TG. (n=6).
Characterizations of ER stress inducers TG and TUN in vivo
To assess ER stress in vivo, we performed interperitoneal injection of either TG (0.5ug/g/body weight) or TUN (1ug/g/body weight) in mice. The dose selected for TUN in vivo is in the mid-range of doses used by others and does not elicit cytotoxic effects as assessed by mouse survival from previous studies (12-14). Unfortunately, choosing a TG dose in vivo has been difficult as literature of TG use in vivo is scarce. In order to proceed with using TG in a mouse model to evaluate the effectiveness of TG in ER stress induction, we needed to demonstrate that our dose of TG (0.5ug/g/body) did not compromise mouse survival. In fact, we found that using TG at a dose of 0.5ug/g/body weight was safe and did not elicit any adverse effects on survival in these mice (Supplementary Figure 2). We then examined the induction of ER stress in the liver and adipose tissue of mice treated with either TG or TUN, by assessing the expression of key ER stress and UPR markers.
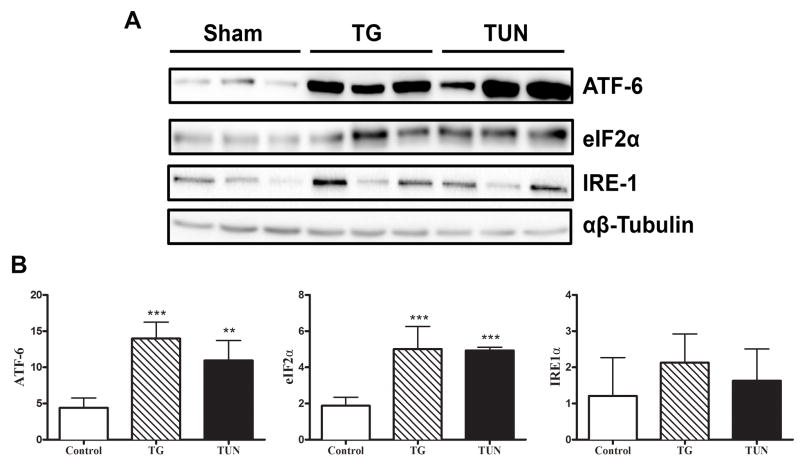
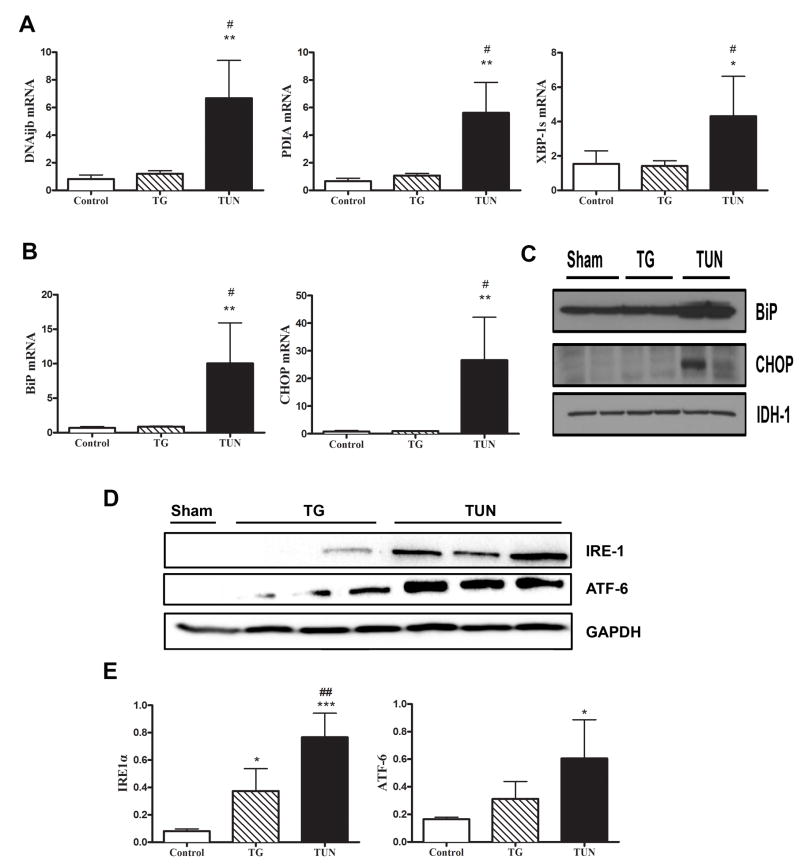
We focused all our analysis on the adipose and liver tissue, which have been shown to exhibit a significant ER stress response following disease or injury. Both TG and TUN treatment in mice resulted in significant expression of ER stress markers ATF6 and eIF2α in adipose tissue (p<0.05) (Figure 3A-B). We next investigated the level of ER stress and UPR activation in hepatic tissue. Tunicamycin treated mice showed significant up-regulation at the mRNA level of Dnajb1, CHOP, PDIA, BiP, and Xbp1s well established markers of ER stress and UPR activation (p<0.05) (Figure 4A-B). These findings were confirmed with the results of western blot analysis (Figure 4C-E). However, TG treatment in mice failed to induce the expression of most ER stress and UPR proteins in the liver (Figure 4A-E).
Figure 3. No difference in ER stress induction in the epididymal fat of TG or TUN mice.
Male Balb/c mice were injected with either control buffer (Con) or thapsigargin (TG) tunicamycin (Tun). After 24 h, the epididymal fat pads were dissected and A) Equal amounts of protein were resolved by SDS-PAGE followed by immunoblotting using antibodies recognizing ATF-6, eIF2α, and IRE1α. B) Densitometry quantification of ER stress proteins expressed over loading control α/β tubulin. Data shown are in mean ± SEM, *p<0.05 vs sham, # p<0.05 vs TG. (n=3-4).
Figure 4. Tunicamycin not thapsigargin induces hepatic ER stress in vivo.
Male Balb/c mice were injected with either control buffer (Con) or thapsigargin (TG) tunicamycin (Tun). After 24 h, the livers were dissected and A-B) total RNA was extracted and transcribed to cDNA. Relative mRNA levels of the indicated ER stress/UPR genes were quantified using real-time PCR and normalized to 18S rRNA. C-D) Equal amounts of protein were resolved by SDS-PAGE followed by immunoblotting using antibodies recognizing BiP, CHOP, IRE1α, and ATF-6. E) Densitometry quantification of ER stress proteins were either expressed over loading control GAPDH or IDH-1. Data shown are in mean ± SEM, *p<0.05 vs sham, # p<0.05 vs TG. (n=3-4).
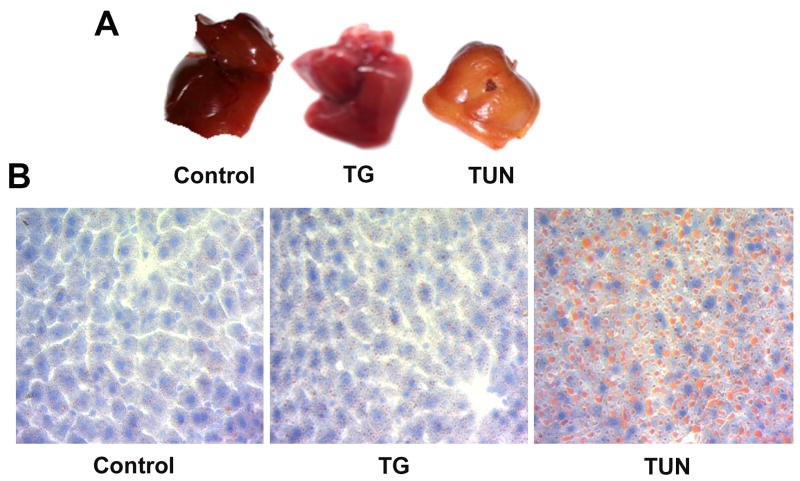
It has been widely reported that the ER is the site of triglyceride synthesis and early lipid droplet formation (15). In addition to this, activation of the ER stress response has been shown to elicit significant lipolysis in adipose tissue as well as hepatic de novo lipogenesis (15). The unexpected and striking differences in liver appearance of mice treated with TUN and TG (Figure 5A), led us to question whether ER stress mediated hepatic steatosis was also evident under these conditions. Hepatic steatosis is characterized by accumulation of lipids, mainly triglycerides, in the cytoplasm of hepatocytes. Using oil red O staining, TUN treated mice showed an abundance of fat infiltration in the liver (Figure 5B). In contrast, the livers of both sham and TG treated mice showed no evidence of hepatic steatosis, indicating that they likely do not suffer from a substantial ER stress response, and in agreement with the evaluations of ER stress in this tissue earlier (Figure 4). Collectively, these results indicate that TUN is superior to TG with regards to the activation of hepatic ER stress in addition it is able to capture the ER stress mediated fatty liver phenotype in vivo.
Figure 5. Tunicamycin not thapsigargin induces hepatic steatosis in vivo.
(A) Histopathology and liver appearance of mouse liver tissue from Sham, TG, and TUN treated mice. (B) Oil Red O staining showing lipids and nuclei (blue) in livers of Sham, TG, and TUN treated mice. TG; thapsigargin, TUN; tunicamycin. (n=3-4).
Hepatic steatosis is one of the key features of inflammation. In fact, there is growing interest in the contributions of both inflammation and ER stress to metabolic diseases associated with obesity like diabetes (17). As such, measurement of inflammation was conducted to evaluate ER stress activation in mice treated with either TG or TUN. In an attempt to characterize inflammation associated with ER stress, we conducted an immune-screening cytokine assay in the serum of mice treated with either TG or TUN. The Multi-analyte analysis of systemic inflammation revealed that TG had a 2 to 5-fold significant increase in chemokine and pro-inflammatory expression, relative to controls (Supplemental Figure 3). When specifically comparing both TG and TUN treatments, TG had increased cytokine protein expression for a multitude of cytokines including: GM-CSF, RANTES, IFN-γ, IL-1α, TNF-α, IL-2, IL-4, IL-5 and IL-12 (Supplemental Figure 2). Although TUN did result in a slight increase in chemokine and pro-inflammatory cytokine expression relative to controls, notable increases were only reported for immune mediator GM-CSF, systemic inflammatory indicator IL-6, and hepatic IL-1β induction (Supplemental Figure 2). Collectively, these findings suggest that after treatment, TG is more sensitive to inducing a systemic immune response characterized by the aforementioned mediators.
DISCUSSION
The ability to accurately model ER stress in vitro and in vivo is critical for uncovering the pathology and development of such conditions as diabetes, burns, traumatic brain injury, and sepsis all of which ER stress has been implicated (8, 9, 16). By using two different approaches or models of study (in vitro and in vivo), we sought to establish the effectiveness of two key ER stress inducers in recapitulating the ER stress response. The current study used thapsigargin and tunicamycin as our ER stress inducing agents due to being both readily available and have widely used in research involving the ER. Our in vitro experiments showed that tunicamycin worked as a rapid and efficacious inducer of ER stress in hepatocytes and adipocytes. The experiments in vivo showed that tunicamycin was superior in not only inducing ER stress but also recapturing the metabolic alterations associated with ER stress.
The well-characterized thapsigargin and tunicamycin, act by triggering ER stress through the inhibition of sarco/ER Ca2+ ATPase (SERCA) activity to deplete calcium storage from the ER and protein glycosylation, respectively. TUN treatment and TG only at 100nM in hepatocytes was found to serve as a rapid and potent inducer of key ER stress proteins CHOP, BiP and UPR markers (DNAJb9, PDAI3). Furthermore, treatment of adipocytes with TUN was more effective in the expression of ER stress proteins CHOP and BiP as well as UPR markers (DNAJb9, PDAI3). It is, of course, possible that the differential response of our hepatocyte and adipocyte cells to the two ER stress inducing drugs may be explained by dosing uniformity. This is unlikely, as the doses of the two drugs we have used covered a wide range and characterized to maximize cell viability (17,15). As such we believe that our cell culture findings support that TUN is the more effective ER stress inducer overall, whereas TG is a reliable ER stress inducer only in hepatocytes.
We next studied the effects of TG and TUN on their ability to induce ER stress in vivo using a mouse model. Both TG and TUN showed a similar ER stress profile in adipose tissue compared to sham mice. However, in respect to adipose tissue more specific assessment of ER stress output such as lipolysis or adipose tissue remodeling might be warranted to conclude the level of ER stress activation by these two drugs. Upon assessing the effects of these two drugs in the liver, TUN treatment appeared to be liver specific, as hepatic ER stress was significantly up regulated compared to other tissues assessed. The liver specific effects of TUN induced ER stress was corroborated by our gross pathological and histological analysis of hepatic lipid accumulation. Collectively, our animal model experiments supported TUN as a potent and effective in vivo inducer of acute ER stress in comparison to TG.
It is well known that ER stress activation disturbs lipid homeostasis in both the liver and adipose tissue (12,14). Though we observed a mild activation of ER stress in the adipose tissue of TG treated mice, the absence of the hepatic steatosis phenotype in mice treated with TG compared to TUN indicates that the ER stress response was likely not evoked by this drug (18). With regards to the cause of the hepatic steatosis phenotype seen in the TUN treated mice, two explanations may be considered. For one, the hepatic steatosis phenotype is likely attributed to TUN mediated activation of de novo-lipogenesis by way of activating the ER stress response (19, 20). This is in line with studies that have reported ER stress induction leads to the accumulation of mature SREBP1a and SREBP1c, regulators of de novo lipogenesis (20, 21). Alternatively, the hepatic lipid accumulation can be explained by ER stress mediated lipolysis activation in adipose tissue (14, 15). However, the latter is less likely as TG treatment resulted in ER stress activation in adipose tissue without the fatty liver phenotype seen in TUN treated mice, likely suggesting that ER stress mediated hepatic steatosis is a result of de novo lipogenesis not lipolysis.
Conclusion
Our findings here provide unique insights and valuable information as to the potency profile of these two commonly used ER stress agents in hopes of standardizing an in vitro and in vivo ER stress model. Misguided use of either class of ER stress inducing agents in vitro or in vivo could potentially result in the lack of observed efficacy or even toxicity. The lack of significant progress in uncovering ER stress mediated disease progression has often been blamed on flawed agents that aim to fully recapture the pathology of ER stress. Thus, we hope that the data presented here will be a valuable guide for those researchers investigating ER stress pathology in diverse experimental setups and contexts, which could contribute to the identification of future points of intervention in many important human diseases affected by ER stress.
Supplementary Material
Acknowledgments
This study was supported by the Canadian Institutes of Health Research # 123336, CFI Leader’s Opportunity Fund: Project # 25407, and the National Institutes of Health 2R01GM087285-05A1.
References
- 1.Hetz C. The unfolded protein response: controlling cell fate decisions under ER stress and beyond. Nat Rev Mol Cell Biol. 2012;13:89–102. doi: 10.1038/nrm3270. [DOI] [PubMed] [Google Scholar]
- 2.Walter P, Ron D. The unfolded protein response: from stress pathway to homeostatic regulation. Science. 2011;334:1081–1086. doi: 10.1126/science.1209038. [DOI] [PubMed] [Google Scholar]
- 3.Harding HP, Novoa I, Zhang Y, Zeng H, Wek R, Schapira M, Ron D. Regulated translation initiation controls stress-induced gene expression in mammalian cells. Mol Cell. 2000;6:1099–1108. doi: 10.1016/s1097-2765(00)00108-8. [DOI] [PubMed] [Google Scholar]
- 4.Hollien J, Lin JH, Li H, Stevens N, Walter P, Weissman JS. Regulated Ire1-dependent decay of messenger RNAs in mammalian cells. J Cell Biol. 2009;186:323–331. doi: 10.1083/jcb.200903014. [DOI] [PMC free article] [PubMed] [Google Scholar]
- 5.Lin JH, Li H, Yasumura D, Cohen HR, Zhang C, Panning B, Shokat KM, Lavail MM, Walter P. IRE1 signaling affects cell fate during the unfolded protein response. Science. 2007;318:944–949. doi: 10.1126/science.1146361. [DOI] [PMC free article] [PubMed] [Google Scholar]
- 6.Harding HP, Zhang Y, Bertolotti A, Zeng H, Ron D. Perk is essential for translational regulation and cell survival during the unfolded protein response. Mol Cell. 2000;5:897–904. doi: 10.1016/s1097-2765(00)80330-5. [DOI] [PubMed] [Google Scholar]
- 7.Tabas I, Ron D. Integrating the mechanisms of apoptosis induced by endoplasmic reticulum stress. Nat Cell Biol. 2011;13:184–190. doi: 10.1038/ncb0311-184. [DOI] [PMC free article] [PubMed] [Google Scholar]
- 8.Lei X, Zhang S, Barbour SE, Bohrer A, Ford EL, Koizumi A, Papa FR, Ramanadham S. Spontaneous development of endoplasmic reticulum stress that can lead to diabetes mellitus is associated with higher calcium-independent phospholipase A2 expression: a role for regulation by SREBP-1. J Biol Chem. 2010;285:6693–6705. doi: 10.1074/jbc.M109.084293. [DOI] [PMC free article] [PubMed] [Google Scholar]
- 9.Horak P, Tomasich E, Vanhara P, Kratochvilova K, Anees M, Marhold M, Lemberger CE, Gerschpacher M, Horvat R, Sibilia M. TUSC3 loss alters the ER stress response and accelerates prostate cancer growth in vivo. Sci Rep. 2014;4:3739. doi: 10.1038/srep03739. [DOI] [PMC free article] [PubMed] [Google Scholar]
- 10.Morito D, Nagata K. ER Stress Proteins in Autoimmune and Inflammatory Diseases. Front Immunol. 2012;3:48. doi: 10.3389/fimmu.2012.00048. [DOI] [PMC free article] [PubMed] [Google Scholar]
- 11.Wang Q, Bilan PJ, Klip A. Opposite effects of insulin on focal adhesion proteins in 3T3-L1 adipocytes and in cells overexpressing the insulin receptor. Mol Biol Cell. 1998;9:3057–3069. doi: 10.1091/mbc.9.11.3057. [DOI] [PMC free article] [PubMed] [Google Scholar]
- 12.Lee JS, Zheng Z, Mendez R, Ha SW, Xie Y, Zhang K. Pharmacologic ER stress induces non-alcoholic steatohepatitis in an animal model. Toxicol Lett. 2012;211:29–38. doi: 10.1016/j.toxlet.2012.02.017. [DOI] [PMC free article] [PubMed] [Google Scholar]
- 13.Zhang K, Kaufman RJ. Identification and characterization of endoplasmic reticulum stress-induced apoptosis in vivo. Methods Enzymol. 2008;442:395–419. doi: 10.1016/S0076-6879(08)01420-1. [DOI] [PMC free article] [PubMed] [Google Scholar]
- 14.Bogdanovic E, Kraus N, Patsouris D, Diao L, Wang V, Abdullahi A, Jeschke MG. Endoplasmic reticulum stress in adipose tissue augments lipolysis. Journal of cellular and molecular medicine. 2014 doi: 10.1111/jcmm.12384. [DOI] [PMC free article] [PubMed] [Google Scholar]
- 15.Deng J, Liu S, Zou L, Xu C, Geng B, Xu G. Lipolysis response to endoplasmic reticulum stress in adipose cells. J Biol Chem. 2012;287:6240–6249. doi: 10.1074/jbc.M111.299115. [DOI] [PMC free article] [PubMed] [Google Scholar]
- 16.Jeschke MG, Gauglitz GG, Song J, Kulp GA, Finnerty CC, Cox RA, Barral JM, Herndon DN, Boehning D. Calcium and ER stress mediate hepatic apoptosis after burn injury. Journal of cellular and molecular medicine. 2009;13:1857–1865. doi: 10.1111/j.1582-4934.2008.00644.x. [DOI] [PMC free article] [PubMed] [Google Scholar]
- 17.Song J, Zhang XJ, Boehning D, Brooks NC, Herndon DN, Jeschke MG. Measurement of hepatic protein fractional synthetic rate with stable isotope labeling technique in thapsigargin stressed HepG2 cells. Int J Biol Sci. 2012;8:265–271. doi: 10.7150/ijbs.3660. [DOI] [PMC free article] [PubMed] [Google Scholar]
- 18.Liu J, Jin X, Yu CH, Chen SH, Li WP, Li YM. Endoplasmic reticulum stress involved in the course of lipogenesis in fatty acids-induced hepatic steatosis. Journal of gastroenterology and hepatology. 2010;25:613–618. doi: 10.1111/j.1440-1746.2009.06086.x. [DOI] [PubMed] [Google Scholar]
- 19.Day CP, James OF. Steatohepatitis: a tale of two “hits”? Gastroenterology. 1998;114:842–845. doi: 10.1016/s0016-5085(98)70599-2. [DOI] [PubMed] [Google Scholar]
- 20.Kammoun HL, Chabanon H, Hainault I, Luquet S, Magnan C, Koike T, Ferre P, Foufelle F. GRP78 expression inhibits insulin and ER stress-induced SREBP-1c activation and reduces hepatic steatosis in mice. The Journal of clinical investigation. 2009;119:1201–1215. doi: 10.1172/JCI37007. [DOI] [PMC free article] [PubMed] [Google Scholar]
- 21.Fang DL, Wan Y, Shen W, Cao J, Sun ZX, Yu HH, Zhang Q, Cheng WH, Chen J, Ning B. Endoplasmic reticulum stress leads to lipid accumulation through upregulation of SREBP-1c in normal hepatic and hepatoma cells. Molecular and cellular biochemistry. 2013;381:127–137. doi: 10.1007/s11010-013-1694-7. [DOI] [PubMed] [Google Scholar]
Associated Data
This section collects any data citations, data availability statements, or supplementary materials included in this article.


