Abstract
Muscle deconditioning is commonly observed in patients surviving sepsis. Little is known regarding the molecular mechanisms regulating muscle protein homeostasis during the recovery or convalescence phase. We adapted a sepsis-recovery mouse model that uses cecal ligation and puncture (CLP), followed 24 h later by cecal resection and antibiotic treatment, to identify putative cellular pathways regulating protein synthesis and breakdown in skeletal muscle. Ten days after CLP, body weight and food consumption did not differ between control and sepsis-recovery mice, butgastrocnemius weight was reduced. During sepsis-recovery, muscle protein synthesis was increased 2-fold and associated with enhanced mTOR kinase activity (4E-BP1 and S6K1 phosphorylation). The sepsis-induced increase in 4E-BP1 was associated with enhanced formation of the eIF4E-eIF4G active cap-dependent complex, while the increased S6K1 was associated with increased phosphorylation of downstream targets S6 and eIF4B. Proximal to mTOR, sepsis-recovery increased Akt and TSC2 phosphorylation, did not alter AMPK phosphorylation, and decreased REDD1 protein content. Despite the decreased mRNA content for the E3 ubiquitin ligases atrogin-1 and MuRF1, proteasomal activity was increased 50%. In contrast, sepsis-recovery was associated with an apparent decrease in autophagy (e.g., increased ULK-1 phosphorylation, decreased LCB3-II and increased p62). The mRNA content for IL-1β, IL-18, TNFα and IL-6 in muscle was elevated in sepsis-recovery. During recovery after sepsis skeletal muscle responds with an increase in Akt-TSC2-mTOR-dependent protein synthesis and decreased autophagy, but full restoration of muscle protein content may be slowed by the continued stimulation of ubiquitin-proteasome activity.
Keywords: convalescence, mTOR, protein synthesis, protein breakdown, autophagy, proteasome, peritonitis, sepsis
Introduction
During the early acute phase of sepsis, there is significant loss of body weight associated with a marked reduction in lean body and skeletal muscle mass (1). Considerable effort has been expended to better understand the cellular mechanisms responsible for this sepsis-induced cachexia, with the long-term goal of intervening in these processes to prevent or slow the loss of muscle protein and thereby improve contractile function and recovery. Data from a number of independent laboratories are generally consistent and demonstrate that sepsis-induced decreases in muscle protein synthesis and increases in protein degradation are observed 24-48 hrs after cecal ligation and puncture (CLP) (2, 3). Much of the work in this area has concluded that sepsis impairs protein synthesis via an mTOR (mammalian target of rapamycin)-dependent mechanism while protein breakdown is enhanced by activation of the ubiquitin-proteasome pathway (UPP).
Convalescence after severe sepsis in humans may occur over weeks to months, leading to prolonged functional disabilities, cognitive impairment and impaired quality-adjusted survival (4-6). The loss of muscle mass and conditioning is integral to the loss of independence and enhanced frailty in this patient population (7). Information is limited, however, with respect to the mechanisms and temporal progression by which protein balance and muscle mass are restored after the source of sepsis has been eliminated. Understanding of muscle metabolism and conditioning during convalescence has been hindered by the absence of an animal model that focuses attention on recovery after removal of the septic source. For the studies reported here, we have adapted a previously reported murine model of sepsis-recovery, which utilizes a classical cecal-ligation-puncture procedure, followed 24 hrs later by surgical removal of the punctured cecum accompanied by peritoneal lavage and antibiotic administration (8). Utilizing this model, which should more accurately reflect clinical responses to polymicrobial peritonitis followed by surgical extirpation of the sepsis source, we have performed studies to test the hypothesis that protein synthesis is no longer restrained in post-sepsis recovery, and may be amplified in order to restore mass and function of skeletal muscle. This model also permitted us to address a complementary hypothesis, that restoration of muscle protein synthesis and mass would require a concurrent dampening of proteolytic activity that is well documented as part of the early response to sepsis.
Materials and Methods
Animal care
Male C57BL/6 mice aged 10 weeks (26.9 ± 1.9 g) were purchased from Charles River Laboratories (Wilmington, MA) and acclimated for 1 wk in the animal care facility at the Pennsylvania State College of Medicine. Mice were housed individually in shoebox cages with corncob bedding and maintained in a controlled environment (23°C) with a 12h:12h light:dark cycle. They were provided standard rodent chow (Teklad Globak 2019, Harlan Teklad, Boston, MA) and water ad libitum. At the end of acclimation, mice were randomly divided into sepsis-recovery (n = 30) or pair-fed sham controls (n = 10). Only male mice were used in the current study because of the known difference in lean body and muscle mass between sexes. All experiments were approved by the Institutional Animal Care and Use Committee at the Pennsylvania State University College of Medicine and adhered to National Institutes of Health (NIH) guidelines.
Experimental design – sepsis recovery
Polymicrobial peritonitis was induced using CLP as previously described (day 0) (8), with the following modifications. Mice (n = 30) were anesthetized with isoflurane (3-4% induction with 2-3% maintenance; Vedco, St. Joseph, MO) in 100% oxygen. The abdomen was shaved, cleaned with betadine, and a 1 cm midline laparotomy was performed. The cecum was ligated 0.8 cm from the distal end using 4-0 silk (Covidien, Minneapolis, MN) and punctured twice with a 25-gauge needle. A small amount of cecal material was extruded from the puncture sites to ensure patency, and the cecum was returned to the abdominal cavity. The abdominal wall was sutured closed using 5-0 silk, and the skin was closed with metal wound clips. Mice were resuscitated with 1 mL warm sterile 0.9% saline subcutaneous injection with 0.05 mg/kg buprenorphine (Reckitt Benckiser Pharmaceuticals, Richmond, VA) for post-operative analgesia. Septic mice were allowed free access to both food and water for the remainder of the experiment. Daily body weights and food consumption were measured each morning. Starting 24 hrs post-CLP (day 1), antibiotic (0.5 mg meropenem; Fresenius Kabi, Lake Zurich, IL) and buprenorphine were injected subcutaneously (total volume 1ml of sterile saline) twice daily for the next 5 days (days 1-5). Forty-eight hours post-CLP, mice were anesthetized using isoflurane as above and the original incision was reopened. At this time, the ischemic portion of the cecum distal to the original suture ligation was resected and the abscess around the cecumwas removed. The peritoneal cavity was washed with 5 mL warmed saline or until the debris and abscess was cleared. The abdominal incision was closed again in a two-layer fashion. The mice were kept on a warming pad during the procedure and until they regained consciousness. Resuscitation was performed with 1 mL of warmed saline that was injected subcutaneously. Mice were observed through day 10. Sham control mice (n = 10) were pair-fed each morning starting 24-hrs after the sepsis-recovery mice and provided the quantity of food consumed by the sepsis-recovery mice; however, no less than 0.5 g of chow was provided to the control animals to prevent starvation.
Protein synthesis
In vivo protein synthesis was measured using the non-isotopic SUnSET method (9), as modified in our laboratory as previously reported (10). Animals were injected intraperitoneally with puromycin (0.04 μmol/g body weight) dissolved in sterile saline 30 minutes prior euthanasia. At this relatively low-dose, puromycin is incorporated into elongating peptide chains and the global rate of protein synthesis is estimated by determining the relative amount of puromycin-labelled peptides that are formed (9). Mice were then deeply anesthetized with isoflurane inhalation as above. The gastrocnemius from both legs was excised and weighed; a portion was immediately homogenized in ice-cold homogenization buffer and the remainder was freeze-clamped and stored at -80°C. Because of the amount of tissue needed to assure completion of the analyses described below, no muscle was processed for histological examination. Western blotting was performed using an anti-puromycin antibody for the immunological detection of puromycin-labeled peptides (Kerafast, Boston, MA) that are synthesized duringthe 30-minute period between injection and euthanasia.
Western blotting
Western blot analysis was performed as previously described (10). Briefly, a portion of fresh gastrocnemius was homogenized in ice-cold homogenizing buffer (20 HEPES (pH 7.4), 2 EGTA, 0.2 EDTA, 100 KCl, 50 β-glycerophosphate, 50 NaF, 0.5 sodium orthovanadate, 1 Benzamidine, 0.1 PMSF and 1 DTT). The protein concentration of each tissue homogenate was quantified (Bio-Rad Protein Assay, Hercules, CA) and SDS-PAGE was performed using equal amounts of total protein per sample. Each PDVF membrane was stained with Ponceau S (Aqua Solutions, Deer Park, TX) to verify equal protein loading. Blots were then blocked in 5% nonfat dry milk, and incubated overnight with primary antibody at 4°C. Antibodies included (Cell Signaling, Beverly, MA, unless otherwise noted): S6K1, S6K1 (Thr389), rpS6, rpS6 (Ser240/244 and Ser230/235), 4E-BP1 (Bethyl Laboratories, Montgomery, TX), 4E-BP1 (Ser65), eukaryotic elongation factor (eEF)2, eEF2 (Thr56), eEF2 kinase, eEF2K (Ser366; Dr. Chris Proud), ERK (extracellular signal-regulated kinses), ERK1/2 (Thr202/Tyr204), RSK (90 kDa ribosomal S6 kinase), RSK1/2 (Ser380), REDD1 (regulated in development and DNA damage responses; ProteinTech, Chicago, IL), Akt, Akt (Thr308 and Ser473), PRAS40 (proline-rich Akt substrate of 40 kDa), PRAS40 (Thr246), eIF4B, eIF4B (Ser422), AMP-activated protein kinase-α (AMPK), AMPKα (Thr172), tuberous sclerosis complex 2 (TSC2), TSC2 (Thr1462), Unc-51 like autophagy activating kinase 1 (ULK1), ULK1 (Ser757), p62 (aka SQSTM1), light-chain 3B (LC3B)-I and –II, and MyoD and myogenin. Blots were then washed with an appropriate secondary antibody (horseradish peroxidase conjugated goat anti-rabbit IgG) and developed with enhanced chemiluminescence (ECL) reagents (Pierce Chemical, Rockford, IL) according to manufacturer's instruction. Blots were imaged using FluorChem (ProteinSimple, San Jose, CA) and densities in the linear range were quantified using Image J (NIH, Bethesda, MD). Although only representative Western blots for each protein or phospho-protein are presented in the Results, Western blots were run on and data quantified from the gastrocnemius obtained from all sham controls (n = 10) and sepsis-recovery (n = 17) mice).
Ubiquitin proteasome activity
The Proteasome Activity Fluorometic Assay Kit (BioVision; Milpitas, CA) was utilized with the following modifications from the manufacturer's instructions. A portion of the gastrocnemius was homogenized and reconstituted in cold Proteasome Assay Buffer provided by the kit that is free of proteasome inhibitors. A portion of the sample was assayed for protein content (BioRad; Hercules, CA), and 10 μg of protein was loaded into two paired wells, each brought up to 100 μl with additional Assay Buffer. The proteasome substrate was cleaved by proteasome activity and the subsequent release of free AMC was detected by fluorometer (SpectraMax M5; Molecular Devices Corporation, Sunnyvale, CA). The fluorescence signal (360 nm excitation and 460 nm emission wavelengths) was monitored each 10 minutes for 2 hrs at 37C. Each sample was measured in the presence and absence of the provided proteasome inhibitor to account for non-proteasomal degradation of the substrate, and then subtracted from each measurement. Proteasome chymotrypsin-like activity was calculated by the change in the fluorescence signal, where 1 unit of activity generates 1.0 nmol of the fluorophore 7-Amino-4-methylcoumarin (AMC) per minute, and data were expressed as activity per mg of protein (nmol/min/mg protein).
RNA extraction and real-time quantitative PCR
Total RNA was isolated using Tri-reagent (Molecular Research Center, Cincinnati, OH) and RNeasy mini kit (Qiagen, Valencia, CA) according to manufacturers' protocol, as previously described by our lab (11). Residual DNA contamination was removed by on-column DNase I treatment. RNA was eluted from the column with RNase-free water and quantified (NanoDrop 2000, Thermo Fisher Scientific, Waltham, MA). RNA quality was evaluated on 1% agarose gel. Total RNA (1 μg) was reverse transcribed using superscript III reverse transcriptase (Invitrogen, Carlsbad, CA). Real-time quantitative PCR was performed using 25 ng of cDNA in StepOnePlus system using TaqMan gene expression assay (Applied Biosystems, Foster, CA) for: atrogin-1 (aka MAFbx), muscle RING-finger 1 (MuRF1), interleukin (IL)-1β, IL-6, IL-18, tumor necrosis factor (TNF)-α, and insulin-like growth factor (IGF)-I using primers as described previously (10, 12). The comparative quantitation method 2-ΔΔCt was used to present gene expression in reference to the endogenous control, GAPDH.
Statistical analysis
Data are presented as the mean ± standard error of mean (SEM) with the number of mice in each group presented in the figure or table legend. Statistical analysis of the data was performed using a two-side t-test to compare groups (GraphPad Prism version 6.0, La Jolla, CA), and group differences were considered significant when P < 0.05.
Results
Body weight and food intake
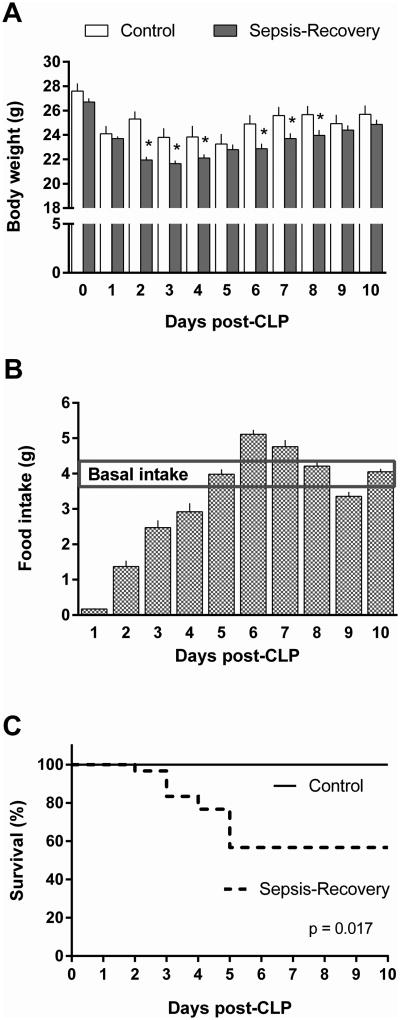
In the sepsis-recovery mice, body weight initially declined 3.5 g over the first 24 hours following CLP (Figure 1A). A maximal decrease in body weight of the septic mice occurred on day 3, with an average loss of 5 g from the pre-sepsis weight. This decrease in body weight persisted even after removal of the septic source on day 2 and began to reverse on day 4. In pair-fed control mice, body weight decreases were also observed, reflecting the decreased basal dietary intake observed in sepsis-recovery mice. Throughout most of the study interval, body weight was lower in the sepsis-recovery group, from the time at which CLP was performed until day 9 of the study. However, before CLP/surgery and by day 9 of the study, body weight did not differ between groups.
Figure 1. Body weight, food intake and survival over time in septic mice.
A: Change in daily body weight of sepsis-recovery mice compared to time-matched pair-fed control mice. *P < 0.05 comparing sepsis-recovery mice to control mice on the same day; values are mean ± SEM. B: Food intake in the sepsis-recovery mice per day which was provided to the control mice for pair-feeding. The horizontal line represents the average basal food intake in these mice prior to experimentation. C: Kaplan-Meier survival curves comparing sepsis-recovery mice to pair-fed control mice. n = 30 initially for sepsis-recovery and 17 mice from days 5-10, and n = 10 control mice.
Before the experiment, all mice had an average basal intake of 4.1 ± 0.3 g of dry food per day (Figure 1B). Food intake following sepsis was maximally decreased in the first 24 hours following CLP and then steadily increased toward baseline through day 5. On day 5 and through the remainder of the experiment, food consumption was similar to baseline intake (Figure 1B). By day 10, there was no difference between the two groups for food intake. Thus, this time point was selected to investigate whether muscle metabolism had returned to basal levels.
Survival
Survival in the sepsis-recovery mice was 57% as 17 of 30 mice survived to day 10 post-CLP. There were no deaths in the first 24 hours, and all mice surviving through day 5 completed the study. There was no mortality in the pair-fed sham control mice (Figure 1C).
Muscle protein synthesis and mTORC1 signal transduction
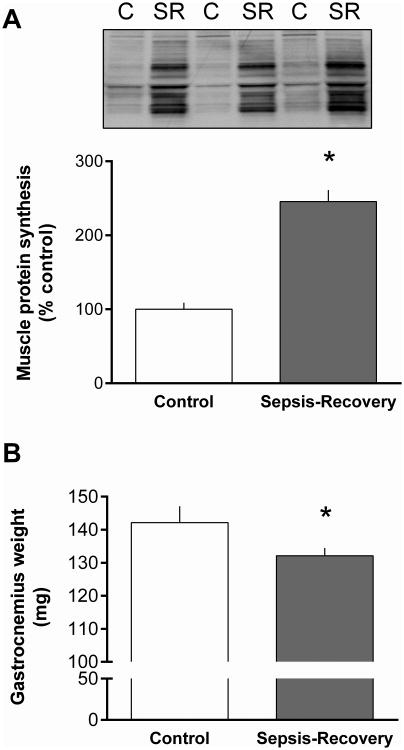
The relative rate of global protein synthesis determined on day 10 was increased more than 2-fold in the gastrocnemius during the sepsis-recovery period compared to pair-fed control values (Figure 2A). At this time point, the mass of the gastrocnemius had not been fully restored and remained 7% lower in the sepsis-recovery group compared to time-matched controls (Figure 2B).
Figure 2. Gastrocnemius protein synthesis and weight in sepsis-recovery.
Global protein synthesis was determined in vivo by measuring puromycin incorporation into protein expressed as percentage of pair-fed control values. A: Representative Western blot of gastrocnemius from two sham control (C) and two sepsis-recovery (SR) mice showing puromycin-labeled proteins during the 30-min post-injection period, assessed using the SUnSET method (9). Ponceau S staining indicated equal protein loading (data not shown). Bar graph quantitates Western blot densitometry for all mice. Values are mean ± SEM; n = 17 for sepsis-recovery and 10 for pair-fed controls. *P < 0.05 compared to pair-fed controls. B: Gastrocnemius weight in sepsis-recovery and time-matched control mice. Values are mean ± SEM; n = 17 for sepsis-recovery and 10 for pair-fed controls. *P < 0.05 compared to pair-fed controls.
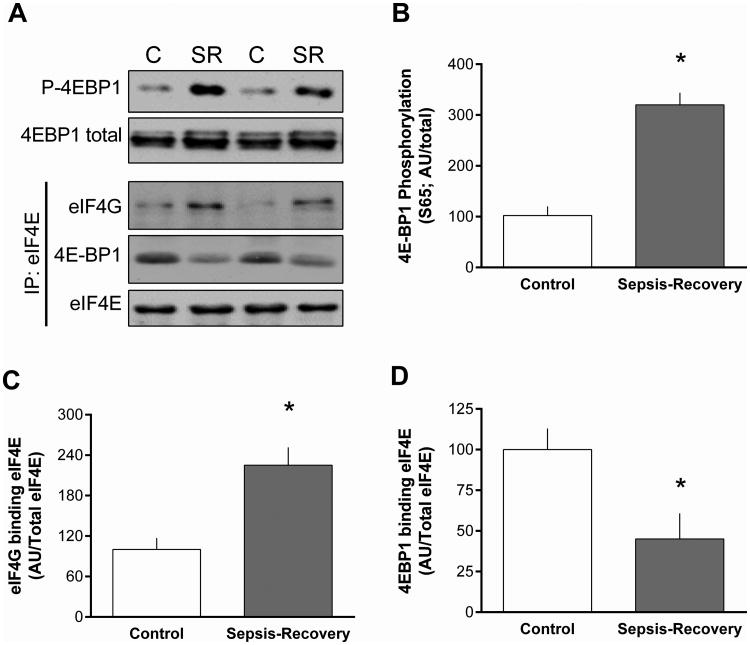
To investigate the mechanisms potentially contributing to the increased muscle protein synthesis during the recovery phase, the phosphorylation state of substrates involved in the canonical mTOR complex 1 (mTORC1) pathway were assessed (Figure 3). The two principle downstream proteins phosphorylated by mTORC1 are 4E-BP1 and S6K1 that stimulate the initiation phase of translation (2). There was more than a 3-fold increase in phosphorylation of Ser65-phosphorylated 4E-BP1 in gastrocnemius of septic-recovery mice that occurred independent of a change in total 4E-BP1 (Figure 3A, B). The increased 4E-BP1 phosphorylation appeared functionally important as it was associated with a redistribution of eIF4E to the active eIF4E-eIF4G complex (Figure 3C) from the relatively inactive eIF4-4EBP1 complex (Figure 3D).
Figure 3. Phosphorylation 4E-BP1 and formation of active eIF4E•eIF4G complex in muscle during sepsis-recovery.
A: Representative Western blots for total and phosphorylated (Ser65) 4E-BP1, and the interaction of immunoprecipitated eIF4E with eIF4G or 4E-BP1. B-D: Western blots were quantified with the control value are set to 100 arbitrary units (AU). Values are means ± SEM; n = 17 and 10 mice, respectively. *P < 0.05 compared to control values for each blot.
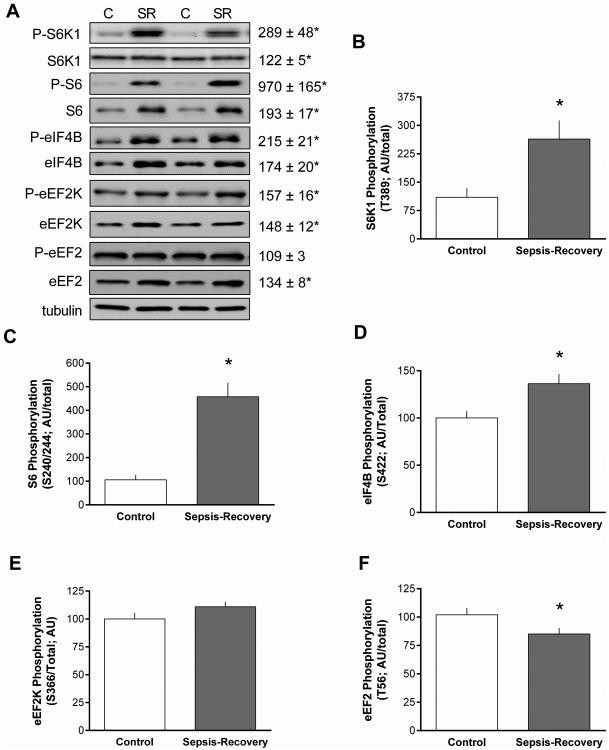
S6K1 is also an mTORC1 substrate and Thr389-phosphorylated S6K1 was increased almost 3-fold in septic-recovery mice (Figure 4A). There was also an increase in total S6K1 protein (Figure 4A) in sepsis-recovery that was smaller in magnitude than the elevation in phosphorylation, yielding a greater than 2-fold increase in the ratio of S6K1 phosphorylated/total (Figure 4B). The ribosomal protein S6 and eIF4B are known substrates for S6K1, and the hyper-phosphorylation and activation of S6K1is routinely associated with increased phosphorylation these proteins (13). Thus, the increased S6K1 activity observed in gastrocnemius during sepsis-recovery was substantiated by the coordinated increase in the phosphorylation of both S6 (Ser240/244) and eIF4B (Ser422) (Figure 4A). Furthermore, during sepsis-recovery there was an increase in the total amount of S6 and eIF4B. Hence, during the recovery period, the increase in S6K1 activity was sufficient to phosphorylate increasing amounts of these two substrates. Accordingly, the ratio of phosphorylated/total for both S6 and eIF4B was elevated in sepsis-recovery compared to control values (Figure 4C, D).
Figure 4. Phosphorylation S6K1 and downstream substrates in muscle during sepsis-recovery.
S6K1 phosphorylation and signal transduction in gastrocnemius from sepsis-recovery and pair-fed control mice. A: Representative Western blots for phosphorylated and total S6K1, S6, eIF4B, eEF2K and eEF2. The final panel is a representative tubulin blot demonstrating equal protein loading. Loading controls (tubulin or actin) were run for all proteins examined, but only representative data are shown. Values to the right of the representative blots are mean ± SEM of the sepsis-recovery mice next to the blot, with control values set to 100 arbitrary units (AU), and *P < 0.05 compared to control values for each blot. B-F: Bar graphs represent the ratio of phosphorylated to total protein. *P < 0.05 sepsis-recovery phosphorylated/total ratio compared to the ratio in pair-fed controls; n = 17 and 10 mice, respectively.
S6K1 is also known to phosphorylate eEF2K at Ser366 (13). Such an increase eEF2K phosphorylation was detected in gastrocnemius during sepsis-recovery, compared to control values (Figure 4A, E). The phosphorylation of eEF2K at this site inhibits its kinase activity (14), and this was confirmed by the concomitant reduction in Thr56-phosphorylated eEF2 (Figure 4A, F). It is noteworthy that the decrease in the ratio of phosphorylated/total eEF2 observed during sepsis-recovery was entirely due to the increase in total eEF2 protein (Figure 4A).
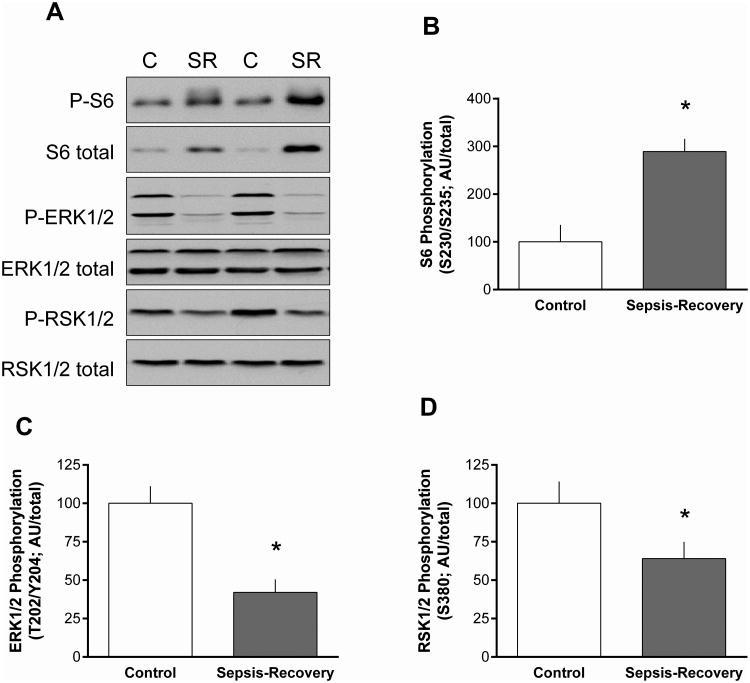
Activation of the ERK pathway can also stimulate protein synthesis via phosphorylation of S6 on Ser235/236 (15), and phosphorylation of this site on S6 was increased in muscle during sepsis-recovery (Figure 5A, B). However, phosphorylation of ERK1/2 (Thr202/Tyr204) and its downstream substrate RSK1/2 (Ser380) was decreased in gastrocnemius during sepsis-recovery, compared to time-matched control values (Figure 5C, D).
Figure 5. ERK1/ERK2 pathway in muscle during sepsis-recovery.
A: Representative Western blots for total and phosphorylated ERK1/2 (Thr202/Tyr204), RSK1/2 (Ser380) and ribosomal protein S6 (Ser235/Ser236). B-D: Bar graphs represent the ratio of phosphorylated to total protein. *P < 0.05 sepsis-recovery phosphorylated/total ratio compared to the ratio in pair-fed controls; n = 17 and 10 mice, respectively.
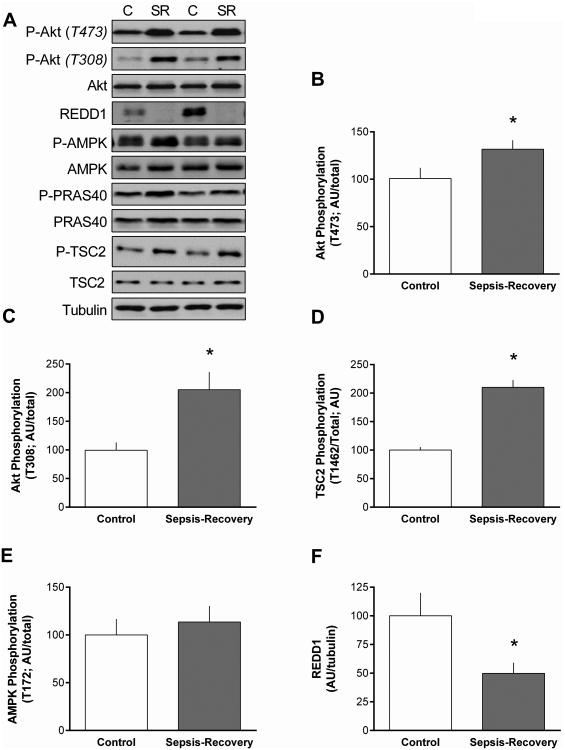
We also assessed the phosphorylation state of upstream proteins central to mTORC1 regulation. The increase in mTORC1 activity was associated with an increased phosphorylation of Akt at both Thr473 (Figure 6B) and Thr308 (Figure 6C) in muscle during recovery from sepsis. There was a concomitant increase in Thr1462 phosphorylation of the Akt-dependent site on TSC2 (Figure 6D). In contrast, the phosphorylation of PRAS40, another Akt substrate, did not differ between sepsis-recovery and control mice (Figure 6A). Likewise, there was no change in Thr172-phosphorylated AMPK between groups (Figure 6E). Finally, in contrast, there was more than a 50% decrease in REDD1, an mTORC1 inhibitory protein (16), in muscle during sepsis-recovery (Figure 6F).
Figure 6. Phosphorylation of proteins upstream of mTORC1 in gastrocnemius during sepsis-recovery.
A-F: Representative Western blots and quantitation are presented for phosphorylated and/or total Akt, PRAS40, TSC2, AMPK, and REDD1. The final panel is a representative tubulin blot demonstrating equal protein loading. Loading controls (tubulin or actin) were run for all proteins examined, but only representative data are shown. Bar graphs: were quantified for phosphorylation of each protein normalized to the total amount of the respective protein, except for REDD1 where total protein was normalized to tubulin. Control values were set to 100 arbitrary units (AU). Values are mean ± SEM. *P < 0.05 sepsis-recovery compared to pair-fed controls values; n = 17 and 10, respectively.
Protein breakdown
Total protein content can be regulated by a change in either protein synthesis and/or protein breakdown. Proteasomal activity is reported to be the principle component of global protein degradation in catabolic states, and the ubiquitin-E3 ligases atrogin-1 and MuRF1 are frequently upregulated in a FoxO1-dependent manner (17). There was an increase in phosphorylated FoxO1 in sepsis-recovery, independent of a change in the total amount of this transcription factor. Because the reliability of antibodies for Western analysis could not be confirmed, we only assessed mRNA content for the two E3 ligases. There was a greater than 50% decrease in atrogin-1 and MuRF1 mRNA in gastrocnemius during sepsis-recovery (Figure 7B, C). In contradistinction, in vitro-determined proteasomal activity was increased in muscle from mice recovering from sepsis (Figure 7D).
Figure 7. Change in the ubiquitin proteasome pathway in gastrocnemius during sepsis-recovery.
Representative Western blot for phosphorylated and total FoxO1 and bar graph presents quantitation of all blots for phosphorylated FoxO1/total FoxO1, and the control value set at 100 AU (A). Using QT-PCR, mRNA content of muscle-specific E3 ligases Atrogin-1 (B) and MuRF1 (C) were normalized to GAPDH in gastrocnemius. Proteasome activity in gastrocnemius was also quantitated (D). Values are mean ± SEM. *P < 0.05 sepsis-recovery compared to pair-fed controls values; n = 17 and 10, respectively.
An alteration in mTORC1 activity can inversely regulate autophagy at least in part by phosphorylating ULK1 (18). In this regard, Ser757-phosphorylated ULK-1 was increased during recovery from sepsis (Figure 8A) in conjunction with a marked reduction in the LC3B-II and increase in p62 (SQSTM1) content (Figure 8B, C). Collectively, these data are consistent with an inhibition of autophagy.
Figure 8. Inhibition of autophagy in gastrocnemius during sepsis-recovery.
Western blots were quantified for phosphorylation of ULK normalized to total ULK (A), LCB3-II normalized to LC3B-I (B), and total p62 normalized to tubulin (C). Representative Western blots are presented above bar graphs, in which control values are set at 100 arbitrary units (AU). Values are mean ± SEM. *P < 0.05 sepsis-recovery compared to pair-fed controls values; n = 17 and 10, respectively.
Muscle cytokines
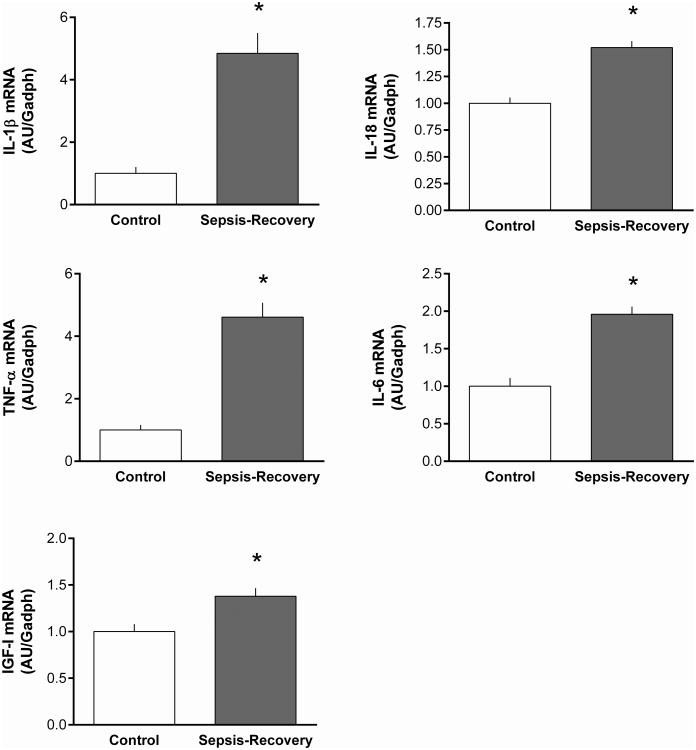
Localized muscle inflammation, as assessed by cytokine mRNA expression, was also determined as these immunomodulatory proteins can regulate muscle protein synthesis and degradation (19). During sepsis-recovery, the mRNA content for IL-1β, IL-18, TNFα and IL-6 were all elevated, compared to time-matched control values (Figure 9A-D). Similarly, the IGF-I mRNA content in muscle was also increased during sepsis-recovery (Figure 9E).
Figure 9. Increase mRNA content for proinflammatory cytokines and IGF-I in gastrocnemius during sepsis-recovery.
Muscle mRNA content was determined for selected inflammatory cytokines and IGF-I and normalized to GAPDH, with control values set at 1.0 AU. All values are mean ± SEM. *P < 0.05 sepsis-recovery compared to pair-fed controls values; n = 17 and 10, respectively.
Myogenic proliferation
Satellite cells in resting skeletal muscle are quiescent but can be rapidly activated in damaged muscle (20). To determine whether satellite cells were activated during the recovery phase of sepsis, we assessed MyoD and myogenin protein content. Western blot analysis indicated that the relative protein content for MyoD (Control = 100 ± 5 AU vs Sepsis = 103 ± 9 AU) and myogenin (Control = 100 ± 14 AU vs Sepsis 104 ± 11 AU) was not statistically different in skeletal muscle from control and sepsis-recovery mice (representative blots not shown).
Discussion
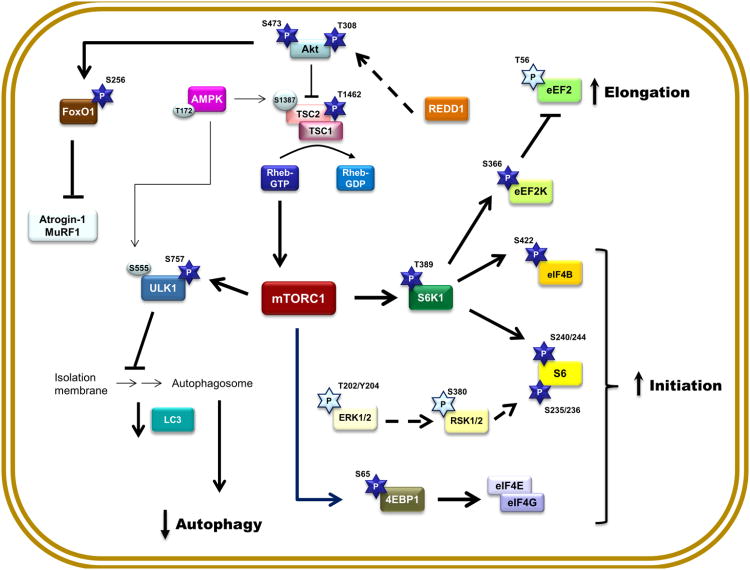
The present data characterize critical components of major signal transduction pathways pertaining to the regulation of skeletal muscle protein balance during the recovery phase after sepsis. Our data demonstrate during convalescence from sepsis there is a period of over-compensation where muscle protein synthesis is elevated above basal control levels, and this increase is mediated by activation of Akt-TSC2-mTORC1 signal transduction. Additionally, there were divergent effects on pathways modulating muscle protein breakdown as evidenced by an increase in the UPP, which appears independent of increases in atrogin-1 and MuRF1, but a decrease in autophagy. As control mice were pair-fed to septic mice, these changes cannot be attributed to the temporary interval of anorexia following induction of sepsis. Based on the data presented herein, we propose a model (Figure 10) whereby putative signal transduction pathways are activated or inhibited in skeletal muscle during the recovery from sepsis and that may be necessary for reestablishing protein homeostasis in this tissue.
Figure 10. Proposed signal transduction network for the activation and inhibition of restorative mechanisms in protein homeostasis in skeletal muscle during the recovery phase after sepsis.
The circulating and/or paracrine/autocrine mediators governing the restorative pathways outline have not been elucidated. Abbreviations are identified within the text of the manuscript. Bold connecting lines and arrows indicate activation of selected pathway components, while bold dashed lines indicate a decrease content of an inhibitory protein. Dark blue 5-pointed stars indicate a sepsis-recovery induced increased in phosphorylation and the presumed activation of respective substrates, whereas light blue 5-pointed stars indicate a sepsis-recovery induced decrease in phosphorylation; light-colored circles indicate phosphorylation sites not altered at this time point (10 days) during recovery from sepsis.
In this mouse model of sepsis-recovery, there is increased phosphorylation of Akt at both Thr308 and Ser473 that is necessary for full activation (21). Although Akt phosphorylates numerous proteins, it is responsible for Thr1462 phosphorylation of TSC2 leading to the inactivation of this inhibitory protein thereby increasing the kinase activity of mTORC1 (22). Hence, the increased phosphorylation of Akt, TSC2 and the mTOR substrates 4E-BP1 and S6K1 are entirely consistent with activation of this protein synthetic pathway. Moreover, the recovery-induced increase in 4E-BP1 and S6K1 phosphorylation appears functionally active. For example, 4E-BP1 is considered a translational repressor since the un- or hypo-phosphorylated form preferentially binds eIF4E (23). However, the increased phosphorylation of 4E-BP1 during the recovery from sepsis is consistent with the dissociation of eIF4E from phosphorylated 4E-BP1 and the increased formation of the active eIF4E-eIF4G complex that stimulates cap-dependent translation. Moreover, the increased phosphorylation of S6 (Ser240/244), eIF4B (Ser422) and eEF2K (Ser366) attests to the enhanced activity of S6K1. Activating the Akt-TSC2-mTORC1 pathway appears to represent a compensatory upregulation during the recovery phase that is capable of enhancing protein synthesis via a coordinated increase of both the initiation and elongation phase of translation. The activation of this canonical pathway is notable as it represents a complete reversal of the hypo-phosphorylation of Akt, mTOR, 4E-BP1 and S6K1, eIF4B and eEF2K detected acutely in muscle at 24 h after CLP (12, 24).
During recovery we also detected an increased phosphorylation of the ribosomal protein S6 at Ser235/236 which initially suggested the stimulation of the Ras-mitogen-activated protein kinase (MAPK) pathway (25). An increased phosphorylation of S6 at Ser235/236 has been reported to regulate recruitment to the 7-methylguanosine cap complex and represents an mTORC1-independent mechanism for enhancing translation (25). The decreased phosphorylation of ERK1/2 and RSK1/2 suggests the increased phosphorylation of S6 at Ser235/S236 was MAPK-independent. The sepsis-induced decrease in ERK1/2 phosphorylation represent an early event (26) which is sustained during the recovery phase. These findings are counter to the increased ERK/RSK phosphorylation seen in response to muscle regrowth in other conditions (27). Moreover, as activation of the ERK pathway is typically observed in conditions where muscle stem cells (e.g., satellite cells) are activated (20), and the markers of satellite cell activation MyoD and myogenin did not differ between control and sepsis-recovery mice, we have no data to suggest the restoration of muscle mass is mediated by the of proliferation satellite cells and/or myogenic progenitor cells.
Acute sepsis (24-hrs post-CLP) increases AMPK phosphorylation and REDD1 protein content in skeletal muscle (24) which is associated with inhibition of mTORC1. However, in the recovery phase, AMPK phosphorylation did not differ from control levels and we detected a decrease in total REDD1. Previous studies have indicated that knockdown of REDD1 protein largely prevents the acute sepsis-induced decrease in muscle protein synthesis (12). Moreover, knockdown of REDD1 also activates (phosphorylates) Akt, thereby stimulating mTORC1 (28). Collectively, these data reveal that the decrease in REDD1 may represent a major mechanism by which muscle protein synthesis is upregulated during recovery from sepsis.
Alterations in protein breakdown are also causally related to the loss of muscle mass in some catabolic conditions (3). Although our characterization of proteolytic pathways was not as fully detailed as for protein synthesis, novel data were obtained in this regard. Activation of Akt during sepsis-recovery was associated with a concomitant increase in Ser256-phosphorylation of FoxO1, a change consistent with the known regulation of this transcription factor by Akt in response to insulin and anabolic agents (29). Moreover, as this increase prevents the translocation of FoxO1 into the nucleus, it may at least partially explain the reduction in mRNA content for the muscle-specific E3 ligases, atrogin-1 and MuRF1. The mRNA levels for these two proteins have routinely been used as surrogate markers for the ubiquitin-proteasome pathway. Therefore, it was somewhat unexpected that muscle proteasomal activity was found to be increased during sepsis-recovery. However, accumulating evidence now suggests that it is often erroneous to equate changes in atrogin-1 and MuRF1 with coordinated changes in proteasomal activity and protein degradation (30). In a previously published model, where rats received a single intravenous injection of live E. coli, proteasomal activity was increased at 6 days post-infection but UPP activity had returned to basal levels by day 10 (31). The apparent discrepancy between these studies may be related to the greater severity and/or complexity of the initial polymicrobial septic insult and cecal resection performed in our current study. Hence, our data indicate the increase in proteolysis is one alteration seen in the acute phase that is sustained and manifested during recovery. This observation offers the possibility that the mechanism responsible for the increased UPP-mediated proteolysis may provide suitable targets for therapeutics directed at enhancing muscle recovery.
Autophagy also degrades cellular organelles and protein and is tightly controlled by mTORC1 and AMPK (32). As AMPK phosphorylation in muscle did not differ between control and sepsis-recovery mice, the increased mTORC1 kinase activity is likely responsible for the increased Ser757 phosphorylation of ULK1 and is consistent with the concomitant decrease in the amount of lipidated LC3B-II. We also detected an increase in p62 protein in sepsis-recovery which suggests a decrease in autophagosome production and autophagy. As opposed to the sustained elevation in proteasomal activity, the early increase in autophagy seen 24 h after CLP appears to have abated during the recovery phase, potentially suggesting that the need to remove damaged proteins and mitochondria has waned. Hence, during sepsis-recovery the two major pathways for protein breakdown are differentially controlled – with sepsis increasing UPP and decreasing autophagy.
The cytokine milieu in skeletal muscle can govern protein homeostasis (19). The magnitude of the increase in IL-1β and TNFα mRNA during sepsis-recovery was comparable to that previously reported 24 h after CLP (12). In contrast, IL-6 mRNA was only increased about 50% during sepsis-recovery which is markedly lower than the 10-fold elevation in IL-6 detected in gastrocnemius during the acute phase of sepsis (12). Sepsis-induced alterations in muscle IL-18 mRNA have not been previously reported, although they are elevated in other wasting diseases (33). These data indicate that muscle is capable of elevated rates of protein synthesis in the presence of elevated expression of intramuscular cytokines. Accordingly, based on the known regulatory role of IL-6 in muscle wasting (34), we speculate that the considerably lower expression of IL-6 mRNA during the recovery versus the acute phase of sepsis may no longer be sufficient to impair protein synthesis. Finally, IGF-I is both an autocrine/paracrine and endocrine anabolic mediator (35) and the elevation in muscle proinflammatory cytokines in acute sepsis is typically associated with a reduction in muscle IGF-I mRNA and protein content (12). The elevation of muscle IGF-I during sepsis-recovery not only suggests resolution of the inflammatory state but also the re-establishment of an anabolic milieu that may aid to restore muscle protein balance.
In these studies we have identified the signal transduction pathways that likely serve as drivers of restoration of muscle mass during convalesce from sepsis. Activation of the Akt-TSC2-mTORC1 pathway, possibly via a reduction in REDD1, stimulates muscle protein synthesis via coordinated increases in translation initiation and elongation and cap-dependent translation. Furthermore, while the increase in mTORC1 also decreased muscle autophagy, full restoration of muscle mass during sepsis recovery appears to be delayed by the continued stimulation of the ubiquitin-proteasome pathway which appears independent of alterations in the muscle-specific E3 ligases atrogin-1 and MuRF1. Our findings offer the possibility that UPP-mediated proteolysis and REDD1 might serve as therapeutic targets for enhancing net protein accretion and limit muscle deconditioning, once the source of sepsis has been controlled. Our studies also provide evidence that the convalescence phase following sepsis should not be viewed simply as a restoration of the pre-sepsis balance between protein synthesis and catabolism.
Acknowledgments
We thank Maithili Navaratnarajah and Anne Pruznak for their excellent technical assistance. This work was supported by a grant from GM 38032 (CHL) and by a post-doctoral fellowship award F32 GM112401 (KTC).
Funding: This work was supported in part by F32GM112401 (KTC) and R01 GM38032 (CHL). KTC also received a 2016 Travel Award from the Shock Society for presentation of this work.
Footnotes
Conflict of Interest Statement: We have no conflicts or financial disclosures to report in relation to this work.
Contributions: All authors conceived and designed the study; collected, analyzed and/or interpreted the data; and drafted and approved the final manuscript.
None of the authors have any conflict of interests to declare.
References
- 1.Wilmore DW. Catabolic illness. Strategies for enhancing recovery. N Engl J Med. 1991;325(10):695–702. doi: 10.1056/NEJM199109053251005. [DOI] [PubMed] [Google Scholar]
- 2.Lang CH, Frost RA, Vary TC. Regulation of muscle protein synthesis during sepsis and inflammation. Am J Physiol Endocrinol Metab. 2007;293(2):E453–9. doi: 10.1152/ajpendo.00204.2007. [DOI] [PubMed] [Google Scholar]
- 3.Hasselgren PO, Menconi MJ, Fareed MU, Yang H, Wei W, Evenson A. Novel aspects on the regulation of muscle wasting in sepsis. Int J Biochem Cell Biol. 2005;37(10):2156–68. doi: 10.1016/j.biocel.2005.01.017. [DOI] [PubMed] [Google Scholar]
- 4.Angus DC, Musthafa AA, Clermont G, Griffin MF, Linde-Zwirble WT, Dremsizov TT, Pinsky MR. Quality-adjusted survival in the first year after the acute respiratory distress syndrome. Am J Respir Crit Care Med. 2001;163(6):1389–94. doi: 10.1164/ajrccm.163.6.2005123. [DOI] [PubMed] [Google Scholar]
- 5.Iwashyna TJ, Ely EW, Smith DM, Langa KM. Long-term cognitive impairment and functional disability among survivors of severe sepsis. JAMA. 2010;304(16):1787–94. doi: 10.1001/jama.2010.1553. [DOI] [PMC free article] [PubMed] [Google Scholar]
- 6.Prescott HC, Osterholzer JJ, Langa KM, Angus DC, Iwashyna TJ. Late mortality after sepsis: propensity matched cohort study. BMJ. 2016;353:i2375. doi: 10.1136/bmj.i2375. [DOI] [PMC free article] [PubMed] [Google Scholar]
- 7.Borges RC, Carvalho CR, Colombo AS, da Silva Borges MP, Soriano FG. Physical activity, muscle strength, and exercise capacity 3 months after severe sepsis and septic shock. Intensive Care Med. 2015;41(8):1433–44. doi: 10.1007/s00134-015-3914-y. [DOI] [PubMed] [Google Scholar]
- 8.Xiao H, Siddiqui J, Remick DG. Mechanisms of mortality in early and late sepsis. Infect Immun. 2006;74(9):5227–35. doi: 10.1128/IAI.01220-05. [DOI] [PMC free article] [PubMed] [Google Scholar]
- 9.Goodman CA, Hornberger TA. Measuring protein synthesis with SUnSET: a valid alternative to traditional techniques? Exerc Sport Sci Rev. 2013;41(2):107–15. doi: 10.1097/JES.0b013e3182798a95. [DOI] [PMC free article] [PubMed] [Google Scholar]
- 10.Steiner JL, Gordon BS, Lang CH. Moderate alcohol consumption does not impair overload-induced muscle hypertrophy and protein synthesis. Physiol Rep. 3(3):2015. doi: 10.14814/phy2.12333. [DOI] [PMC free article] [PubMed] [Google Scholar]
- 11.Lang SM, Kazi AA, Hong-Brown L, Lang CH. Delayed recovery of skeletal muscle mass following hindlimb immobilization in mTOR heterozygous mice. PLoS One. 2012;7(6):e38910. doi: 10.1371/journal.pone.0038910. [DOI] [PMC free article] [PubMed] [Google Scholar]
- 12.Steiner JL, Crowell KT, Kimball SR, Lang CH. Disruption of REDD1 gene ameliorates sepsis-induced decrease in mTORC1 signaling but has divergent effects on proteolytic signaling in skeletal muscle. Am J Physiol Endocrinol Metab. 2015;309(12):E981–94. doi: 10.1152/ajpendo.00264.2015. [DOI] [PMC free article] [PubMed] [Google Scholar]
- 13.Holz MK, Ballif BA, Gygi SP, Blenis J. mTOR and S6K1 mediate assembly of the translation preinitiation complex through dynamic protein interchange and ordered phosphorylation events. Cell. 2005;123(4):569–80. doi: 10.1016/j.cell.2005.10.024. [DOI] [PubMed] [Google Scholar]
- 14.Redpath NT, Foulstone EJ, Proud CG. Regulation of translation elongation factor-2 by insulin via a rapamycin-sensitive signalling pathway. EMBO J. 1996;15(9):2291–7. [PMC free article] [PubMed] [Google Scholar]
- 15.Rolfe M, McLeod LE, Pratt PF, Proud CG. Activation of protein synthesis in cardiomyocytes by the hypertrophic agent phenylephrine requires the activation of ERK and involves phosphorylation of tuberous sclerosis complex 2 (TSC2) Biochem J. 2005;388(Pt 3):973–84. doi: 10.1042/BJ20041888. [DOI] [PMC free article] [PubMed] [Google Scholar]
- 16.Gordon BS, Steiner JL, Williamson DL, Lang CH, Kimball SR. Emerging role for regulated in development and DNA damage 1 (REDD1) in the regulation of skeletal muscle metabolism. Am J Physiol Endocrinol Metab. 2016;311(1):E157–74. doi: 10.1152/ajpendo.00059.2016. [DOI] [PMC free article] [PubMed] [Google Scholar]
- 17.Bodine SC, Latres E, Baumhueter S, Lai VK, Nunez L, Clarke BA, Poueymirou WT, Panaro FJ, Na E, Dharmarajan K, Pan ZQ, Valenzuela DM, DeChiara TM, Stitt TN, Yancopoulos GD, Glass DJ. Identification of ubiquitin ligases required for skeletal muscle atrophy. Science. 2001;294(5547):1704–8. doi: 10.1126/science.1065874. [DOI] [PubMed] [Google Scholar]
- 18.Gallagher LE, Williamson LE, Chan EY. Advances in Autophagy Regulatory Mechanisms. Cells. 5(2):2016. doi: 10.3390/cells5020024. [DOI] [PMC free article] [PubMed] [Google Scholar]
- 19.van Hall G. Cytokines: muscle protein and amino acid metabolism. Curr Opin Clin Nutr Metab Care. 2012;15(1):85–91. doi: 10.1097/MCO.0b013e32834e6ea2. [DOI] [PubMed] [Google Scholar]
- 20.Dumont NA, Wang YX, Rudnicki MA. Intrinsic and extrinsic mechanisms regulating satellite cell function. Development. 2015;142(9):1572–81. doi: 10.1242/dev.114223. [DOI] [PMC free article] [PubMed] [Google Scholar]
- 21.Risso G, Blaustein M, Pozzi B, Mammi P, Srebrow A. Akt/PKB: one kinase, many modifications. Biochem J. 2015;468(2):203–14. doi: 10.1042/BJ20150041. [DOI] [PubMed] [Google Scholar]
- 22.Inoki K, Li Y, Zhu T, Wu J, Guan KL. TSC2 is phosphorylated and inhibited by Akt and suppresses mTOR signalling. Nat Cell Biol. 2002;4(9):648–57. doi: 10.1038/ncb839. [DOI] [PubMed] [Google Scholar]
- 23.Haghighat A, Sonenberg N. eIF4G dramatically enhances the binding of eIF4E to the mRNA 5′-cap structure. J Biol Chem. 1997;272(35):21677–80. doi: 10.1074/jbc.272.35.21677. [DOI] [PubMed] [Google Scholar]
- 24.Kazi AA, Pruznak AM, Frost RA, Lang CH. Sepsis-induced alterations in protein-protein interactions within mTOR complex 1 and the modulating effect of leucine on muscle protein synthesis. Shock. 2011;35(2):117–25. doi: 10.1097/SHK.0b013e3181ecb57c. [DOI] [PMC free article] [PubMed] [Google Scholar]
- 25.Roux PP, Shahbazian D, Vu H, Holz MK, Cohen MS, Taunton J, Sonenberg N, Blenis J. RAS/ERK signaling promotes site-specific ribosomal protein S6 phosphorylation via RSK and stimulates cap-dependent translation. J Biol Chem. 2007;282(19):14056–64. doi: 10.1074/jbc.M700906200. [DOI] [PMC free article] [PubMed] [Google Scholar]
- 26.Vary TC, Deiter G, Lang CH. Diminished ERK 1/2 and p38 MAPK phosphorylation in skeletal muscle during sepsis. Shock. 2004;22(6):548–54. doi: 10.1097/01.shk.0000144131.13900.ff<. [DOI] [PubMed] [Google Scholar]
- 27.Miyazaki M, McCarthy JJ, Fedele MJ, Esser KA. Early activation of mTORC1 signalling in response to mechanical overload is independent of phosphoinositide 3-kinase/Akt signalling. J Physiol. 2011;589(Pt 7):1831–46. doi: 10.1113/jphysiol.2011.205658. [DOI] [PMC free article] [PubMed] [Google Scholar]
- 28.Dennis MD, Coleman CS, Berg A, Jefferson LS, Kimball SR. REDD1 enhances protein phosphatase 2A-mediated dephosphorylation of Akt to repress mTORC1 signaling. Sci Signal. 2014;7(335):ra68. doi: 10.1126/scisignal.2005103. [DOI] [PMC free article] [PubMed] [Google Scholar]
- 29.Brunet A, Bonni A, Zigmond MJ, Lin MZ, Juo P, Hu LS, Anderson MJ, Arden KC, Blenis J, Greenberg ME. Akt promotes cell survival by phosphorylating and inhibiting a Forkhead transcription factor. Cell. 1999;96(6):857–68. doi: 10.1016/s0092-8674(00)80595-4. [DOI] [PubMed] [Google Scholar]
- 30.Atherton PJ, Greenhaff PL, Phillips SM, Bodine SC, Adams CM, Lang CH. Am J Physiol Endocrinol Metab. 2016. Control of Skeletal Muscle Atrophy in Response to Disuse: Clinical/Preclinical Contentions and Fallacies of Evidence. ajpendo 00257 2016. [DOI] [PMC free article] [PubMed] [Google Scholar]
- 31.Smith IJ, Alamdari N, O'Neal P, Gonnella P, Aversa Z, Hasselgren PO. Sepsis increases the expression and activity of the transcription factor Forkhead Box O 1 (FOXO1) in skeletal muscle by a glucocorticoid-dependent mechanism. Int J Biochem Cell Biol. 2010;42(5):701–11. doi: 10.1016/j.biocel.2010.01.006. [DOI] [PMC free article] [PubMed] [Google Scholar]
- 32.Kim J, Guan KL. Regulation of the autophagy initiating kinase ULK1 by nutrients: roles of mTORC1 and AMPK. Cell Cycle. 2011;10(9):1337–8. doi: 10.4161/cc.10.9.15291. [DOI] [PubMed] [Google Scholar]
- 33.Petersen AM, Penkowa M, Iversen M, Frydelund-Larsen L, Andersen JL, Mortensen J, Lange P, Pedersen BK. Elevated levels of IL-18 in plasma and skeletal muscle in chronic obstructive pulmonary disease. Lung. 2007;185(3):161–71. doi: 10.1007/s00408-007-9000-7. [DOI] [PubMed] [Google Scholar]
- 34.Carson JA, Baltgalvis KA. Interleukin 6 as a key regulator of muscle mass during cachexia. Exerc Sport Sci Rev. 2010;38(4):168–76. doi: 10.1097/JES.0b013e3181f44f11. [DOI] [PMC free article] [PubMed] [Google Scholar]
- 35.Svanberg E, Frost RA, Lang CH, Isgaard J, Jefferson LS, Kimball SR, Vary TC. IGF-I/IGFBP-3 binary complex modulates sepsis-induced inhibition of protein synthesis in skeletal muscle. Am J Physiol Endocrinol Metab. 2000;279(5):E1145–58. doi: 10.1152/ajpendo.2000.279.5.E1145. [DOI] [PubMed] [Google Scholar]


