

Abstract
Objectives
The purposes of this study were to investigate differences in two inherent appearance characteristics between lots of an enamel dental composite resin of the same shade and brand, and to further compare these differences to those of similar shade designation of a different brand of dental composite resins.
Methods
Appearance analyses proceeded for three different lots of shades A1, B2, and D3 manufactured by one company and for one lot of shade EA1 manufactured by another. Samples were measured on black, white, and gray backings using spectroradiometry. Kubelka-Munk theory was used to determine reflectivity of each lot studied. CIELAB values and color differences between shades and lots were analyzed. Translucency indicators were compared between lots over thicknesses from 0.5 to 3.0 mm.
Results
Differences in inherent color between some lots of same shade designations within a brand were found to be above the acceptability threshold. Color difference between an enamel composite resin of shade A1 and a composite resin of shade EA1 was also above the acceptability threshold. Statistically significant differences in the translucency were found between some lots of one shade over the entire range of thicknesses studied.
Conclusion
Appearance analyses indicate substantial variation between lots of same shade designations as well as between brands of similar shade designations.
Introduction
The capability to effectively use dental materials in a manner that creates the best esthetic result is an essential process in the contemporary field of dentistry. As the field of dentistry has historically progressed from providing elimination of pain and discomfort and restoring function to providing esthetic outcomes, the demand for precise color matching has become imperative.i The role that color matching and esthetics play within the larger context of creating an ideal restoration is simple in concept yet complex in practice. An otherwise flawless restoration can quickly be deemed unacceptable if the color match is not adequate.i
An optimal color match is dependent on many subtle factors that include accuracy of shade selection methods whether visual or systematic, accurate representation of tooth colors by a shade guide, consistency of shade designations within and between brands of material, and precise communication of these findings.ii, iii If any of these components are neglected a suboptimal restoration can result. Issues with each of these components have been implicated from shade guides not accurately representing range of tooth color to wide variation in color reported from spectrophotometers, colorimeters, visual shade matching and wide variance between similar shade designations between brands of composite.ii, iii, iv
In order to create a natural looking restoration, practitioners often apply the technique of layering composite resin.v Even a basic restoration with no layering could be viewed as a single layer of composite on a backing such as the remaining tooth structure. The Kubelka-Munk Theory is a mathematical model that is generally accepted as a reliable description for the optical behavior of reflectance when layering a homogenous translucent material on an opaque background.vi, vii, viii The simplified reflectance equation is:ix
where , . S, the scattering coefficient, and K, the absorption coefficient, are two intrinsic properties of the translucent material that can be dependent on wavelengthviii or be functions of the tristimulus reflectance.vii The reflectance of the opaque backing material is represented by Rg and the thickness of the translucent material is denoted by X.ix The coth(bSX) is:
The reflection equation collapses to R∞ = a − b when the material is considered to be infinitely thickix as this is useful to describe its inherent color.
An early application of Kubelka-Munk theory to dentistry was to aid in the discovery that the absorption coefficient in dental enamel was affected mostly by the amino acids tryptophan and tyrosine.x Kubelka-Munk theory and its relationship to clinically relevant dental and maxillofacial materials used for restorative and esthetic purposes has become a topic of increasing relevance. The overall accuracy of Kubelka-Munk theory of reflectance for dental composites has been determined to improve for clinically relevant wavelengths by using internal reflection corrections.viii
Using layered materials and theoretical models,viii, xi different inherent color, or the color at optical infinite thickness, and translucency values of composite materials with the same shade designations were the basis for concluding that these optical property differences were influenced by compositional differences. Pigment compositions are obviously a major influence, and it was known through our personal experience that consistent pigment availability can be a significant concern. Visual observations while studying different lots of the same brand and shade gave rise to concerns about changes in optical characteristics of unknown or unavoidable causes.
Hence the objectives of this research are to examine optical characterizations in the format of Kubelka-Munk absorption and scatteringix and subsequent determinations of inherent color and translucencyxi for three different lots of shades A1, B2, and D3 manufactured by one company and for one lot of shade EA1 manufactured by a different company. The null hypotheses are that there is no difference in color or translucency parameter for different lots of the same shade and for different brands of the similar shades that were studied.
Materials and Methods
The materials studied are provided in Table 1. The shades used for the lot analysis were selected to follow an approximately equal distribution across the lightness scale using a Vita shade guide.xii Enamel shades were selected based off of the thickness of composite that was studied. Since the main thicknesses used were below 1 mm, enamel shades were selected as a cavity preparation of this thickness would still be in enamel. In order to make optimum use of available material, disc shaped specimens of Lot 1 for Shades A1, B2 and D3 were fabricated using circular PVC templates of 20 mm diameter and thicknesses of .25, .6 and 3.9 mm. For Shade EA1, the specimens were fabricated using circular PVC templates with thicknesses of .25 and .6 mm. For all Lots 2 and 3, only a single thickness was fabricated. Specimens were pressed using a universal testing machine (Model 5500R, Instron, Norwood, MA USA) with a compressive force of approximately 800 N in order to achieve uniformly thick specimens. After light curing with a Dentsply Caulk Spectrum™ dental curing light for approximately 30 seconds on each side using overlapping irradiation zones, they were sanded with 600 grit sandpaper and 1000 grit sandpaper to remove the matrix rich surface layer and to achieve the desired thickness with precision across specimens. Final thickness was then determined (Mitutoyo Model 103–137 outside micrometer, Mitutoyo America Corp. Aurora, IL, USA) for each specimen at its central point (1/2 inch diameter).
Table 1.
Materials studied.
| Material | Shade | Lot # (Code #) | Manufacturer |
|---|---|---|---|
| Herculite
Ultra (enamel shade) |
A1 | 4665522 (1) | Kerr Corporation, Orange, CA USA |
| 5094059 (2) | |||
| 5164551 (3) | |||
| B2 | 3689675 (1) | ||
| 5103942 (2) | |||
| 5157095 (3) | |||
| D3 | 3610966 (1) | ||
| 5110889 (2) | |||
| 5186505 (3) | |||
| Estelite Omega (enamel shade) |
EA1 | 001 (1) | Tokuyama Dental America, Encinitas, CA USA |
The spectral radiance of each disk was measured at its central point (1.1 mm diameter) in optical contact with white, gray and black backings, except that for Lot #1 of each of Shades A1, B2 and D3, the thickest specimen was only measured over the black and white backings. Radiance and subsequent reflectance values were obtained at each of the even integral wavelengths in the visible spectrum from 380 to 780nm. The reflectance of the backings was roughly 0.8, 0.4, and 0.0 uniformly over the visible spectrum. Measurements of radiant energy from each disk and backing combination were collected using the spectroradiometer (PR705; Photo Research Inc, Chatsworth, CA USA) and a Xenon arc lamp (300W; Oriel Instruments, Stratford, CT USA) as described previously.viii, xiii, xiv, xv To summarize, each specimen was placed in a 0-degree observation and a 45-degree illumination optical configuration for radiance measurement and the radiance measurements in the visible spectrum were converted to a reflectance spectrum using a certified reflectance standard (S3796A, Labsphere Inc., North Sutton, NH).
In order to allow for subsequent statistical analysis, two sets of thickness and backing combinations were established for those lots where two or more thicknesses were available (Lots #1), according to Table 2. For Lots 2 and 3, only one set was formed of the single thickness on all three backings. For each set, Kubelka-Munk (K-M) reflectance theoryxvi was then used to predict theoretical absorption and scattering coefficients by using a non-linear least squares regression analysis (SAS PROC NLIN, SAS® Proprietary Software 9.3, SAS Institute Inc., Cary, NC, USA) to determine the best fit to the reflectance and thickness data, as described previously.viii For each set, CIELAB color coordinatesxvii were then calculated using the CIE 2° Standard Colorimetric Observer and the CIE D65 source of illumination at infinite thicknessxi from the K-M optical absorption and scattering coefficients. The CIEDE2000 color difference formulaxvii, xviii, xix and established thresholds of perceptibility and acceptabilityxx were used to compare and evaluate color differences between lots and manufacturers.
Table 2.
Set numbers of measured thickness and backing combinations when more than one thickness was studied.
| Thickness\Backing: | White | Gray | Black |
|---|---|---|---|
| Thinnest (<.3mm) | 1 | 2 | 1 |
| Middle Thickness (~.6mm) | 2 | 1 | 2 |
| Thick (>3mm) | 2 | Not measured | 1 |
TP was originally defined as the color difference between a translucent material in optical contact with an opaque black backing and an opaque white backing using the CIELAB color difference formulaxvii and was first defined as a translucency measure for maxillofacial elastomer materials.xxi In order to evaluate possible differences in translucency, the updated Translucency Parameter was determined using the CIEDE2000 color difference formula at thickness values from 0.5 to 3.0 mm in steps of 0.5 mm for each set as follows:
where ΔL′, ΔC′, and ΔH′ represent the difference in lightness, chroma, and hue respectively for a sample on an opaque black backing (B, where Rg=0) and an opaque white backing (W, where Rg=1). RT represents a rotation function that compensates for the relationship between the hue and chroma differences that can present issues in the blue regionxvii. KL, KC, and KH are valued at 1 and represent correction factors for experimental conditionsxvii. SL, SC, and SH are correction terms for discrepancy between the location of the L′, a′, b′ coordinates for each sample within the analyzed pair.xvii
To summarize these determinations,xxi,xxii,xxiii the reflectance at each wavelength studied was first determined for each set when in optical contact with white and black backings. Ideal backings were taken into consideration in the calculations of TP. When these TP calculations are performed, they demonstrate the CIEDE2000 color difference of the sample on a perfectly ideal black backing and on a perfectly ideal white backing.
The inherent colors for each set were statistically analyzed by a repeated-measures 3-way ANOVA, where the between-subjects factors were Shade and Lot, and the within-subjects factor was the CIELAB color direction. The Translucency Parameter data were also analyzed by a repeated-measures 3-way ANOVA, where for this data the between-subjects factors were Shade and Lot, and the within-subjects factor was the thickness. For the analyses of these appearance parameters, all interactions between the factors were included and a maximum likelihood estimation methodxxiv and the Satterthwaite degrees of freedom methodxxv, xxvi (SAS PROC MIXED, SAS® Proprietary Software 9.3, SAS Institute Inc., Cary, NC, USA) were used in order to correct for any deviations from normal distributions or equality of variance. Where appropriate, statistically significant effects with more than one degree of freedom were resolved between logically reasonable subgroups by using the stepdown Bonferroni correction (SAS PROC MULTTEST, SAS® Proprietary Software 9.3, SAS Institute Inc., Cary, NC, USA) to the P-values obtained by a Student’s t-test.
Results
The agreements between the directly determined reflectance values and the reflectance associated with K-M reflectance theory is provided for selected sets and wavelengths in Figures 1 a–f, where the selections were from the 2,814 K-M regressions of the 14 sets at each of 201 wavelengths. For all K-M regressions, the error mean square of reflectance averaged 0.0003, with a maximum of 0.0021. This maximum error occurred at the wavelength of 780nm for the same set whose more visually important agreements are shown in Figures 1 a–c.
Figure 1.
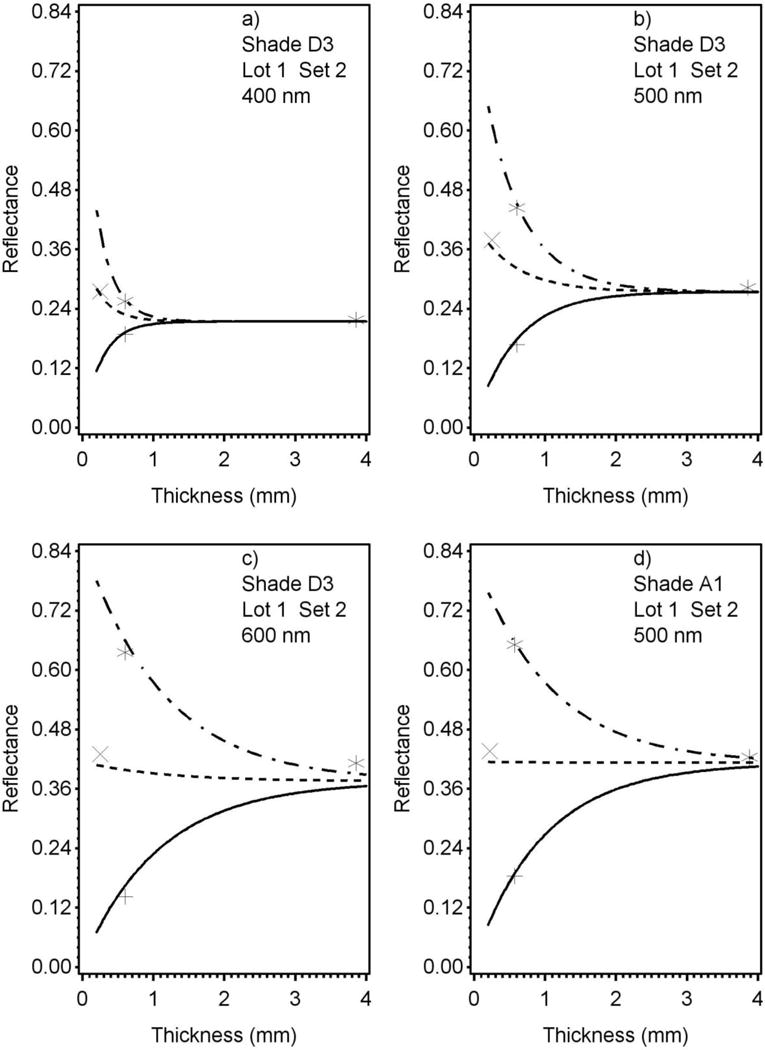

Agreements between the directly determined reflectance values and the reflectance associated with K-M reflectance theory for selected sets. The lines of the K-M reflectance theory for the White, Gray and Black backings are mixed dotted-dashed, dashed and solid, respectively, and the symbols for the directly determined values on the White, Gray and Black backings are the asterisk (*), the X and the plus sign (+), respectively.
The means and standard deviations of the inherent color parameters for the shades and lots studied are provided in Table 3, and the derived Updated TP values are provided in Figure 2.
Table 3.
Means and Standard Deviations in each of the CIE Color Directions for the Shades and Lots studied.
| Direction | Shade | Lot | N | Mean | Standard Deviation |
|---|---|---|---|---|---|
| a* | A1 | 1 | 2 | 2.4 | 1.8 |
| A1 | 2 | 1 | 1.6 | ||
| A1 | 3 | 1 | 1.9 | ||
| B2 | 1 | 2 | −0.7 | 0.5 | |
| B2 | 2 | 1 | −1.8 | ||
| B2 | 3 | 1 | −0.7 | ||
| D3 | 1 | 2 | 1.2 | 0.4 | |
| D3 | 2 | 1 | 1.0 | ||
| D3 | 3 | 1 | 1.5 | ||
| EA1 | 1 | 2 | 1.6 | 0.6 | |
| b* | A1 | 1 | 2 | 17.2 | 2.6 |
| A1 | 2 | 1 | 12.6 | ||
| A1 | 3 | 1 | 16.3 | ||
| B2 | 1 | 2 | 17.6 | 2.3 | |
| B2 | 2 | 1 | 13.4 | ||
| B2 | 3 | 1 | 13.0 | ||
| D3 | 1 | 2 | 13.8 | 0.8 | |
| D3 | 2 | 1 | 8.2 | ||
| D3 | 3 | 1 | 9.8 | ||
| EA1 | 1 | 2 | 17.8 | 0.5 | |
| L* | A1 | 1 | 2 | 76.9 | 1.5 |
| A1 | 2 | 1 | 75.5 | ||
| A1 | 3 | 1 | 76.7 | ||
| B2 | 1 | 2 | 75.8 | 1.5 | |
| B2 | 2 | 1 | 72.5 | ||
| B2 | 3 | 1 | 73.0 | ||
| D3 | 1 | 2 | 64.9 | 0.2 | |
| D3 | 2 | 1 | 66.1 | ||
| D3 | 3 | 1 | 67.0 | ||
| EA1 | 1 | 2 | 69.7 | 0.4 |
Figure 2.

Mean TP values using the CIEDE2000 color difference formula for each Shade and Lot studied.
The analysis of the inherent colors indicated a highly statistically significant three-way interaction (P < 0.001), so pairwise comparisons were then computed for differences between all of the Lots within each Shade and Direction of the CIELAB color parameter. The estimates of differences between those pairs found to be statistically significantly different are presented in Table 4. Each of the estimates in this table is greater than the acceptable total color difference (50/50 Acceptable threshold ΔEab = 2.7)xx for the CIELAB color difference.
Table 4.
Estimates using least square means of statistically significant differences between Lots within each Shade and Direction of the CIELAB color parameter.
| Group 1 | Group 2 | Estimate* | P-value | ||||
|---|---|---|---|---|---|---|---|
| Shade | Lot | Direction | Shade | Lot | Direction | ||
| B2 | 1 | L* | B2 | 2 | L* | 3.3 | 0.026 |
| A1 | 1 | b* | A1 | 2 | b* | 4.6 | 0.001 |
| A1 | 2 | b* | A1 | 3 | b* | −3.7 | 0.033 |
| B2 | 1 | b* | B2 | 2 | b* | 4.2 | 0.003 |
| B2 | 1 | b* | B2 | 3 | b* | 4.5 | 0.001 |
| D3 | 1 | b* | D3 | 2 | b* | 5.6 | <.001 |
| D3 | 1 | b* | D3 | 3 | b* | 4.0 | 0.005 |
Estimate is the mean of Group 1 minus the mean of Group 2.
Color differences between the materials studied with identical or similar shade, with perceptibility and acceptability thresholds,xx are shown in Figure 3.
Figure 3.

Color differences (CIEDE2000) between materials studied (Shade/Lot) with identical or similar Shade.
The analysis of the Translucency Parameter data indicated a statistically significant (P < 0.001) three-way interaction, so pairwise comparisons were then computed for differences between all of the Lots within each Shade and Thickness. At every thickness studied for Shade D3, the mean Translucency Parameter of Lot 1 was statistically significantly different (P ≤ 0.023) from the mean of each of Lots 2 and 3, and the magnitudes of these differences were ≥3.0.
Discussion
Although two reflectance determinations of the same thickness on black and white backings may be used to determine the two K-M optical coefficients and therefore subsequent colors and translucency indicators,xxvii providing sets of more than one combination of thickness and backing allow for evaluation of the error of the theory and for statistical comparisons which require more than one set in a sample. The variations in optical properties of a single lot of restorative esthetic resin may be deduced from Figures 1 a–c, where the wavelengths vary from 400nm to 500nm to 600nm. At the less translucent wavelength of 400nm, where the optical absorption is greater than at the other wavelengths, the thickness at which the backing has little or no effect on the reflectance is noticeably lower than this optical infinite thickness for the other wavelengths. Variations in the K-M theory lines in Figures 1b and 1d–f demonstrate differences at the wavelength of 500nm in reflectivity at optical infinite thickness and contrast ratio at any thickness between the shades studied. Spectral optical scattering and absorption, in combination with specimen thickness and backing, provide the foundations for reflectance which then provide descriptions of color and translucency for a specified illuminant and observer.
The subsequent appearance analyses presented here indicated a large variation in color and translucency of the lots studied, exhibited in part by the L*a*b* values for each of these shades. For instance, the L* value for Shade A1 Lot 2 is closer to the L* value for B2 Lot 1 than it is to the other lots of A1. The b* value for A1 Lot 2 is closer to the b* value for B2 Lot 3 than it is to the other lots of shade A1 as well. Overall CIEDE2000 color differences (Figure 3) indicated color differences generally above perceptibility and acceptability thresholds. There was at least one color difference above the perceptible threshold for the different lots studied for each shade and above the acceptability threshold for the color difference between lots for the same shade. The color difference between the two brands of similar shade was also above the acceptability threshold, indicating a large variation between these two brands for shades identified with shade A1. This further verifies the results found in a previous study for same shade designations between brands.iii
Further, significant differences in translucency between lots of the same shade were also found. Differences between brands and differences within lot numbers of the same shade and brand of dental materials would contribute to error in shade matching methods. Custom shade guides have been implicated to aid in the resolution of some of these issues, but a custom guide is not always a practical option.xxviii This wide variation between lot numbers of the same shades is likely a main contributor to the discrepancy in color matching a tooth to a restoration that could be seen clinically.
It is important to note that only one brand of material was studied for appearance differences in lot numbers and that these differences may or may not represent a universal problem. The source of this variation remains to be identified and the point at which this variation is introduced is not known either. There are numerous potential sources of this variation such as temperature differences in shipping and storage processes that need to be investigated. Consistency in the color and availability of pigments used in the manufacturing process may be another contributing source of error.
Color at infinite thickness was analyzed in this study in order to accurately evaluate the inherent color of the materials. However, dental composite resins are used in increments of comparatively minimal thickness. This would render the clinical color differences less dramatic for these translucent materials. Nevertheless, a difference in translucency between composite resins of the same shade designation would result in a difference in the hiding power of a layer of resin in the range of thicknesses as used clinically.
Conclusion
Considerable variations in samples from different lot numbers of the same shades and between brands of same shade designations was indicated in the optical analyses performed. These variations can introduce error at multiple points in the shade selection process and can present error for color matching in restorative and esthetic dentistry.
Clinical Significance.
Optical principles applied to important clinical appearance attributes are described which characterize inherent appearance attributes and provide aid in the appearance matching process for dental composite resins used in restorative and operative dental procedures.
Acknowledgments
This research was supported by the National Institutes of Health (NIH), National Institute for Dental and Craniofacial Research (NIDCR) T32 training grant, entitled Comprehensive Training in Oral and Craniofacial Sciences, by The Ohio State University College of Dentistry and by the Kerr Corporation who supplied some of the Herculite Ultra composite resin material.
Footnotes
Portions of this research were presented at the 45th Annual Meeting and Exhibition of the AADR, Los Angeles CA; at the 44th Annual Meeting of the AADR and the 93rd General Session and Exhibition of the IADR, Boston, MA; and at the 43rd Annual Meeting and Exhibition of the AADR and the 38th Annual Meeting of the CADR, Charlotte North Carolina. This research is part of the dissertation research of Dr. Melody Carney, presented in partial fulfillment of the requirements for the degree Doctorate of Philosophy in the Graduate School of The Ohio State University.
Disclosure
The authors do not have any financial interest in the companies whose materials are included in this article.
Contributor Information
Melody N. Carney, Assistant Professor – Practice, Division of General Practice and Materials Science, The Ohio State University College of Dentistry
William M. Johnston, Professor Emeritus, Division of General Practice and Materials Science, The Ohio State University College of Dentistry, 305 W. 12th Ave., Columbus, OH 43210-1267
References
- i.Sproull RC. Color matching in dentistry. Part III. Color control. Journal of Prosthetic Dentistry. 1974;31(2):146–54. doi: 10.1016/0022-3913(74)90049-3. [DOI] [PubMed] [Google Scholar]
- ii.Schwabacher WB, Goodkind RJ. Three-dimensional color coordinates of natural teeth compared with three shade guides. Journal of Prosthetic Dentistry. 1990;64(4):425–31. doi: 10.1016/0022-3913(90)90038-e. [DOI] [PubMed] [Google Scholar]
- iii.Kim BJ, Lee YK. Influence of the shade designation on the color difference between the same shade-designated resin composites by the brand. Dental Materials. 2009;25(9):1148–54. doi: 10.1016/j.dental.2009.04.001. [DOI] [PubMed] [Google Scholar]
- iv.Chu SJ, Trushkowsky RD, Paravina RD. Dental color matching instruments and systems. Review of clinical and research aspects. Journal of Dentistry. 2010;38(Suppl 2):e2–16. doi: 10.1016/j.jdent.2010.07.001. [DOI] [PubMed] [Google Scholar]
- v.da Costa J, Fox P, Ferracane J. Comparison of various resin composite shades and layering technique with a shade guide. Journal of Esthetic and Restorative Dentistry. 2010;22(2):114–24. doi: 10.1111/j.1708-8240.2010.00322.x. [DOI] [PubMed] [Google Scholar]
- vi.O’Brien WJ, Johnston WM, Fanian F. Double-layer Color Effects in Porcelain Systems. Journal of Dental Research. 1985;64(6):940–43. doi: 10.1177/00220345850640061801. [DOI] [PubMed] [Google Scholar]
- vii.Davis BK, Johnston WM, Saba RF. Kubelka-Munk reflectance theory applied to porcelain veneer systems using a colorimeter. International Journal of Prosthodontics. 1994;7(3):227–33. [PubMed] [Google Scholar]
- viii.Mikhail SS, Azer SS, Johnston WM. Accuracy of Kubelka-Munk reflectance theory for dental resin composite material. Dental Materials. 2012 Jul;28(7):729–35. doi: 10.1016/j.dental.2012.03.006. [DOI] [PubMed] [Google Scholar]
- ix.Kubelka P. New Contributions to the Optics of Intensely Light-Scattering Materials. Part I. Journal of the Optical Society of America. 1948;38(5):448–48. doi: 10.1364/josa.38.000448. [DOI] [PubMed] [Google Scholar]
- x.Spitzer D, Bosch JT. The absorption and scattering of light in bovine and human dental enamel. Calcified Tissue Research. 1975;17(2):129–37. doi: 10.1007/BF02547285. [DOI] [PubMed] [Google Scholar]
- xi.Mikhail SS, Schricker SR, Azer SS, Brantley WA, Johnston WM. Optical characteristics of contemporary dental composite resin materials. Journal of Dentistry. 2013 Sep;41(9):771–8. doi: 10.1016/j.jdent.2013.07.001. [DOI] [PubMed] [Google Scholar]
- xii.O’Brien WJ, Groh CL, Boenke KM. A new, small-color-difference equation for dental shades. Journal of Dental Research. 1990;69(11):1762–4. doi: 10.1177/00220345900690111001. [DOI] [PubMed] [Google Scholar]
- xiii.Johnston WM. Color measurement in dentistry. Journal of Dentistry. 2009;37(Suppl. 1):e2–6. doi: 10.1016/j.jdent.2009.03.011. [DOI] [PubMed] [Google Scholar]
- xiv.Hu X, Johnston WM, Seghi RR. Measuring the color of maxillofacial prosthetic material. Journal of Dental Research. 2010;89(12):1522–7. doi: 10.1177/0022034510378012. [DOI] [PubMed] [Google Scholar]
- xv.Kürklü D1, Azer SS, Yilmaz B, Johnston WM. Porcelain thickness and cement shade effects on the colour and translucency of porcelain veneering materials. Journal of Dentistry. 2013;41(11):1043–50. doi: 10.1016/j.jdent.2013.08.017. [DOI] [PubMed] [Google Scholar]
- xvi.Kubelka P. New contributions to the optics of intensely light-scattering materials. Part I. Journal of the Optical Society of America. 1948;38(5):448–57. doi: 10.1364/josa.38.000448. [DOI] [PubMed] [Google Scholar]
- xvii.Commission Internationale de l’Eclairage (CIE or International Commission on Illumination) CIE technical report: Colorimetry. Vienna, Austria: 2004. (CIE publication no. 15.3). [Google Scholar]
- xviii.Luo MR, Cui G, Rigg B. The development of the CIE 2000 colour-difference formula: CIEDE2000. Color Research & Application. 2001;26(5):340–50. [Google Scholar]
- xix.Sharma G, Wu W, Dalal EN. The CIEDE2000 color-difference formula: Implementation notes, supplementary test data, and mathematical observations. Color Research & Application. 2005;30(1):21–30. [Google Scholar]
- xx.Paravina RD, Ghinea R, Herrera LJ, Bona AD, Igiel C, Linninger M, Sakai M, Takahashi H, Tashkandi E, Perez Mdel M. Color difference thresholds in dentistry. Journal of Esthetic and Restorative Dentistry. 2015;27(Suppl. 1):S1–9. doi: 10.1111/jerd.12149. [DOI] [PubMed] [Google Scholar]
- xxi.Johnston WM, Ma T, Kienle BH. Translucency parameter of colorants for maxillofacial prostheses. Intentional Jouranl of Prosthodontics. 1995;8(1):79–86. [PubMed] [Google Scholar]
- xxii.Johnston WM, Reisbick MH. Color and translucency changes during and after curing of esthetic restorative materials. Dental Materials. 1997;13(2):89–97. doi: 10.1016/s0109-5641(97)80017-6. [DOI] [PubMed] [Google Scholar]
- xxiii.Johnston WM. Review of translucency determinations and applications to dental materials. Journal of Esthetic and Restorative Dentistry. 2014;26(4):217–23. doi: 10.1111/jerd.12112. [DOI] [PubMed] [Google Scholar]
- xxiv.Hartley HO, Rao JNK. Maximum-likelihood estimation for the mixed analysis of variance model. Biometrika. 1967;54:93–108. [PubMed] [Google Scholar]
- xxv.Satterthwaite FE. An approximate distribution of estimates of variance components. Biometrics Bulletin. 1946;2:110–4. [PubMed] [Google Scholar]
- xxvi.Welch BL. The generalisation of student’s problems when several different population variances are involved. Biometrika. 1947;34:28–35. doi: 10.1093/biomet/34.1-2.28. [DOI] [PubMed] [Google Scholar]
- xxvii.Woolsey GD, Johnston WM, O’Brien WJ. Masking power of dental opaque porcelains. Journal of Dental Research. 1984;63(6):936–9. doi: 10.1177/00220345840630062601. Erratum: Journal of Dental Research 63:1115. [DOI] [PubMed] [Google Scholar]
- xxviii.Wieder S. A Custom Shade Guide System for Composite Resins. Journal of Esthetic and Restorative Dentistry. 1990;2(1):10–2. doi: 10.1111/j.1708-8240.1990.tb00596.x. [DOI] [PubMed] [Google Scholar]