Abstract
Fatty acid (FA) profiling provides phenotypic information and is increasingly used in a broad range of biological and biomedical studies. Quantitation of unsaturated FAs with confident carbon-carbon double bond (C=C) location assignment is both sample and time consuming using traditional gas chromatography mass spectrometry analysis. In this study we developed a rapid, sensitive, and quantitative method for profiling unsaturated FAs without using chromatographic separations. This method was based on a combination of in-solution photochemical tagging of a C=C in FAs and a subsequent gas-phase de-tagging via tandem (neutral loss scan) mass spectrometry. It enabled quantitation of unsaturated FAs from various biological samples (blood, plasma, and cell lines). More importantly, quantitative information of FA C=C location isomers, which was traditionally overlooked, could now be obtained and applied to studying FA changes between normal and cancerous human prostate cells.
Graphical Abstract
Fatty acids (FAs) are essential for all living organisms. They are building blocks of complex lipids such as phospholipids, glycolipids, and cholesterol esters; they also serve critical roles in energy storage and cell signaling.1,2 Many studies have shown that FA composition changes are correlated with the development and progression of a number of chronical diseases.3 Profiling of FAs, including their structural identification and quantitation, therefore has been increasingly used to provide phenotypic signals in molecular biology and bio-marker discovery. In terms of FA analysis, gas chromatography-mass spectrometry (GC-MS) is the mainstream method; however, shotgun lipid analysis has been increasingly used because of the ease of operation, fast speed, and the capability of obtaining lipid profiles for multiple classes.4–6 In a typical shotgun approach, FAs in crude lipid extracts are ionized by electrospray ionization (ESI) and analyzed by MS without separation. Molecular information, such as the FA chain length and the degree of unsaturation, can be readily deduced from accurate mass measurements. Unfortunately, tandem mass spectrometry (MS/MS), proved as a powerful technique for both qualitative and quantitative analysis, is not directly applicable to analysis of intact FAs. This is because few structure-informative fragment ions can be produced from FA anions through collision-induced dissociation (CID) at low energy conditions.7 This situation also makes it impossible to pinpoint the locations of C=C bonds in unsaturated FAs. Charge-switch derivatization of carboxylic acid functional group of FAs has been utilized to overcome the above difficulties. By adding a fixed positive charge to FAs, the ionization efficiency of derivatized FAs is largely improved in positive ESI mode.8 Moreover, CID of the derivatized FA ions could provide abundant signature fragment ions, which enable the detection and quantitation of unsaturated FAs. By choosing proper derivatization groups, structural informative fragment ions can be generated from MS/MS, providing clues of C=C locations.9,10
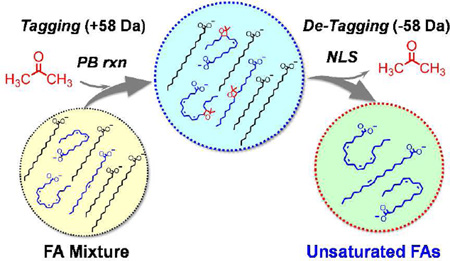
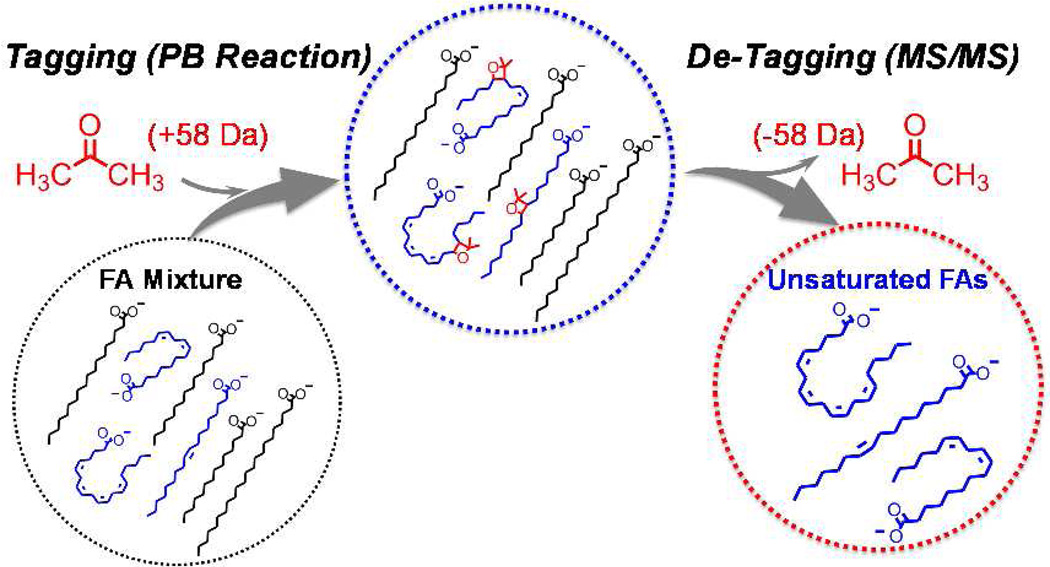
We recently demonstrated that a C=C specific derivatization method via Paterno–Buchi (PB) reaction using acetone as the reagent. This reaction when coupled with online MS/MS allowed confident assignment of C=C locations for various classes of lipids including FAs.11,12 In this approach fragment ions specific to the locations of C=C bonds (termed as C=C diagnostic ions) are generated from CID of acetone tagged unsaturated lipids, which provide information for both identification and quantitation of the C=C location isomers.13 Besides C=C diagnostic ions, loss of tag (acetone molecule, 58 Da) is observed as a dominant fragmentation channel upon CID of tagged FAs. Its high abundance limits the sensitivity of FA analysis based on the detection of C=C diagnostic ions. However, in the newly developed approach reported herein, acetone loss fragment channel was utilized to derive an effective means of analyzing unsaturated FAs from complex biological samples by taking advantage of the linked relationship of tag-addition and tag-loss only for unsaturated FAs.
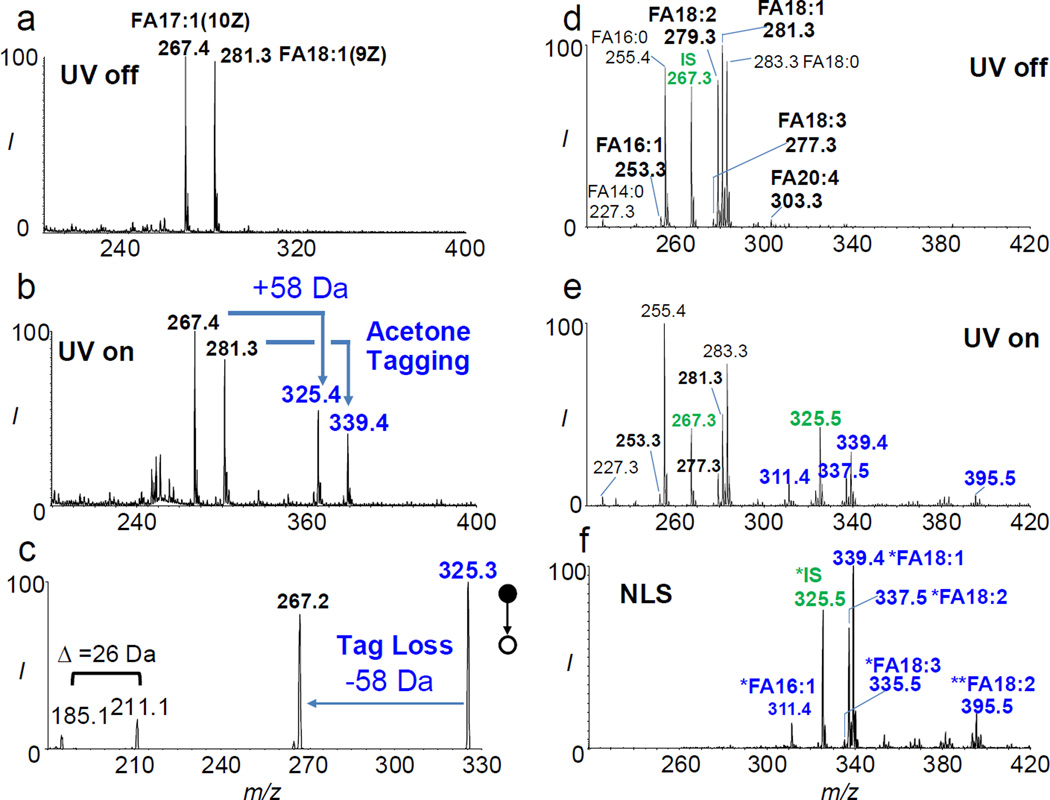
In order to test this idea, an equimolar mixture of FA 18:1(9Z) (oleic acid) and FA 17:1(10Z) (cis-10-heptadecenoic acid) was subjected to acetone photochemical tagging via PB reaction. Figure 1a and b show negative ion mode nanoESI spectra of such a mixture (each at 3.5 µM in acetone/H2O (50/50, v/v) with 0.1% NH4OH added) before and after photochemical tagging, respectively. Formation of acetone-tagged FAs at m/z 325 and 339 were clearly detected, each with a 58 Da mass increase from the corresponding intact FAs (FA 17:1 at m/z 267 and FA 18:1 at m/z 281). MS2 CID of tagged FAs (also referred to as PB-MS/MS), i.e. tagged FA 17:1 (m/z 325), led to dominant tag loss (−58 Da) and a pair of C=C diagnostic ions with a signature 26 Da mass separation (Figure 1c).11 This set of experiments demonstrates that the processes of acetone tagging in solution and acetone de-tagging in gas phase are efficient.
Figure 1.
Negative ion mode nanoESI mass spectra of an equal molar mixture of FA 17:1(10Z) and FA 18:1(9Z) (3.5 µM each in acetone/H2O =50/50, v/v with 0.1% NH4OH added): (a) before and (b) after photochemical tagging by acetone. (c) MS2 beam-type CID (35 eV) of tagged FA 17:1 (m/z 325). Negative ion mode nanoESI-MS of FA extract from human plasma: (d) before and (e) after acetone tagging. FA 17:1(10Z) was used as the internal standard (IS, 7.5 µM). (f) 58 Da neutral loss scan (NLS) after acetone tagging. The number of “*” sign in FA annotation stands for the number of acetone molecules tagged onto a FA.
This method was then applied to the analysis of free FA extract from human plasma (FA extraction protocols listed in Supporting Information (SI)). FA 17:1(10Z) was added to the extract as an internal standard (IS, 7.5 µM) given its negligible abundance in human plasma. NanoESI-MS revealed that the extract contained a variety of saturated and unsaturated FAs (Figure 1d). Major species included FAs 14:0 (m/z 227.3), 16:1(m/z 253.3), 16:0 (m/z 225.4), 18:2 (m/z 279.3), 18:1 (m/z 281.3), 18:0 (m/z 283.3), and 20:4 (m/z 303.3). After photochemical tagging (Figure 1e), the relative intensities of unsaturated FAs decreased significantly with a concomitant appearance of tagged FAs (indicated with “*”, e.g. m/z 311.4 for FA 16:1, m/z 337.5 and 395.5 for FA 18:2, m/z 339.3 for FA 18:1, m/z 325.2 for IS). It is worth noting that since acetone is in large molar excess to FAs by five to six orders of magnitude, no competition for tagging among unsaturated FAs was observed. Since tagging reaction (PB reaction) is not 100% in yield, this leads to a more complicated spectrum. However, by taking advantage of 58 Da neutral loss scan (NLS), the reaction spectrum was greatly simplified because only unsaturated FAs were detected from mixtures (Figure 1f).
With MS/MS incorporated in the analysis workflow, detection of unsaturated FAs are more sensitive and specific as compared to single-stage MS (MS1) analysis. As an important demonstration, we compared the analysis results of FA extract from 2 µL rat whole blood using single-stage MS vs. acetone tagging coupled with NLS. In the MS1 spectrum, peak intensities of FA 16:1 (m/z 253), 18:2 (m/z 279), 18:1 (m/z 281), and 20:4 (m/z 303) were at the noise level (SI, Figure S1a). By applying 58 Da NLS, tagged FA 16:1, 18:2, and 18:1 could then be clearly identified (SI, Figure S1b). The confidence for assigning identities to these FAs is high because the tagging and de-tagging processes are specific to unsaturated FAs.
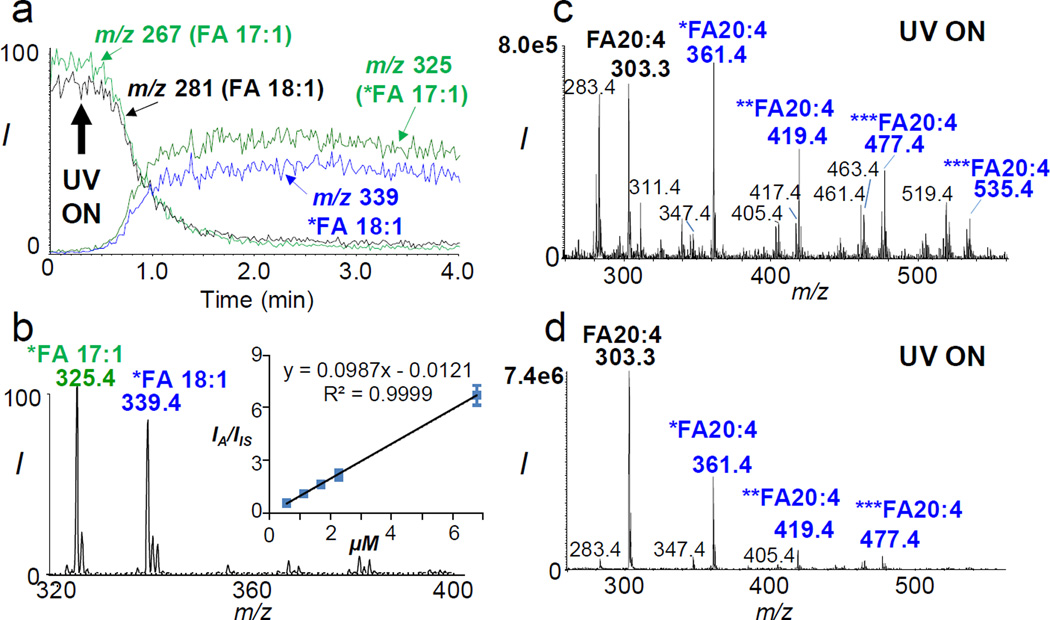
With the achievement of selective detection for unsaturated FAs, we further evaluated its application for quantitative analysis. Limited by the quantum yield of acetone in PB reaction, tagging can only be achieved with 30–60% yield for mono-unsaturated fatty acids (MUFAs).11–13 Under this situation, maintaining a relatively steady tagging efficiency is important for quantitative analysis. Figure 2a shows the extracted ion chromatograms of intact and tagged FAs for an equal molar mixture of FA 18:1(9Z) and 17:1(10Z). It is clear that both FAs reacted at a similar kinetics: tagging reached a plateau within 30 s of UV irradiation and the tagged FA signals were stable during the period of analysis (10–20 minutes). Interestingly, FA 17:1(10Z) had a slightly higher reaction yield (~58%) than FA 18:1(9Z) (~50%). Based on 58 Da NLS (Figure 2b), a calibration curve for FA 18:1(9Z) using FA 17:1(10Z) as the IS (7.5 µM) was obtained. It showed both excellent linearity (R2 = 0.9999) and sensitive detection (limit of detection, LOD = 15 nM), which is comparable to conventional GC-MS analysis.14 Calibration curves with good linearity and detection limit were consistently obtained for MUFAs from 16 to 24 carbons.
Figure 2.
(a) Extracted ion chromatogram of intact and acetone-tagged FA 17:1 and FA 18:1 during photochemical reaction. (b) NLS (58 Da) of tagged FA 17:1 and FA 18:1. Inset shows the calibration curve for FA 18:1(9Z) based on NLS (IS: FA 17:1). Photochemical reaction MS spectrum of FA 20:4 (5Z, 8Z, 11Z, 14Z) using different reaction solvent conditions: (a) acetone/water (50/50, v/v) and (b) ethanol/acetone/water (40/30/30, v/v/v).
Acetone/water (50/50, v/v) is a good reaction solvent system for tagging MUFAs due to its fast reaction kinetics. This condition, however, leads to a sequential tagging of multiple C=Cs in poly-unsaturated FAs (PUFAs). For instance, four acetone-tagged products (at m/z 361, 419, 477, 535) could be formed from arachidonic acid (FA 20:4(5Z, 8Z, 11Z, 14Z)) as shown in Figure 2c. This excessive degree of reaction is undesirable since it reduces the amount of singly-tagged products, which is most useful for structural identification. Moreover, side reactions, e.g. Norrish Type I reactions15 (forming ions at m/z 347.4, 405.4, 463.4, 519.4), were found to be more competitive, which interfered the detection and quantitation of unsaturated FAs. Ethanol has been shown to slow down PB reactions through photo-reduction of electronically excited acetone.16 We found that an addition of ethanol into the reaction solvent system, i.e., ethanol/acetone/water (40/30/30, v/v/v), maximized the single-acetone tagged products for PUFAs. As shown in Figure 2d, the single-acetone tagged product of FA 20:4 (at m/z 361) accounted for ~80% of all tagged products and its absolute intensity increased about 5 times as compared to Figure 2c where acetone/water (50/50) was used. MS2 CID of this product (m/z 361) showed a dominant tag loss and a small sequential 44 Da loss commonly observed for PUFAs (SI, Figure S2). Quantitation of FA 20:4 was achieved via 58 Da NLS by monitoring its single-acetone tagged product vs. that of IS (FA 17:1(10Z)). Even though a small degree of sequential tagging existed, the use of IS led to a calibration curve with good linearity and an LOD of 80 nM from a solvent condition of ethanol/acetone/water (40/30/30, v/v/v).
In a mammalian lipidome many unsaturated FAs exist as a mixture of C=C location isomers,13,14 which calls for an analytical method capable of quantitation for each C=C location isomer. Through photochemical tagging and 58 Da NLS, the total amount of C=C location isomers can be quantified in a more sensitive fashion. The molar ratio of C=C location isomers can be obtained using our previously established method, by measuring C=C diagnostic ion intensity ratios from PB-MS/MS data.13 Quantitation for each isomer can then be achieved by combining the total quantity with the molar ratio information of C=C location isomers. This approach was found to be successful for experiments performed on a series of standard mixtures of FA 18:1(9Z) and (11Z) isomers. It is worth noting that C=C location isomers may have different degrees of tag loss under the same CID conditions.13 Therefore, calibration curves for pure isomers do not overlay with each other (SI, Figure S3). This phenomenon suggests that in order to achieve good accuracy for the quantitation of a mixture of FA C=C location isomers, calibration solutions should be prepared using the same isomeric composition as detected from the real sample.
Unsaturated FA analysis in human plasma
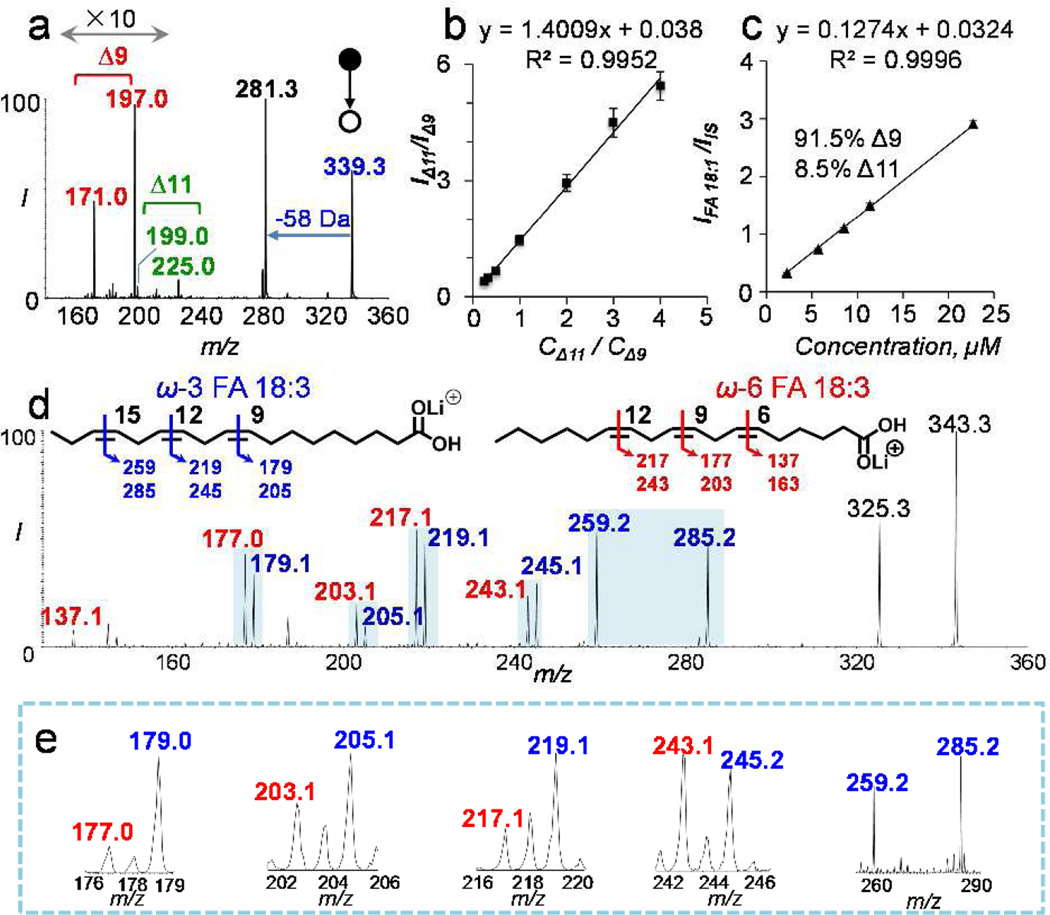
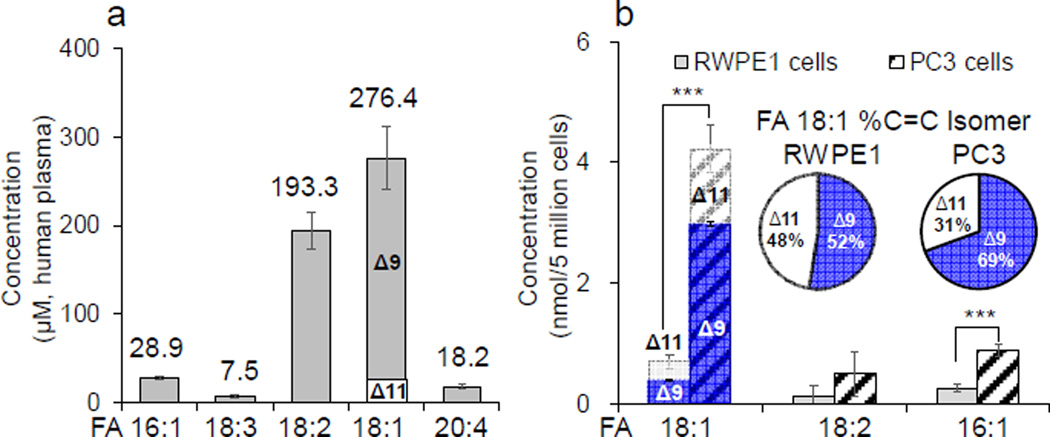
The method of photochemical tagging followed by 58 Da NLS was applied for FA analysis in human plasma. Detailed information on FA extraction protocols and extraction efficiencies are listed in SI sections 3.1 and 5.1). FA 17:1(10Z) (7.5 µM) was added to the extract as an IS. FA profile from nanoESI-MS is shown in Figure 1d, while the unsaturated FA profile can be found from 58 Da NLS (Figure 1f). Prior to quantitative study, PB-MS/MS was applied to single-acetone tagged FAs for structural determination including C=C locations and the existence of any C=C location isomers. We found that FA 16:1(9), 18:2 (9, 12), and 20:4 (5, 8, 11, 14) existed as pure forms, with the numbers in parentheses indicating the C=C locations. Quantitation of these FAs was then obtained from 58 Da NLS (solution conditions and calibration curves shown in SI, Table S1) and determined as follows: 28.9 ± 1.6 µM of FA 16:1, 193 ± 20 µM of FA 18:2, and 18.2 ± 2.3 µM of FA 20:4. PB-MS/MS revealed that FA 18:1 and FA 18:3 consisted of C=C location isomers. As shown in Figure 3a, MS/MS CID of tagged FA 18:1 (at m/z 339) produced two pairs of diagnostics ions at m/z 171, 197 and m/z 199, 225. Detection of these diagnostic ions clearly suggested the existence of C=C location isomers at Δ9 and Δ11, respectively. Based on C=C diagnostic ion intensity ratio (Δ11/Δ9 = 0.0662) and the established molar ratio calibration curve of the two isomers (Figure 3b), FA 18:1 was found to consist of 91.5% Δ9 and 8.5% Δ11 isomers. A set of calibration solutions consisting of the same composition of C=C location isomers in human plasma but varying in total concentrations was prepared and used for producing the 58 Da NLS calibration curve as shown in Figure 3c. The total concentration of FA 18:1 in human plasma was found to be 276 ± 36 µM, corresponding to 253 ± 33 µM Δ9 isomer and 23 ± 3 µM Δ11 isomer. PB-MS/MS showed that FA 18:3 was a mixture of ω-3 (C=C at T9, 12, 15) and ω-6 (C=C at T6, 9, 12) isomers (SI, Figures S4 and S5). Limited by relatively low abundance (7.5 ±1.5 µM) in human plasma, accurate determination of the molar ratio between these two isomers was difficult. Nevertheless, by comparing the C=C diagnostic ions observed from a 1:1 (molar ratio) mixture of FA 18:3 ω-3 and ω-6 standards (Figure 3d) to those from human plasma (Figure 3e), ω-3 isomer was found to be the more abundant than ω-6 isomer. This finding is consistent with previous reports by Gross et al. and Han et al.9,10 Quantitative data of six major species of unsaturated FAs in human plasma are summarized in Figure 4a. Charge-switch method reported by Han9 and Gross10 was also applied to the same set of human plasma sample for cross-validation. The two methods provided consistent quantitation measurements within 10% relative error (Figure S6). Photochemical tagging coupled with MS/MS, however, was more sensitive in detecting minor components of C=C locations isomers. For instance, FA 18:1(11) location isomers was not reported by charge-switch methods, likely due to relative low concentration (<10%) of the T11 isomer in FA 18:1.
Figure 3.
Analysis of FA C=C location isomers from human plasma. (a) PB-MS/MS of tagged FA 18:1 (m/z 339.3). Two isomers with C=C at T9 and T11 positions are detected. (b) Calibration curve for relative quantitation of FA 18:1 T9 and T11 isomers. (c) Calibration curve for total FA 18:1 quantitation based on 58 Da NLS of FA 18:1 mixtures consisting of 91.5% T9 and 8.5% T11 isomers. (d) PB-MS/MS of an equal molar mixture of ω-3 and ω-6 FA 18:3 isomers (m/z 343.3 lithiated ions). (e) PB-MS/MS of zoomed-in regions for C=C diagnostic ions of FA 18:3 from human plasma. ω-3 FA 18:3 is more abundant than ω-6 isomer.
Figure 4.
(a) Quantitation of unsaturated FAs in human plasma. (b) Comparison of the amounts of major unsaturated FAs in RWPE1 and PC3 cells. Inset shows %composition of Δ9 and Δ11 isomers of FA 18:1 in RWPE1 and PC3 cells. Error bars represent standard deviation, n = 3. Differences between the FAs in RWPE1 cells and PC3 cells were evaluated for statistical significance using the two-tailed Student’s t-tests (***p<0.0005).
Quantitation of unsaturated FAs in normal and cancerous human prostate cells
Monitoring quantitative changes of metabolites, such as fatty acids, has been increasingly used to aid studies in cancer biology. It has been shown that FA profiles change significantly from normal to cancer cells due to altered cell metabolism.17 However, the identities of unsaturated FAs are typically not determined at structural level of C=C locations; therefore, the changes of individual C=C location isomers are not known. By using our method of photochemical tagging followed by 58 Da NLS and PB-MS/MS, quantitation with high molecular specificity for unsaturated FAs could be achieved. Normal (RWPE1) and cancerous human prostate cells (PC3 cells) were used as model systems for a comparative study. The major FA species were found to include FA 16:0, 16:1, 18:0, 18:1 and 18:2 (FA profiles of the two cell lines summarized in SI, Figure S7). FA 16:1 and FA 18:2 were determined to be pure using our method, with C=C located at Δ9 and Δ9,12, repectively, for both cell lines, while FA 18:1 consisted of Δ9 and Δ11 isomers (SI, Figure S8). Significantly elevated quantity of unsaturated FAs (16:1, 18:1, and 18:2) were detected in prostate cancer cells (PC3), consistent with literature reports.18 Specifically, as the most abundant unsaturated FA species in both cell lines, the total amount of FA 18:1 in PC3 cells is 6.0 ± 1.7 times of that in RWPE1 cells (Figure 4b). FA 16:1 and FA 18:2 also increased by 3.4 ± 0.5 and 3.7 ± 0.7 times in PC3 cells as compared to RWPE1 cells, respectively. Interestingly, although the absolute quantity of Δ9 and Δ11 isomers of FA 18:1 both increased in PC3 cells, the relative composition of the Δ11 isomer decreased. As shown in the pie charts of Figure 4b inset, %composition of the Δ11 isomer decreased from 48.0 ± 1.3% in RWPE1 cells to 31.0 ± 0.9% in PC3 cells. FA 18:1 Δ9 and Δ11 isomers of are biosynthesized from FA 16:0 (palmitic acid), however with the opposite sequences of chain elongation and desaturation.19 The above data indicate variations in biosynthesis or metabolic pathways of the two C=C location isomers of FA 18:1 from normal to cancerous prostate cancer cells lines.
In conclusion, a new method has been developed to enable fast and sensitive quantitation of unsaturated FAs based on coupling online C=C tagging with acetone and MS/MS. Since CID of acetone-tagged FAs produces abundant tag loss ions besides C=C diagnostic ions, 58 Da NLS and PB-MS/MS can be obtained from the same workflow, leading to quantitation of FAs with confident C=C location assignment. This unique analytical capability was demonstrated with FA analysis from human plasma, whole blood, and various cell lines. Moreover, compositions for FA C=C location isomers can be readily obtained for biological studies, as demonstrated with FA 18:1 T9/T11 and FA 18:3 ω-3/ω-6, respectively. As compared to traditional GC-MS approach, this new method has several attractive features, including short analysis time (in minutes) due to fast on-line photo-chemical tagging, small sample usage (i.e. 2 µL whole blood analysis), and confident assignment of C=C locations without comparisons to standards. We believe this method could be readily applied for disease studies, providing another level of understanding of the biological processes of regulating the FA isomers, which might well lead to the discovery of the lipid biomarkers.
Supplementary Material
SCHEME 1.
Selective detection of unsaturated FAs from complex mixtures using in-solution acetone tagging (PB reaction) followed by gas-phase de-tagging in MS/MS.
Acknowledgments
This research was supported by National Science Foundation (Project CHE-1308114 to Y.X.) and National Institute of Health (Project 1RO1GM106016 to Z.O.).
Z.O. is the founder of PUSPEC Technologies Inc.
Footnotes
ASSOCIATED CONTENT
Supporting Information
The Supporting Information is available free of charge on the ACS Publications website.
Author Contributions
The manuscript was written through contributions of all authors. / All authors have given approval to the final version of the manuscript.
All other authors declare no conflict of interest.
REFERENCES
- 1.Wymann MP, Schneiter R. Nat. Rev. Mol. Cell Biol. 2008;9:162–176. doi: 10.1038/nrm2335. [DOI] [PubMed] [Google Scholar]
- 2.van Meer G, Voelker DR, Feigenson GW. Nat. Rev. Mol. Cell Biol. 2008;9:112–124. doi: 10.1038/nrm2330. [DOI] [PMC free article] [PubMed] [Google Scholar]
- 3.Wijendran V, Hayes KC. Annu. Rev. Nutr. 2004;24:597–615. doi: 10.1146/annurev.nutr.24.012003.132106. [DOI] [PubMed] [Google Scholar]
- 4.Han XL, Gross RW. J. Lipid. Res. 2003;44:1071–1079. doi: 10.1194/jlr.R300004-JLR200. [DOI] [PubMed] [Google Scholar]
- 5.Han XL, Gross RW. Mass Spectrom. Rev. 2005;24:367–412. doi: 10.1002/mas.20023. [DOI] [PubMed] [Google Scholar]
- 6.Blanksby SJ, Mitchell TW. Anu. Rev. Anal. Chem. 2010;3:433–465. doi: 10.1146/annurev.anchem.111808.073705. [DOI] [PubMed] [Google Scholar]
- 7.Murphy RC. Tandem Mass Spectrometry of Lipids: Molecular Analysis of Complex Lipids. Royal Society of Chemistry; 2014. [Google Scholar]
- 8.Yang W-C, Adamec J, Regnier FE. Anal. Chem. 2007;79:5150–5157. doi: 10.1021/ac070311t. [DOI] [PubMed] [Google Scholar]
- 9.Wang M, Han RH, Han X. Anal. Chem. 2013;85:9312–9320. doi: 10.1021/ac402078p. [DOI] [PMC free article] [PubMed] [Google Scholar]
- 10.Yang K, Dilthey BG, Gross RW. Anal. Chem. 2013;85:9742–9750. doi: 10.1021/ac402104u. [DOI] [PMC free article] [PubMed] [Google Scholar]
- 11.Ma X, Xia Y. Angew. Chem. Int. Ed. 2014;126:2592–2596. doi: 10.1002/anie.201310699. [DOI] [PubMed] [Google Scholar]
- 12.Stinson CA, Xia Y. Analyst. 2016;141:3696–3704. doi: 10.1039/c6an00015k. [DOI] [PubMed] [Google Scholar]
- 13.Ma X, Chong L, Tian R, Shi R, Hu TY, Ouyang Z, Xia Y. Proc. Natl. Acad. Sci. U. S. A. 2016;113:2573–2578. doi: 10.1073/pnas.1523356113. [DOI] [PMC free article] [PubMed] [Google Scholar]
- 14.Johnson DW, Beckman K, Fellenberg AJ, Robinson BS, Poulos A. Lipids. 1992;27:177–180. doi: 10.1007/BF02536174. [DOI] [PubMed] [Google Scholar]
- 15.Norrish RGW, Bramford CH. Nature. 1936;138:1016–1016. [Google Scholar]
- 16.Paul H. Chem. Phys. 1979;40:265–274. [Google Scholar]
- 17.Currie E, Schulze A, Zechner R, Walther, Tobias C, Farese Jr, Robert V. Cell Metab. 2013;18:153–161. doi: 10.1016/j.cmet.2013.05.017. [DOI] [PMC free article] [PubMed] [Google Scholar]
- 18.Roongta UV, Pabalan JG, Wang X, Ryseck R-P, Fargnoli J, Henley BJ, Yang W-P, Zhu J, Madireddi MT, Lawrence RM, Wong TW, Rupnow BA. Mol. Cancer. Res. 2011;9:1551–1561. doi: 10.1158/1541-7786.MCR-11-0126. [DOI] [PubMed] [Google Scholar]
- 19.Bond LM, Miyazaki M, O’Neill LM, Ding F, Ntambi JM. In: Biochemistry of Lipids, Lipoproteins and Membranes (Sixth Edition) McLeod RS, editor. Elsevier: Boston; 2016. pp. 185–208. [Google Scholar]
Associated Data
This section collects any data citations, data availability statements, or supplementary materials included in this article.


