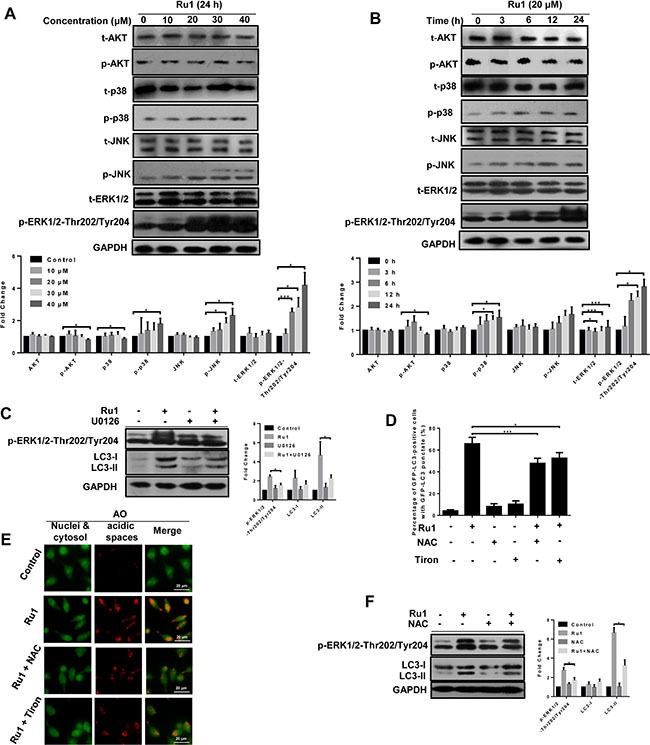
Figure 7. The ERK signaling pathway is involved in ROS-dependent autophagy induced by Ru1 in A549 cells.

(A and B) Western blot analysis of the expression level of total and the phosphorylation status of MAP kinases, AKT and ERK1/2. Below, quantification of the bands normalized by GAPDH. (C) Western blot analysis of the levels of LC3-I/II and p-ERK1/2. Right, quantification of the bands normalized by GAPDH. A549 cells were incubated with 20 μM of Ru1 for 24 h with, or without, the ERK phosphorylation inhibitor U0126 (20 μM) pre-treatment. (D) GFP-LC3-postive cells were quantified after 20 μM of Ru1 treatment for 24 h with, or without, 1-h NAC (10 mM) or Tiron (5 mM) pre-treatment. (E) Fluorescence microscope analysis of cellular AVOs level by AO staining after 20 μM of Ru1 treatment for 24 h with, or without, 1-h NAC (10 mM) or Tiron (5 mM) pre-treatment. (F) Western blot analysis of the level of LC3-I/II and p-ERK1/2. Right, quantification of the bands normalized by GAPDH. A549 cells were incubated with 20 μM of Ru1 for 24 h with, or without, 1-h NAC (10 mM) pre-treatment. Results were represented as mean ± SD (*p < 0.05, ***p < 0.001).
