
Figure 4. Decreased miR-26a could promote the distribution of side-population cells.
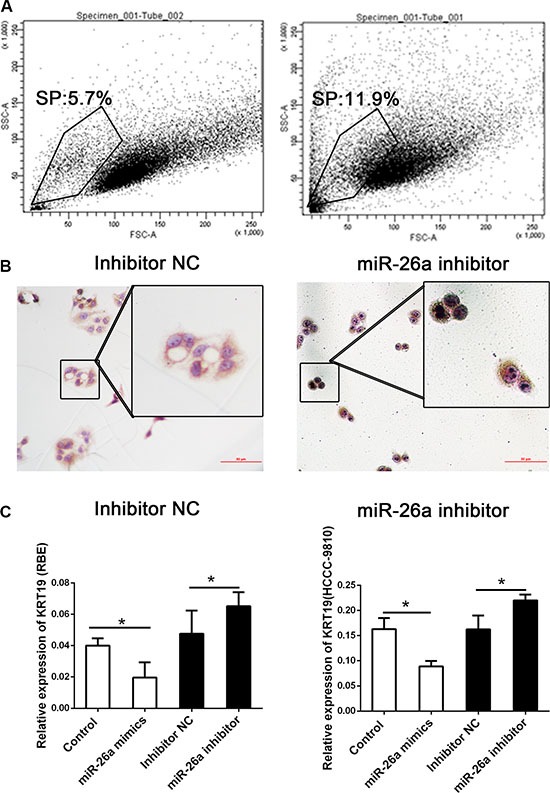
(A) The percentage in the SP cells detected by flow cytometry (B) Immunocytochemistry on cytosine of sorted cells targeting KRT19. Scale bar: 200 mm; magnification scale bars 100 mm. (C) Relative expression of KRT19 in cells treated with miR-26a mimics, inhibitor or controls. *indicates significant difference compared with that of control cells (P < 0.05). All tests were performed in triplicate and presented as mean ± SE.