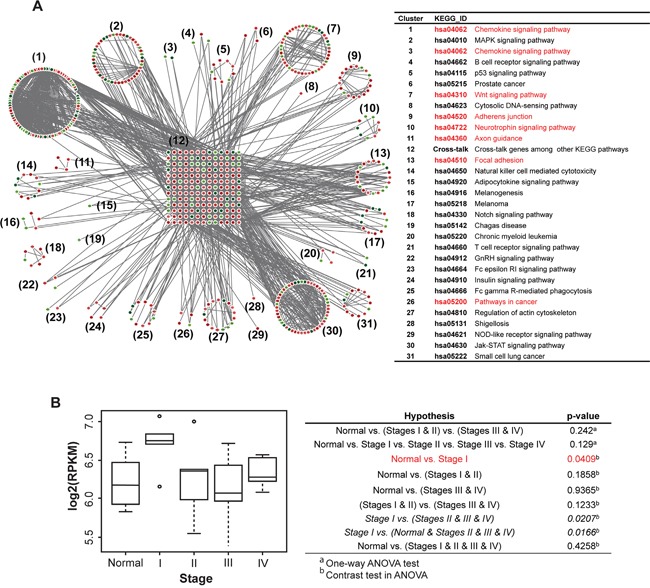
Figure 1. Network analysis in a Korean GC RNA-Seq dataset shows an underlying GC tumor oncogenetic network, under various signaling contexts.

A. PATHOME analysis of Korean GC dataset GSE36968 resulted in 31 functional clusters consisting of significant KEGG subpathways. The clusters were assigned to their corresponding KEGG pathway titles. The network diagram showed upregulated genes in red and downregulated genes in green (left panel), and the designated KEGG pathway titles noted in the right table. The network contained RHOA as a “cross-junction” involved in several pathways (see details in the main text). Pathways related to RHOA are marked red. B. From previous Asian GC samples (deposited in GEO; GSE36968), RHOA expression was inspected throughout GC tumor stages. The x-axis represents stage, and the y-axis log2-scaled RPKM. Stage I patients showed higher RHOA gene expression compared to other stage patients, including normal controls.
