

Summary
Genomic rearrangements resulting in activating kinase fusions have been increasingly described in a number of cancers including malignant melanoma, but their frequency in specific melanoma subtypes has not been reported. We used break-apart fluorescence in-situ hybridization (FISH) to identify genomic rearrangements in tissues from 59 patients with various types of malignant melanoma including acral lentiginous, mucosal, superficial spreading, and nodular. We identified four genomic rearrangements involving the genes BRAF, RET, and ROS1. Of these, three were confirmed by IHC or sequencing and one was found to be an ARMC10-BRAF fusion that has not been previously reported in melanoma. These fusions occurred in different subtypes of melanoma but all in tumors lacking known driver mutations. Our data suggest gene fusions are more common than previously thought-and should be further explored particularly in melanomas lacking known driver mutations.
Keywords: Melanoma, rearrangement, pan-negative, acral, kinase
Introduction
Metastatic melanoma is an aggressive cancer which until recently had a 5-year survival rate of less than 15% when spread to distant sites (Leung et al., 2012, Chang et al., 1998). Approximately 90% of all melanomas arise on chronically sun-damaged skin or intermittently sun-exposed skin, traditionally classified into superficial spreading, lentigo maligna, and nodular subtypes (Bulliard et al., 2007, Whiteman et al., 2006, Shain and Bastian, 2016). The second most common type of melanoma (4%) is uveal melanoma, which occurs in the pigmented areas of the eye and is also partially related to UV exposure (Singh et al., 2011, Pane and Hirst, 2000). Although less common, other types can arise on non-sun-exposed areas such as acral lentiginous melanomas and mucosal melanomas. Acral lentiginous melanomas account for 2-3% of all melanomas and occur on non-glabrous skin such as the palms of the hands, soles of the feet, and underneath fingernails and toenails (Phan et al., 2007, Bradford et al., 2009). Mucosal melanomas (1%) arise in mucosa of the sinonasal, oral, anorectal, or vulvovaginal regions (Chang et al., 2015). While these melanoma subtypes differ in their location and molecular characteristics, they are all aggressive once they have metastasized and typically respond poorly to currently available therapy (Bhatia et al., 2009).
Nearly 50% of patients with cutaneous melanoma have an activating mutation in BRAF of which V600E is the most common mutation, which can be treated with inhibitors specific for the BRAFV600E mutation or its downstream kinase MEK (Davies et al., 2002 Davies et al., 2015, McArthur et al., 2014, Holderfield et al., 2014). However, BRAFV600E mutations are less common in other melanoma subtypes (approximately 10-15% in acral lentiginous and mucosal melanomas) (Yamazaki et al., 2015, Menzies et al., 2012, Lee et al., 2011, Sasaki et al., 2004). Other oncogenic driver mutations in genes such as NRAS, KIT, GNAQ, and GNA11 have been identified in different melanoma subtypes but at a much lower frequency (Hodis et al., 2012). Overall, approximately 25% of cutaneous melanomas and nearly 40-50% of non-cutaneous melanomas lack these common driver mutations (“pan-negative”) and have no targeted therapy options available (Xia et al., 2014).
An alternate mechanism of BRAF activation, gene fusion, has been identified across several cancer types and has been found in a small percentage of cutaneous melanomas (Hutchinson et al., 2013, Menzies et al., 2015, Ross et al., 2015, Palanisamy et al., 2010, Botton et al., 2013, Stransky et al., 2014). Genomic alterations include structural changes in chromosomes. Gene fusions are the result of genomic rearrangements that join two previously separated genes. Oncogenic fusions in common kinases such as BRAF, ALK, MET, ROS1, RET, and NTRK1 have been found in Spitz nevi and Spitzoid melanomas (Wiesner et al., 2014, Yeh et al., 2015). Analysis of the TCGA database containing 328 cutaneous melanomas identified 223 different fusion events including BRAF and RAF1 kinases, however no fusions in ALK, ROS1, RET, or NTRK1 were identified in this set of cutaneous melanomas (Cancer Genome Atlas, 2015). In a recent study, ALK fusions were reported in 4/30 (13%) of acral lentiginous melanomas, and none were identified in the mucosal melanomas (Niu et al., 2013). These studies suggest that the genes involved in oncogenic fusion events in melanoma may be subtype-specific, however the frequency of BRAF, ALK, ROS1, RET, and NTRK1 fusions has not been systematically studied across different melanoma subtypes. Characterizing kinase fusions in specific melanoma subtypes is critical in understanding the development of these melanomas and devising new treatment strategies.
In this study, we used break-apart fluorescence in situ hybridization (FISH) to screen for kinase rearrangements in BRAF, ALK, ROS1, RET, and NTRK1 in different subtypes of melanoma from 59 patients. We identified genomic rearrangements in tumors from four patients involving BRAF, RET, and ROS1. These rearrangements occurred in superficial spreading, acral lentiginous, and unknown primary subtypes, and we demonstrated three out of four rearrangements result in gene fusions by IHC or targeted RNA sequencing. These findings highlight the differences in gene rearrangements between specific melanoma subtypes, and prompt further characterization of the gene fusion landscape in all types of melanomas.
Results
Break-apart FISH identifies genomic alterations in RET, ROS1, NTRK1, and BRAF
In order to identify genomic rearrangements in BRAF, ALK, RET, ROS1, and NTRK1 kinase genes, we used break-apart FISH to screen 98 samples from 59 patient tumors (27 primary and 32 metastatic) across multiple subtypes including superficial spreading, nodular, acral lentiginous, mucosal, lentigo maligna, desmoplastic, and unknown primary (Table 1). We identified 4 samples that had genomic rearrangements (Figure 1A, D-F) and 2 samples that showed an atypical hybridization pattern of NTRK1 (Figure 1B-C).
Table 1. Clinical Characteristics of Melanoma Patients.
| No. | Subtype | Gender | Age | Sample Source | Tissue Source |
|---|---|---|---|---|---|
| 1 | Superficial spreading | M | 75 | Metastatic | Lymph node |
| 2 | Superficial spreading | M | 46 | Metastatic | GI |
| 3 | Superficial spreading | M | 50 | Metastatic | Lymph node |
| 4 | Superficial spreading | M | 73 | Metastatic | Subcutaneous |
| 5 | Superficial spreading | F | 58 | Metastatic | Brain |
| 6 | Superficial spreading | F | 61 | Metastatic | Thyroid |
| 7 | Superficial spreading | M | 75 | Metastatic | Subcutaneous |
| 8 | Superficial spreading | F | 66 | Metastatic | Lymph node |
| 9 | Superficial spreading | F | 34 | Metastatic | Subcutaneous |
| 10 | Superficial spreading | F | 54 | Primary | Right upper chest |
| 11 | Superficial spreading | F | 62 | Metastatic | Subcutaneous |
| 12 | Nodular | M | 68 | Metastatic | Bone |
| 13 | Nodular | M | 66 | Metastatic | Subcutaneous |
| 14 | Nodular | M | 64 | Metastatic | GI |
| 15 | Nodular | F | 60 | Metastatic | Subcutaneous |
| 16 | Nodular | M | 88 | Metastatic | Subcutaneous |
| 17 | Nodular | M | 26 | Metastatic | Subcutaneous |
| 18 | Nodular | M | 78 | Metastatic | Subcutaneous |
| 19 | Nodular | F | 69 | Metastatic | Brain |
| 20 | Nodular | M | 74 | Metastatic | Subcutaneous |
| 21 | Nodular | M | 78 | Primary | Left upper arm |
| 22 | Nodular | M | 72 | Metastatic | Brain |
| 23 | Acral lentiginous | M | 60 | Primary | Right ankle |
| 24 | Acral lentiginous | F | 64 | Primary | Bottom of right foot |
| 25 | Acral lentiginous | F | 64 | Metastatic | Breast |
| 26 | Acral lentiginous | M | 61 | Metastatic | Subcutaneous |
| 27 | Acral lentiginous | M | 54 | Primary | Left 4th toe |
| 28 | Acral lentiginous | M | 62 | Primary | Right lateral foot |
| 29 | Acral lentiginous | F | 39 | Primary | Left thumbnail |
| 30 | Acral lentiginous | F | 77 | Primary | Left foot |
| 31 | Acral lentiginous | M | 46 | Metastatic | Subcutaneous |
| 32 | Acral lentiginous | F | 56 | Metastatic | Lymph node |
| 33 | Acral lentiginous | M | 38 | Primary | Left thumb |
| 34 | Acral lentiginous | M | 66 | Primary | Webspace of 4th and 5th toe |
| 35 | Acral lentiginous | F | 61 | Primary | Bottom of right foot |
| 36 | Acral lentiginous | M | 87 | Primary | Left great toe |
| 37 | Acral lentiginous | M | 78 | Primary | Sole of left foot |
| 38 | Acral lentiginous | F | 66 | Primary | Right third tow |
| 39 | Acral lentiginous | F | 56 | Primary | Left heel |
| 40 | Mucosal | F | 35 | Metastatic | Brain |
| 41 | Mucosal | M | 75 | Primary | Anorectal |
| 42 | Mucosal | F | 85 | Primary | Maxillary sinus |
| 43 | Mucosal | M | 78 | Primary | Pelvic cavity |
| 44 | Mucosal | F | 97 | Primary | Nasopharyngeal |
| 45 | Mucosal | F | 51 | Primary | Vaginal |
| 46 | Mucosal | F | 88 | Primary | Vulvovaginal |
| 47 | Mucosal | F | 61 | Metastatic | Lymph node |
| 48 | Mucosal | F | 72 | Primary | Rectum |
| 49 | Mucosal | F | 63 | Primary | Anal canal |
| 50 | Mucosal | F | 68 | Metastatic | Pancreas |
| 51 | Mucosal | F | 66 | Primary | Anorectal |
| 52 | Mucosal | F | 78 | Primary | Vaginal |
| 53 | Mucosal | F | 71 | Primary | Vulva |
| 54 | Unknown primary | F | 49 | Metastatic | Lymph node |
| 55 | Unknown primary | M | 59 | Metastatic | Subcutaneous |
| 56 | Unknown primary | M | 54 | Metastatic | Lymph node |
| 57 | Lentigo | M | 68 | Metastatic | Subcutaneous |
| 58 | Lentigo | M | 46 | Primary | Mid back |
| 59 | Desmoplastic | M | 57 | Metastatic | Lung |
Figure 1.
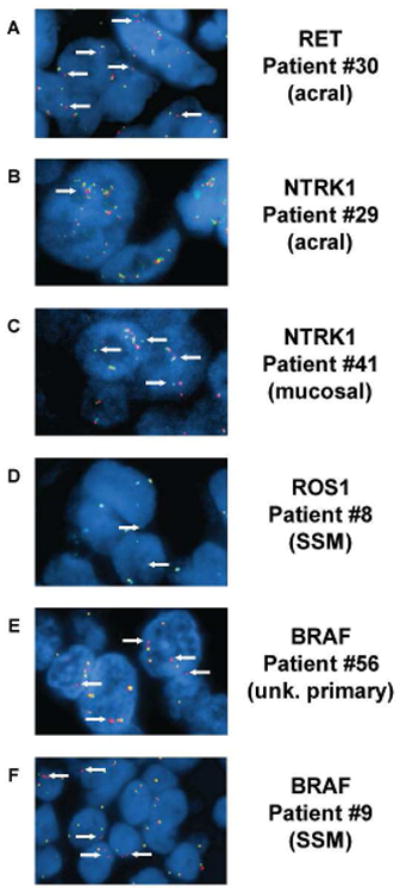
FISH images show rearrangements and alterations in different melanoma subtypes. Representative FISH images from tumors with rearrangement or atypical staining patterns. (A) An acral lentiginous melanoma from patient #30 harboring a RET rearrangement where single copies of the 3′probes are observed (white arrows). This sample is classified as a rearrangement. (B) An acral lentiginous melanoma from patient #29 shows an NTRK1 atypical FISH pattern including mini clusters of both probe signals (white arrows). This sample is classified as an unknown genomic alteration. (C) A mucosal melanoma with NTRK1 atypical FISH pattern where single copies of the 5′ probes are seen adjacent to intact copies of NTRK1 (white arrows). This sample is classified as an unknown genomic alteration. (D) A superficial spreading melanoma from patient #8 shows single copies of the 3′ROS1 probe (white arrows). This sample is classified as a rearrangement. (E) An unknown primary melanoma from patient #56 shows single copies of the 3′BRAF probe (white arrows). This sample is classified as a rearrangement. (F) A superficial spreading melanoma from patient #7 shows single copies of the 3′BRAF probe. This sample is classified as a rearrangement.
One sample from a patient with acral lentiginous melanoma of the plantar surface of the foot (#30) had a RET hybridization pattern showing single copies of the 3′ probe consistent with a rearrangement (Figure 1A). Another sample from a patient with acral lentiginous foot melanoma (#29) had an atypical FISH pattern for NTRK1. In this sample, there was both clustering of the NTRK1 signal and separation of the 3′ and 5′ signals (Figure 1B). The distance between them was, however, below the scoring threshold used to indicate the presence of a break in the gene. Multiple samples from this case were examined by FISH and interestingly the different samples had discordant results. Two samples were classified as NTRK1 atypical while two other samples from the same tumor were classified as negative for any atypical NTRK1 patterns suggesting intra-tumoral heterogeneity. H&E staining and NTRK1 FISH analysis of the original patient specimen showed the negative biopsies were taken from a region which contained only early stage in-situ melanoma cells, whereas the NTRK1 atypical biopsies were taken from a region of the same sample which contained more advanced vertical growth phase tumor cells (Fig. S1). An atypical FISH pattern for NTRK1 was also observed in a nasal sinusoid mucosal melanoma sample (#41), where single signals of the 5′ portion of NTRK1 were adjacent to an intact copy of the NTRK1 gene (Figure 1C). Both NTRK1 atypical hybridization patterns suggest the presence of an unknown genomic alteration but does not indicate a rearrangement or a gene fusion. These three cases are the first demonstrations of RET and NTRK1 genomic alterations in melanoma subtypes other than Spitz nevus and Spitzoid melanoma.
Samples from eleven superficial spreading cutaneous melanomas were examined and two had rearrangements. A ROS1 rearrangement was identified in a sample from patient #8 where single signals were observed for the 3′probe (Figure 1D), and in a sample from patient #9 a BRAF rearrangement was identified with split 3′and 5′ signals (Figure 1F). Samples from four unknown primary melanomas were included in the analysis. A BRAF rearrangement with extra copies of single 3′BRAF signals was observed in a metastatic lymph node in one patient with an unknown primary melanoma (Figure 1E). Overall, 2 out of 11 superficial spreading melanomas (18.2%), 1 out of 17 acral lentiginous melanomas (5.9%), and 1 out of 3 unknown primary tumors (33%) had genomic rearrangements.
NTRK1, RET, and ROS1 expression in tumors with genomic rearrangements
Rearranged or atypical hybridization patterns by FISH do not necessarily indicate a functional gene fusion event. We used immunohistochemistry (IHC) with kinase-domain specific antibodies for NTRK1, RET, and ROS1 to determine if protein was expressed in the rearranged or atypical samples. The sample from patient #30 with a RET rearrangement from an early-stage primary in-situ acral lentiginous melanoma showed protein expression suggesting the presence of a functional gene fusion (Figure 2A).
Figure 2.
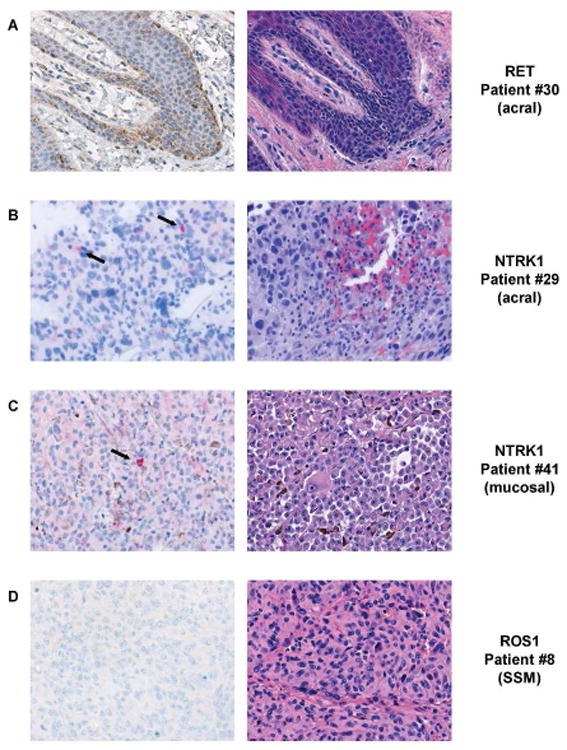
Immunohistochemistry analysis of tumor samples with RET, and ROS1 genomic rearrangements and NTRK1 unknown genomic alterations. IHC analysis of tumors with rearrangement or atypical FISH hybridization pattern. (A) Tumor from patient #30, identified with a RET rearrangement by FISH, shows staining with the brown DAB chromagen (left panel) indicating expression of the RET protein. The H&E section of this tumor (right panel) shows large, pleomorphic tumor cells with some blood. (B) NTRK1 staining (black arrows) of a red chromagen in of an acral lentiginous melanoma from patient #29 with an unknown genomic alteration is shown (left panel) and the H&E stain of malignant tumor cells is shown (right panel). (C) Lower protein expression for NTRK1 is seen in scattered tumor cells precipitating the red chromagen (black arrow) in a sample from patient #41 (left panel) that was identified with an unknown genomic alteration by FISH. The matched H&E section (right panel) shows small amounts of melanin (brown pigment) are scattered throughout the section. (D) ROS1 IHC (left panel) of a superficial spreading melanoma from patient #8 found to have a ROS1 genomic rearragnement by FISH. The ROS1 IHC does not show any staining of the brown DAB chromagen (left panel) and thus is negative for ROS1 protein expression. The H&E stain of the tumor is shown (right panel).
The sample from patient #29 with an atypical NTRK1 FISH hybridization pattern showed scattered expression of the NTRK1 protein suggesting the atypical genomic alteration results in protein expression (Figure 2B). Expression of NTRK1 was observed only in scattered malignant melanocytes in the sample from patient #41 (Figure 2C) and was substantially different from patient #29. The conclusion from IHC is consistent with the FISH analysis which found different genomic events between the two tumors.
No IHC expression of ROS1 was demonstrated for patient #8 (Figure 2D). Real-time qPCR was also performed on tumor tissue and ROS1 transcript expression was undetectable, confirming the negative IHC result (Fig. S3). These data suggest the genomic rearrangement did not result in a functional gene fusion.
Characterization of BRAF rearrangements
BRAF fusions in melanoma have been reported to occur frequently in tumor samples with a Spitz-like morphology (Menzies et al., 2015, Botton et al., 2013). Both of our samples with BRAF rearrangements were examined by an experienced dermatopathologist, and did not show Spitz cytomorphology (Figure 3A). We performed targeted RNA sequencing for each sample positive for a BRAF rearrangement and identified the BRAF fusion transcripts and 5′ gene partners.
Figure 3.
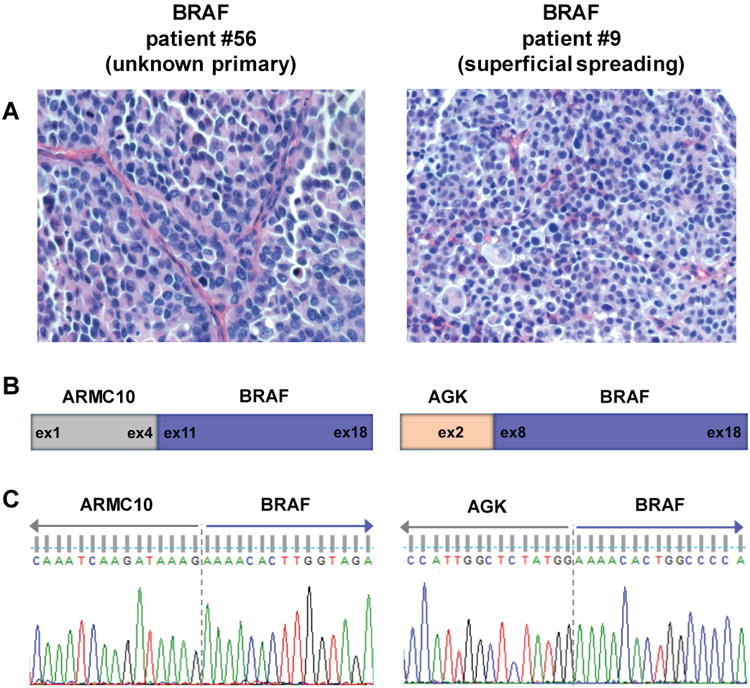
Characterization and validation of BRAF fusions in rearranged samples. (A) Representative H&E stained images from each BRAF fusion tumor show lack of Spitz associated morphology in these tumors. (B) Schematic of exonic breakpoints in the BRAF fusions. Targeted RNA sequencing was used to identify the breakpoints and 5′ partners for each BRAF fusion. (C) Sanger sequencing confirmation of BRAF fusion transcripts. RT-PCR products for each fusion were sequenced and chromatograms confirm in-frame transcripts for ARMC10-BRAF and AGK-BRAF fusions with the expected breakpoints.
In the metastatic sample from patient #9 with superficial spreading melanoma, an AGK-BRAF fusion transcript was found that fused exon 2 of AGK with exons 8 through 18 of BRAF (Figure 3B). The sample from patient #56, a melanoma of unknown primary, was found to have an ARMC10-BRAF transcript with a fusion of exons 1-4 of ARMC10 and exons 11-18 of BRAF (Figure 3B). The fusion and breakpoint were confirmed for both patient samples using RT-PCR and Sanger sequencing (Figure 3C). AGK-BRAF fusions have been previously identified in melanomas (Menzies et al., 2015, Botton et al., 2013), however, this is the first report of an ARMC10-BRAF fusion occurring in a melanoma.
Classification of genomic alterations
Break-apart FISH analysis identified genomic rearrangements in tumors from four melanoma patients. Tumor from patient #30 with a RET rearrangement also had positive RET IHC staining. Because RET is normally hardly detectable, positive RET staining suggests upregulation due to a gene fusion. There was, however, not sufficient tumor material for confirmation by targeted RNA sequencing (Table 2). Tumor from patient #8 with a ROS1 rearrangement was negative for ROS1 protein expression by IHC, therefore a functional kinase fusion did not occur. Targeted RNA sequencing was performed on RNA from this tumor, and as expected, no ROS1 fusion transcripts were identified (Table 2). This result is consistent with our real-time qPCR data (Fig. S3). BRAF rearrangements in tumors from patients #56 and #7 were confirmed using targeted RNA sequencing. Melanomas express endogenous BRAF protein so IHC cannot be used for validation (Table 2). Therefore, we identified a total of three kinase fusions occurring in BRAF and RET genes.
Table 2. Classification of genomic alterations based on findings from FISH, IHC, and targeted RNA sequencing.
| No. | Gene | Technique | Classification | |||||
|---|---|---|---|---|---|---|---|---|
|
|
|
|||||||
| FISH | IHC | Targeted RNA seq | Rearrangement | Kinase fusion | Unknown genomic alteration | |||
| Patient #30 | RET | Positive | Positive | -* | Yes | Yes | No | |
| Patient #29 | NTRK1 | Negative, atypical | Positive | - | No | No | Yes | |
| Patient #41 | NTRK1 | Negative, atypical | Positive | - | No | No | Yes | |
| Patient #8 | ROS1 | Positive | Negative | Negative | Yes | No | No | |
| Patient #56 | BRAF | Positive | - | Positive | Yes | Yes | No | |
| Patient #9 | BRAF | Positive | - | Positive | Yes | Yes | No | |
“-”indicates experiment was not performed
Attempted but unsuccessful due to lack of material
Tumors from two patients, #29 and #41, were negative for rearrangements in the break-apart FISH analysis but had atypical hybridization patterns for NTRK1. Although these tumors did not have rearrangements, they were IHC positive for NTRK1 suggesting unknown genomic alterations led to expression of NTRK1 protein. –p0trrr cccl>
Kinase fusions occur in pan-negative patient samples
Using next generation whole exome sequencing, we examined all samples for the presence of mutations in seven common melanoma driver genes (BRAF, NRAS, KRAS, HRAS, KIT, GNAQ, and GNA11) as well as NF1, which has been recently described as a major subgroup of melanoma
Consistent with previous observations, all 6 samples with genomic alterations detected by FISH, across different subtypes, occurred in pan-negative melanoma patients whose tumor lacked any known hotspot mutations in common driver genes (Figure 4) (Botton et al., 2013, Hutchinson et al., 2013). We observed an NF1 mutation in the ROS1 rearranged superficial spreading melanoma tumor, however this rearrangement did not result in a functional gene fusion. The frequency of kinase fusions within the subset of pan-negative melanomas showed strong enrichment in cutaneous, acral lentiginous, and unknown primary subtypes compared to the overall frequency (Table 3). These findings suggest kinase fusions are more frequent across multiple subtypes of pan-negative melanomas.
Figure 4.
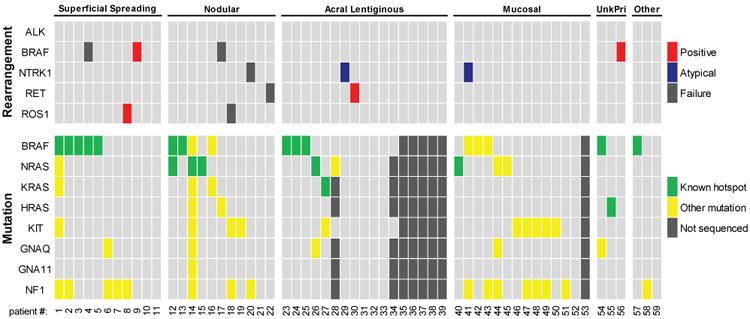
Genomic alterations occur in melanomas without hotspot mutations in common driver genes in all subtypes. Results from the FISH analysis and whole exome sequencing are presented for each melanoma patient sample. Samples were classified positive if > 15% of cells exhibited rearrangement patterns. Samples were classified as atypical if they had a consistent atypical FISH hybridization pattern and were not positive for rearrangement. Patients within each subtype are grouped by the presence of driver mutations, followed by the presence of genomic rearrangements or alterations. Dark grey bars indicate missing data for the FISH analysis (failure of hybridization for that specific gene) and the whole exome sequencing analysis (failure of library preparation for sequencing or insufficient material to use for sequencing analysis). Clinical information was analyzed for mutation testing in patients where samples were unable to be sequenced, and resulted in only partially missing driver gene mutation status for some patients.
Table 3. Kinase fusion frequency in melanomas.
| Subtype | Number of kinase fusions | |
|---|---|---|
|
| ||
| All patients | Pan-negative patients | |
| Superficial spreading | 1/11 (9.1%) | 1/6 (16.7%) |
| Nodular | 0/11 (0%) | 0/7 (0%) |
| Acral lentiginous | 1/17 (5.9%) | 1/5 (20%) |
| Mucosal | 0/14 (0%) | 0/12 (0%) |
| Unknown primary | 1/3 (33.3%) | 1/1 (100%) |
| Lentigo | 0/2 (0%) | 0/1 (0%) |
| Desmoplastic | 0/1 (0%) | 0/1 (0%) |
| Total: | 3/59 (5.1%) | 3/33 (9.1%) |
Discussion
In this study we report a high frequency of kinase fusions in pan-negative melanoma samples across different subtypes, which lack common driver gene mutations. We identified a RET fusion in an acral lentiginous melanoma and unknown genomic alterations in NTRK1 in acral lentiginous and mucosal melanomas. These genomic alterations have not been previously described in melanoma. We did not find RET and NTRK1 alterations in cutaneous melanoma subtypes. Conversely, we observed BRAF fusions in cutaneous melanoma subtypes but not in acral lentiginous or mucosal melanomas. Finally, we did observe a ROS1 rearrangement in a cutaneous superficial spreading melanoma although lack of expression suggests this may not be a functional gene fusion. Our patient numbers are not large enough to conclude that these events are mutually exclusive.
Kinase fusions in NTRK1 and RET have been previously reported in Spitz neoplasms (Wiesner et al., 2014) but have yet to be described in malignant melanoma. Here, we identified the first case of a RET fusion in an acral lentiginous melanoma. Acral lentiginous melanomas are known to have a lower mutational burden, but higher levels of genomic instability and more DNA copy number alterations (Curtin et al., 2005). We also found an atypical FISH pattern in an acral lentiginous melanoma which corresponded with NTRK1 protein expression. Interestingly, the atypical NTRK1 FISH pattern was observed in more advanced vertical growth phase cells but not early stage melanoma in-situ tumor cells, suggesting the development of the atypical NTRK1 genomic alteration may be associated with melanoma progression. Further investigation of the genomic NTRK1 region is required to fully understand our observations and the tumorigenic potential and significance of NTRK1 alterations in melanoma.
In our cohort, we also observed a ROS1 rearrangement by FISH which did not express protein by IHC. To rule out the possibility of a false negative IHC result, we ran the samples with positive and negative controls that were stained within two hours of being cut (Fig. S2). The results were unchanged. Hence, the probability for a false negative outcome by IHC is unlikely. We also performed real-time qPCR and did not detect any ROS1 transcript expression (Fig. S3). Alternate explanations for the inconsistency between the ROS1 rearrangement FISH and IHC results include a 5′ gene partner that is not expressed or an intergenic rearrangement where ROS1 does not have a 5′ gene partner.
Detection of activating rearrangements in the clinical arena can be complex and time-consuming. Structural genomic alterations such as potential gene fusions can be identified using FISH, but their expression must be confirmed by other methods since these alterations are not always functional. Using break-apart FISH as the only molecular diagnostic technique may result in false negatives when the target genes are in the same chromosome and are located less than 10 Mbp apart, unless the fusion is generated by a chromosomal deletion which encompasses the sequences of one of the probes. Examples of this have been observed with the EML4-ALK rearrangements in lung adenocarcinoma (Ying et al., 2013). IHC can generate false positives when protein expression is a consequence of pathway crosstalk (Sullivan et al., 2015). Multiplex analysis, such as joint FISH and IHC, increases the likelihood of detection and has been shown to increase efficacy of detection in contrast to single screening techniques. Nonetheless, there may still be discordant outcomes which could be a causal result of tumor heterogeneity, out-of-frame rearrangements, or minimally expressed fusion transcripts. Lambros et al. suggested using a massive parallel sequencing technique (MassARRAY) in conjunction with FISH and IHC to decrease the possibility of false positive or false negative results (Lambros et al., 2011). Overall there are methodological advantages and drawbacks to both FISH and IHC. In addition, FISH is of limited value in detecting new and previously undescribed rearrangements. This is obviously best done using RNA techniques as have been previously described (Lambros et al., 2011). We think multiplex analysis using a combination of FISH, RNA analysis, IHC, and other expression techniques will be needed to uncover a multitude of gene rearrangements important in the pathophysiology and treatment of melanoma and other cancers.
Altogether, our findings from FISH and IHC analyses may have clinical significance. We observed a high frequency of kinase fusions in pan-negative melanomas across most clinical subtypes. Kinase fusions are actionable therapeutic targets in other cancers and the same may be true for melanoma (Downing, 2008, Shaw and Engelman, 2014, Shaw et al., 2014, Shaw et al., 2013, Ross et al., 2015, Palanisamy et al., 2010). The demonstration here of activating kinase fusions in melanoma, particularly in pan-negative patient tumors, suggests expanded screening for fusions in patients with metastatic malignant melanoma should be considered. The data presented likely provides only a limited scope of the frequency of fusions in melanoma. Further work in this area is warranted and could uncover other gene fusions that are important in the development, growth and treatment of melanoma.
Materials and Methods
Melanoma patient samples
Ninety-eight samples from 59 melanoma patients from the University of Colorado Denver Hospital, from 2008-2015, were included in the analysis. These were obtained as part of the International Melanoma Biorepository and Research Laboratory at the University of Colorado Cancer Center, with patient consent and approval from the Colorado Institutional Review Board (IRB# 05-0309). A total of 98 samples were randomly selected from superficial spreading, nodular, acral lentiginous, mucosal, desmoplastic, and unknown primary melanoma subtypes. Formalin-fixed, paraffin-embedded (FFPE) tissue microarrays (TMAs) were made from 1.5 mm punches of melanoma patient tumor FFPE blocks.
Break-apart fluorescence In Situ hybridization
This technique uses two different colored fluorescent FISH probes designed in the 5′ and 3′portion of a gene to identify potential gene fusions. The two signals will overlap in normal cells, but there will be only one signal or split apart signals in cells where a genomic rearrangement in the gene has occurred. Dual-colored FISH assays were performed using break-apart (BA) probes for ALK, BRAF, RET, and ROS1 genes, using commercial reagents (Abbott Molecular). The NTRK1 probe was developed in our laboratory as previously described (Vaishnavi et al., 2013). The BRAF BA probe set was developed for this study using BAC clones RP11-837G3 and RP11-948O19 containing human DNA inserts from regions homologous to the 3′and 5′ end of BRAF, respectively. The signals from these clones were overlapped or very close in the native copy of the gene. Assays in the tissue microarrays (TMAs) were performed as previously described (Toschi et al., 2014).
The BA FISH analyses were conducted as previously described with minor modifications (Davies et al., 2012). Duplicate tissue cores for one or more specimens per patient were analyzed. A total of 50 cells were scored in each core. For each probe set, 3′and 5′ signals physically separated by ≥1 signal diameter were considered split. Specimens were considered positive for specific gene rearrangement if >15% of the cells showed split signals or single 3′or 5′ signals.
Immunohistochemistry
Archival FFPE specimens were stained as previously described (Narita et al., 2009, Zhang et al., 2005), with the following modifications and antibodies: NTRK1 staining was performed with citrate buffer target retrieval solution (TRS pH 6) and a one hour room temperature incubation with primary rabbit monoclonal [EP1058Y] TrkA antibody (ab76291, dilution: 1:500), followed by secondary antibody (Dako Envision+ Anti-Rabbit K4003, pre-prepared standard dilution (Elias et al., 1989)). RET staining was performed with citrate buffer target retrieval solution (TRS pH 6) and a one hour room temperature incubation with primary rabbit monoclonal [EPR2871] anti-RET antibody (ab134100, dilution: 1:50), followed by secondary antibody (Dako Envision+ Anti-Rabbit K4003, pre-prepared standard dilution (Elias et al., 1989)). ROS1 staining was performed using ROS1 monoclonal antibody (Cell Signaling D4D6®, dilution: 1:25) under previously reported conditions (Boyle et al., 2015).
Next-generation whole exome sequencing
Whole exome sequencing was done on samples from 51/59 melanoma patients. Blood samples were collected in PAXGene DNA tubes and stored at 4°C until processed. Depending on material, tissue genomic DNA was isolated using the DNeasy Blood and Tissue kit or the QiaAmp DNA FFPE kit. DNA concentration and purity was determined using Qubit (Thermo Fisher Scientific) and Agilent 2100 bioanalzyer analysis. 200 ng of genomic DNA was sheared using Covaris S220 at 150bp. Sheared DNA was end-repaired and used to construct the exome library following Agilent SureSelect XT Target Enrichment System for Illumina Paired End Multiplexed Sequencing Library (cat# G9641B). Exome capture was done through hybridization using XT5 probe. Resulting captured libraries were indexed and purified. The cDNA library was validated on the Agilent 2100 Bioanalzyer using DNA-1000 chip. Libraries were sequenced on the Illumina HiSeq 2000 with 125 bp pair-end reads. We obtained an average of 400× and 200× sequencing coverage for the cancer and normal exomes, respectively. Data for blood and tissue samples were analyzed using the data analysis pipeline IMPACT (Hintzsche et al., 2016), and germ line variants identified in normal blood were removed.
Targeted RNA sequencing
RNA was isolated from fresh frozen patient tumor tissue using the RNeasy Plus Mini Kit (Qiagen). Tissues were homogenized with the TissueLyser II (2 × 2 minutes at 30 Hz) and on-column DNAse I digest was performed per protocol using the RNAse-free DNAse I set (Qiagen). Library preparation and sequencing were performed by the University of Colorado Denver Genomics and Microarray Core. Targeted libraries were generated using the Ovation cDNA module and Ovation Fusion Panel Target Enrichment System (NuGEN, Inc.) with 250 ng - 750 ng RNA input as previously described (Scolnick et al., 2015). Paired-end sequencing (2 × 75 bp) was performed on a MiSeq instrument (Illumina) and approximately 1.5 million total reads were collected for each sample. Fusions were detected by analyzing FASTQ files on the BaseSpace data analysis hosting platform (Illumina) using the NuGEN Ovation Fusion Target App (NuGEN).
RT- PCR, Sanger sequencing
RNA was isolated from fresh frozen patient tumor tissue using the RNeasy Plus Mini Kit (Qiagen). Tissues were homogenized with the TissueLyser II (2 × 2 minutes at 30 Hz) and on-column DNAse I digest was performed per protocol using the RNAse-free DNAse I set (Qiagen). RNA was reverse transcribed into cDNA using the Verso cDNA Synthesis Kit (Thermo Scientific). PCR was performed using primers specific for the AGK-BRAF fusion (CGCTTCGAAATCACTGGAAGAA (sense); CCACGAAATCCTTGGTCTCTAATC (anti-sense)) and ARMC10-BRAF fusion (TCGCAGCCTGAAGACTTAAC (sense); GTGGAATAGCCCATGAAGAGTAG (anti-sense)). PCR products were purified using the QIAquick PCR purification kit (Qiagen) and submitted to the Barbara Davis Center for sequencing using the BigDye Terminator Cycle Sequencing Ready Reaction kit version 3.1 (Applied Biosystems) with both forward and reverse primers used in the PCR reactions.
Quantitative Real-Time PCR
The real-time PCR reaction was done in triplicate using PowerUp SYBER Green master mix (Thermo Scientific) and was analyzed on the StepOne Plus real-time PCR system (Applied Biosystems). Primer sequences are as follow: exons 1-2 (TCCGAAGCTTGTCAATTTTGC (sense); TGTGCCAAGGTCAAGCTG (anti-sense)), exons 3-4 (AGGATGTCACTTTTGGAACTCTG (sense); TCTTCATATGCACCTTCCGC (anti-sense)), exons 36-37 (AAACTGACTCTGCGTCTCTTG (sense); CTTCTCCTGGTCTGTGGAAC (anti-sense)), exons 40-41 (GATGGCTCCAGAAAGTTTGATG (sense); TGCACATAGTTTAACACATCAAGG (anti-sense)).
Supplementary Material
Significance.
Driver mutations, which can be targeted therapeutically, occur in approximately 50% of patients with malignant melanoma. We show here that 3/59 (5.1%) of all melanoma patients and 3/33 (9.1%) of melanoma patients with tumors lacking hotspot mutations in common driver genes have kinase fusions that may serve as targets for therapeutic intervention. Our data suggest that broader screening for kinase fusions in melanoma should become part of clinical practice.
Acknowledgments
We wish to acknowledge the UCD Research Histology Shared Resource. We thank Dr. Theresa A. Boyle and Kim E. Ellison for assisting with immunohistochemistry.
Funding Support: This work was supported by funding from the Amy Davis Foundation, the Moore Family Foundation, and the Heidi Horner Foundation. Funding in part was also provided by the Genomics and Microarray Shared Resource of Colorado's NIH/NCI Cancer Center Support Grant P30CA046934, the University of Colorado Cancer Center, and Cancer Center Molecular Pathology Grant (NCI P30-CA046934). This work was supported in part by the NIH/NCATS Colorado CTSI Grant Number UL1 TR001082. The authors appreciate the contribution to this research made by staff members of the University of Colorado Anschutz Medical Campus Biorepository Core Facility.
References
- 1.Genomic Classification of Cutaneous Melanoma. Cell. 161:1681–96. doi: 10.1016/j.cell.2015.05.044. [DOI] [PMC free article] [PubMed] [Google Scholar]
- 2.Bhatia S, Tykodi SS, Thompson JA. Treatment of metastatic melanoma: an overview. Oncology (Williston Park) 2009;23:488–96. [PMC free article] [PubMed] [Google Scholar]
- 3.Botton T, Yeh I, Nelson T, Vemula SS, Sparatta A, Garrido MC, Allegra M, Rocchi S, Bahadoran P, Mccalmont TH, Leboit PE, Burton EA, Bollag G, Ballotti R, Bastian BC. Recurrent BRAF kinase fusions in melanocytic tumors offer an opportunity for targeted therapy. Pigment Cell Melanoma Res. 2013;26:845–51. doi: 10.1111/pcmr.12148. [DOI] [PMC free article] [PubMed] [Google Scholar]
- 4.Boyle TA, Masago K, Ellison KE, Yatabe Y, Hirsch FR. ROS1 immunohistochemistry among major genotypes of non-small-cell lung cancer. Clin Lung Cancer. 2015;16:106–11. doi: 10.1016/j.cllc.2014.10.003. [DOI] [PMC free article] [PubMed] [Google Scholar]
- 5.Bradford PT, Goldstein AM, Mcmaster ML, Tucker MA. Acral lentiginous melanoma: incidence and survival patterns in the United States, 1986-2005. Arch Dermatol. 2009;145:427–34. doi: 10.1001/archdermatol.2008.609. [DOI] [PMC free article] [PubMed] [Google Scholar]
- 6.Bulliard JL, De Weck D, Fisch T, Bordoni A, Levi F. Detailed site distribution of melanoma and sunlight exposure: aetiological patterns from a Swiss series. Ann Oncol. 2007;18:789–94. doi: 10.1093/annonc/mdl490. [DOI] [PubMed] [Google Scholar]
- 7.Cancer Genome Atlas, N. Genomic Classification of Cutaneous Melanoma. Cell. 2015;161:1681–96. doi: 10.1016/j.cell.2015.05.044. [DOI] [PMC free article] [PubMed] [Google Scholar]
- 8.Chang AE, Karnell LH, Menck HR. The National Cancer Data Base report on cutaneous and noncutaneous melanoma: a summary of 84,836 cases from the past decade. The American College of Surgeons Commission on Cancer and the American Cancer Society. Cancer. 1998;83:1664–78. doi: 10.1002/(sici)1097-0142(19981015)83:8<1664::aid-cncr23>3.0.co;2-g. [DOI] [PubMed] [Google Scholar]
- 9.Chang CL, Schabert VF, Munakata J, Donga P, Abhyankar S, Reyes CM, Yim YM. Comparative healthcare costs in patients with metastatic melanoma in the USA. Melanoma Res. 2015;25:312–20. doi: 10.1097/CMR.0000000000000159. [DOI] [PubMed] [Google Scholar]
- 10.Curtin JA, Fridlyand J, Kageshita T, Patel HN, Busam KJ, Kutzner H, Cho KH, Aiba S, Brocker EB, Leboit PE, Pinkel D, Bastian BC. Distinct sets of genetic alterations in melanoma. N Engl J Med. 2005;353:2135–47. doi: 10.1056/NEJMoa050092. [DOI] [PubMed] [Google Scholar]
- 11.Davies H, Bignell GR, Cox C, Stephens P, Edkins S, Clegg S, Teague J, Woffendin H, Garnett MJ, Bottomley W, Davis N, Dicks E, Ewing R, Floyd Y, Gray K, Hall S, Hawes R, Hughes J, Kosmidou V, Menzies A, Mould C, Parker A, Stevens C, Watt S, Hooper S, Wilson R, Jayatilake H, Gusterson BA, Cooper C, Shipley J, Hargrave D, Pritchard-Jones K, Maitland N, Chenevix-Trench G, Riggins GJ, Bigner DD, Palmieri G, Cossu A, Flanagan A, Nicholson A, Ho JW, Leung SY, Yuen ST, Weber BL, Seigler HF, Darrow TL, Paterson H, Marais R, Marshall CJ, Wooster R, Stratton MR, Futreal PA. Mutations of the BRAF gene in human cancer. Nature. 2002;417:949–54. doi: 10.1038/nature00766. [DOI] [PubMed] [Google Scholar]
- 12.Davies KD, Le AT, Theodoro MF, Skokan MC, Aisner DL, Berge EM, Terracciano LM, Cappuzzo F, Incarbone M, Roncalli M, Alloisio M, Santoro A, Camidge DR, Varella-Garcia M, Doebele RC. Identifying and targeting ROS1 gene fusions in non-small cell lung cancer. Clin Cancer Res. 2012;18:4570–9. doi: 10.1158/1078-0432.CCR-12-0550. [DOI] [PMC free article] [PubMed] [Google Scholar]
- 13.Downing JR. Targeted therapy in leukemia. Mod Pathol. 2008;21(2):S2–7. doi: 10.1038/modpathol.2008.13. [DOI] [PubMed] [Google Scholar]
- 14.Elias JM, Gown AM, Nakamura RM, Wilbur DC, Herman GE, Jaffe ES, Battifora H, Brigati DJ. Quality control in immunohistochemistry. Report of a workshop sponsored by the Biological Stain Commission. Am J Clin Pathol. 1989;92:836–43. doi: 10.1093/ajcp/92.6.836. [DOI] [PubMed] [Google Scholar]
- 15.Hintzsche J, Kim J, Yadav V, Amato C, Robinson SE, Seelenfreund E, Shellman Y, Wisell J, Applegate A, Mccarter M, Box N, Tentler J, De S, Robinson WA, Tan AC. IMPACT: a whole-exome sequencing analysis pipeline for integrating molecular profiles with actionable therapeutics in clinical samples. J Am Med Inform Assoc. 2016 doi: 10.1093/jamia/ocw022. [DOI] [PMC free article] [PubMed] [Google Scholar]
- 16.Hodis E, Watson IR, Kryukov GV, Arold ST, Imielinski M, Theurillat JP, Nickerson E, Auclair D, Li L, Place C, Dicara D, Ramos AH, Lawrence MS, Cibulskis K, Sivachenko A, Voet D, Saksena G, Stransky N, Onofrio RC, Winckler W, Ardlie K, Wagle N, Wargo J, Chong K, Morton DL, Stemke-Hale K, Chen G, Noble M, Meyerson M, Ladbury JE, Davies MA, Gershenwald JE, Wagner SN, Hoon DS, Schadendorf D, Lander ES, Gabriel SB, Getz G, Garraway LA, Chin L. A landscape of driver mutations in melanoma. Cell. 2012;150:251–63. doi: 10.1016/j.cell.2012.06.024. [DOI] [PMC free article] [PubMed] [Google Scholar]
- 17.Holderfield M, Deuker MM, Mccormick F, Mcmahon M. Targeting RAF kinases for cancer therapy: BRAF-mutated melanoma and beyond. Nat Rev Cancer. 2014;14:455–67. doi: 10.1038/nrc3760. [DOI] [PMC free article] [PubMed] [Google Scholar]
- 18.Hutchinson KE, Lipson D, Stephens PJ, Otto G, Lehmann BD, Lyle PL, Vnencak-Jones CL, Ross JS, Pietenpol JA, Sosman JA, Puzanov I, Miller VA, Pao W. BRAF fusions define a distinct molecular subset of melanomas with potential sensitivity to MEK inhibition. Clin Cancer Res. 2013;19:6696–702. doi: 10.1158/1078-0432.CCR-13-1746. [DOI] [PMC free article] [PubMed] [Google Scholar]
- 19.Krauthammer M, Kong Y, Bacchiocchi A, Evans P, Pornputtapong N, Wu C, Mccusker JP, Ma S, Cheng E, Straub R, Serin M, Bosenberg M, Ariyan S, Narayan D, Sznol M, Kluger HM, Mane S, Schlessinger J, Lifton RP, Halaban R. Exome sequencing identifies recurrent mutations in NF1 and rasopathy genes in sun-exposed melanomas. Nat Genet. 2015;47:996–1002. doi: 10.1038/ng.3361. [DOI] [PMC free article] [PubMed] [Google Scholar]
- 20.Lambros MB, Wilkerson PM, Natrajan R, Patani N, Pawar V, Vatcheva R, Mansour M, Laschet M, Oelze B, Orr N, Muller S, Reis-Filho JS. High-throughput detection of fusion genes in cancer using the Sequenom massarray platform. Lab Invest. 2011;91:1491–501. doi: 10.1038/labinvest.2011.110. [DOI] [PubMed] [Google Scholar]
- 21.Lee JH, Choi JW, Kim YS. Frequencies of BRAF and NRAS mutations are different in histological types and sites of origin of cutaneous melanoma: a meta-analysis. Br J Dermatol. 2011;164:776–84. doi: 10.1111/j.1365-2133.2010.10185.x. [DOI] [PubMed] [Google Scholar]
- 22.Leung AM, Hari DM, Morton DL. Surgery for distant melanoma metastasis. Cancer J. 2012;18:176–84. doi: 10.1097/PPO.0b013e31824bc981. [DOI] [PMC free article] [PubMed] [Google Scholar]
- 23.Mcarthur GA, Chapman PB, Robert C, Larkin J, Haanen JB, Dummer R, Ribas A, Hogg D, Hamid O, Ascierto PA, Garbe C, Testori A, Maio M, Lorigan P, Lebbe C, Jouary T, Schadendorf D, O'day SJ, Kirkwood JM, Eggermont AM, Dreno B, Sosman JA, Flaherty KT, Yin M, Caro I, Cheng S, Trunzer K, Hauschild A. Safety and efficacy of vemurafenib in BRAF(V600E) and BRAF(V600K) mutation-positive melanoma (BRIM-3): extended follow-up of a phase 3, randomised, open-label study. Lancet Oncol. 2014;15:323–32. doi: 10.1016/S1470-2045(14)70012-9. [DOI] [PMC free article] [PubMed] [Google Scholar]
- 24.Menzies AM, Haydu LE, Visintin L, Carlino MS, Howle JR, Thompson JF, Kefford RF, Scolyer RA, Long GV. Distinguishing clinicopathologic features of patients with V600E and V600K BRAF-mutant metastatic melanoma. Clin Cancer Res. 2012;18:3242–9. doi: 10.1158/1078-0432.CCR-12-0052. [DOI] [PubMed] [Google Scholar]
- 25.Menzies AM, Yeh I, Botton T, Bastian BC, Scolyer RA, Long GV. Clinical activity of the MEK inhibitor trametinib in metastatic melanoma containing BRAF kinase fusion. Pigment Cell Melanoma Res. 2015;28:607–10. doi: 10.1111/pcmr.12388. [DOI] [PMC free article] [PubMed] [Google Scholar]
- 26.Narita N, Tanemura A, Murali R, Scolyer RA, Huang S, Arigami T, Yanagita S, Chong KK, Thompson JF, Morton DL, Hoon DS. Functional RET G691S polymorphism in cutaneous malignant melanoma. Oncogene. 2009;28:3058–68. doi: 10.1038/onc.2009.164. [DOI] [PMC free article] [PubMed] [Google Scholar]
- 27.Niu HT, Zhou QM, Wang F, Shao Q, Guan YX, Wen XZ, Chen LZ, Feng QS, Li W, Zeng YX, Zhang XS. Identification of anaplastic lymphoma kinase break points and oncogenic mutation profiles in acral/mucosal melanomas. Pigment Cell Melanoma Res. 2013;26:646–53. doi: 10.1111/pcmr.12129. [DOI] [PubMed] [Google Scholar]
- 28.Palanisamy N, Ateeq B, Kalyana-Sundaram S, Pflueger D, Ramnarayanan K, Shankar S, Han B, Cao Q, Cao X, Suleman K, Kumar-Sinha C, Dhanasekaran SM, Chen YB, Esgueva R, Banerjee S, Lafargue CJ, Siddiqui J, Demichelis F, Moeller P, Bismar TA, Kuefer R, Fullen DR, Johnson TM, Greenson JK, Giordano TJ, Tan P, Tomlins SA, Varambally S, Rubin MA, Maher CA, Chinnaiyan AM. Rearrangements of the RAF kinase pathway in prostate cancer, gastric cancer and melanoma. Nat Med. 2010;16:793–8. doi: 10.1038/nm.2166. [DOI] [PMC free article] [PubMed] [Google Scholar]
- 29.Pane AR, Hirst LW. Ultraviolet light exposure as a risk factor for ocular melanoma in Queensland, Australia. Ophthalmic Epidemiol. 2000;7:159–67. [PubMed] [Google Scholar]
- 30.Phan A, Touzet S, Dalle S, Ronger-Savle S, Balme B, Thomas L. Acral lentiginous melanoma: histopathological prognostic features of 121 cases. Br J Dermatol. 2007;157:311–8. doi: 10.1111/j.1365-2133.2007.08031.x. [DOI] [PubMed] [Google Scholar]
- 31.Ross JS, Wang K, Chmielecki J, Gay L, Johnson A, Chudnovsky J, Yelensky R, Lipson D, Ali SM, Elvin JA, Vergilio JA, Roels S, Miller VA, Nakamura BN, Gray A, Wong MK, Stephens PJ. The distribution of BRAF gene fusions in solid tumors and response to targeted therapy. Int J Cancer. 2015 doi: 10.1002/ijc.29825. [DOI] [PMC free article] [PubMed] [Google Scholar]
- 32.Sasaki Y, Niu C, Makino R, Kudo C, Sun C, Watanabe H, Matsunaga J, Takahashi K, Tagami H, Aiba S, Horii A. BRAF point mutations in primary melanoma show different prevalences by subtype. J Invest Dermatol. 2004;123:177–83. doi: 10.1111/j.0022-202X.2004.22722.x. [DOI] [PubMed] [Google Scholar]
- 33.Scolnick JA, Dimon M, Wang IC, Huelga SC, Amorese DA. An Efficient Method for Identifying Gene Fusions by Targeted RNA Sequencing from Fresh Frozen and FFPE Samples. Plos One. 2015;10:e0128916. doi: 10.1371/journal.pone.0128916. [DOI] [PMC free article] [PubMed] [Google Scholar]
- 34.Shain AH, Bastian BC. From melanocytes to melanomas. Nat Rev Cancer. 2016;16:345–58. doi: 10.1038/nrc.2016.37. [DOI] [PubMed] [Google Scholar]
- 35.Shaw AT, Engelman JA. Ceritinib in ALK-rearranged non-small-cell lung cancer. N Engl J Med. 2014;370:2537–9. doi: 10.1056/NEJMc1404894. [DOI] [PubMed] [Google Scholar]
- 36.Shaw AT, Kim DW, Nakagawa K, Seto T, Crino L, Ahn MJ, De Pas T, Besse B, Solomon BJ, Blackhall F, Wu YL, Thomas M, O'byrne KJ, Moro-Sibilot D, Camidge DR, Mok T, Hirsh V, Riely GJ, Iyer S, Tassell V, Polli A, Wilner KD, Janne PA. Crizotinib versus chemotherapy in advanced ALK-positive lung cancer. N Engl J Med. 2013;368:2385–94. doi: 10.1056/NEJMoa1214886. [DOI] [PubMed] [Google Scholar]
- 37.Shaw AT, Ou SH, Bang YJ, Camidge DR, Solomon BJ, Salgia R, Riely GJ, Varella-Garcia M, Shapiro GI, Costa DB, Doebele RC, Le LP, Zheng Z, Tan W, Stephenson P, Shreeve SM, Tye LM, Christensen JG, Wilner KD, Clark JW, Iafrate AJ. Crizotinib in ROS1-rearranged non-small-cell lung cancer. N Engl J Med. 2014;371:1963–71. doi: 10.1056/NEJMoa1406766. [DOI] [PMC free article] [PubMed] [Google Scholar]
- 38.Singh AD, Turell ME, Topham AK. Uveal melanoma: trends in incidence, treatment, and survival. Ophthalmology. 2011;118:1881–5. doi: 10.1016/j.ophtha.2011.01.040. [DOI] [PubMed] [Google Scholar]
- 39.Stransky N, Cerami E, Schalm S, Kim JL, Lengauer C. The landscape of kinase fusions in cancer. Nat Commun. 2014;5:4846. doi: 10.1038/ncomms5846. [DOI] [PMC free article] [PubMed] [Google Scholar]
- 40.Sullivan HC, Fisher KE, Hoffa AL, Wang J, Saxe D, Siddiqui MT, Cohen C. The role of immunohistochemical analysis in the evaluation of EML4-ALK gene rearrangement in lung cancer. Appl Immunohistochem Mol Morphol. 2015;23:239–44. doi: 10.1097/PAI.0000000000000088. [DOI] [PubMed] [Google Scholar]
- 41.Toschi L, Finocchiaro G, Nguyen TT, Skokan MC, Giordano L, Gianoncelli L, Perrino M, Siracusano L, Di Tommaso L, Infante M, Alloisio M, Roncalli M, Scorsetti M, Janne PA, Santoro A, Varella-Garcia M. Increased SOX2 gene copy number is associated with FGFR1 and PIK3CA gene gain in non-small cell lung cancer and predicts improved survival in early stage disease. Plos One. 2014;9:e95303. doi: 10.1371/journal.pone.0095303. [DOI] [PMC free article] [PubMed] [Google Scholar]
- 42.Vaishnavi A, Capelletti M, Le AT, Kako S, Butaney M, Ercan D, Mahale S, Davies KD, Aisner DL, Pilling AB, Berge EM, Kim J, Sasaki H, Park SI, Kryukov G, Garraway LA, Hammerman PS, Haas J, Andrews SW, Lipson D, Stephens PJ, Miller VA, Varella-Garcia M, Janne PA, Doebele RC. Oncogenic and drug-sensitive NTRK1 rearrangements in lung cancer. Nat Med. 2013;19:1469–72. doi: 10.1038/nm.3352. [DOI] [PMC free article] [PubMed] [Google Scholar]
- 43.Whiteman DC, Stickley M, Watt P, Hughes MC, Davis MB, Green AC. Anatomic site, sun exposure, and risk of cutaneous melanoma. J Clin Oncol. 2006;24:3172–7. doi: 10.1200/JCO.2006.06.1325. [DOI] [PubMed] [Google Scholar]
- 44.Wiesner T, He J, Yelensky R, Esteve-Puig R, Botton T, Yeh I, Lipson D, Otto G, Brennan K, Murali R, Garrido M, Miller VA, Ross JS, Berger MF, Sparatta A, Palmedo G, Cerroni L, Busam KJ, Kutzner H, Cronin MT, Stephens PJ, Bastian BC. Kinase fusions are frequent in Spitz tumours and spitzoid melanomas. Nat Commun. 2014;5:3116. doi: 10.1038/ncomms4116. [DOI] [PMC free article] [PubMed] [Google Scholar]
- 45.Xia J, Jia P, Hutchinson KE, Dahlman KB, Johnson D, Sosman J, Pao W, Zhao Z. A meta-analysis of somatic mutations from next generation sequencing of 241 melanomas: a road map for the study of genes with potential clinical relevance. Mol Cancer Ther. 2014;13:1918–28. doi: 10.1158/1535-7163.MCT-13-0804. [DOI] [PMC free article] [PubMed] [Google Scholar]
- 46.Yamazaki N, Tanaka R, Tsutsumida A, Namikawa K, Eguchi H, Omata W, Oashi K, Ogawa T, Hayashi A, Nakamura N, Tsuta K. BRAF V600 mutations and pathological features in Japanese melanoma patients. Melanoma Res. 2015;25:9–14. doi: 10.1097/CMR.0000000000000091. [DOI] [PMC free article] [PubMed] [Google Scholar]
- 47.Yeh I, Botton T, Talevich E, Shain AH, Sparatta AJ, De La Fouchardiere A, Mully TW, North JP, Garrido MC, Gagnon A, Vemula SS, Mccalmont TH, Leboit PE, Bastian BC. Activating MET kinase rearrangements in melanoma and Spitz tumours. Nat Commun. 2015;6:7174. doi: 10.1038/ncomms8174. [DOI] [PMC free article] [PubMed] [Google Scholar]
- 48.Ying J, Guo L, Qiu T, Shan L, Ling Y, Liu X, Lu N. Diagnostic value of a novel fully automated immunochemistry assay for detection of ALK rearrangement in primary lung adenocarcinoma. Ann Oncol. 2013;24:2589–93. doi: 10.1093/annonc/mdt295. [DOI] [PubMed] [Google Scholar]
- 49.Zhang FX, Lai CH, Tse YC, Shum DK, Chan YS. Expression of Trk receptors in otolith-related neurons in the vestibular nucleus of rats. Brain Res. 2005;1062:92–100. doi: 10.1016/j.brainres.2005.09.025. [DOI] [PubMed] [Google Scholar]
Associated Data
This section collects any data citations, data availability statements, or supplementary materials included in this article.