Abstract
Thrombelastography (TEG)/thromboelastometry (ROTEM) devices measure viscoelastic clot strength as clot amplitude (A). Transformation of clot amplitude into clot elasticity (E with TEG; CE with ROTEM) is sometimes necessary (eg, when calculating platelet component of the clot). With TEG, clot amplitude is commonly transformed into shear modulus (G; expressed in Pa or dyn/cm2) as follows: G = (5000 × A)/(100 – A). Use of the constant “5000” stems from Hartert's 50-year-old calculation of G for a normal blood clot. We question the value of calculating G as follows: (1) It may be questioned whether TEG/ROTEM analysis enable measurement of elasticity because viscosity may also contribute to clot amplitude. (2) It has been suggested that absolute properties of a blood clot cannot be measured with TEG/ROTEM analysis because the strain amplitude applied by the device is uncontrolled and changes during the course of coagulation. (3) A review of the calculation of G using Hartert's methods and some updated assumptions suggests that the value of 5000 is unreliable. (4) Recalculation of G for the ROTEM device yields a different value from that with Hartert TEG, indicating a degree of inaccuracy with the calculations. (5) Shear modulus is simply a multiple of E/CE and, because of the unreliability of G in absolute terms, it provides no additional value versus E/CE. The TEG and ROTEM are valuable coagulation assessment tools that provide an evaluation of the viscoelastic properties of a clot, not through measuring absolute viscoelastic forces but through continuous reading of the clot amplitude relative to an arbitrary, preset scale.
Keywords: bleeding, hemostasis, in vitro diagnostic systems
Introduction
Adequate clot strength is fundamental to achieving hemostasis in a bleeding patient. Blood clots need to withstand a wide range of shear stress, from 0.1 Pa in the venous system to 7 Pa in the arterial system.1 In common with many biological materials, blood clots possess both viscosity and elasticity, meaning that they are described as viscoelastic. Viscoelasticity is measured using dynamic mechanical analysis—application of a small oscillatory stress, with measurement of the resulting strain (ie, the degree to which the material deforms). Important parameters in the study of viscoelasticity include shear storage modulus (G’), shear loss modulus (G’’), shear complex dynamic modulus (G*, defined as G’ + iG’’), and phase lag between applied stress and measured strain (δ; Table 1). Note that in physics, epsilon (∊) denotes strain, which is different from the ∊ used by Hartert and Schaeder to represent shear modulus during work on the original thrombelastograph device.2 A variety of terms, including “elastic shear modulus,” have been used in the literature when referring to shear modulus in relation to thrombelastography (TEG; Haemonetics Corp, Braintree, Massachusetts) or thromboelastometry (ROTEM; Tem International GmbH, Munich, Germany).3,4 The TEG user manual (Haemonetics Corp, Braintree, Massachusetts) refers to the “shear elastic modulus strength [G]” of the clot.5 However, “shear modulus” is the correct term. For complete characterization of a material’s viscoelastic properties, all of the above shear-related parameters would be measured, and similar assessments would be made with the material under tension (eg, tensile complex dynamic modulus, E) and again with the material under compression. Neither thrombelastography nor thromboelastometry provide this range of measurements.
Table 1.
Glossary of Terms Relating to Viscoelasticity.
| Term | Definition/explanation |
|---|---|
| Elastic/elasticity | Tendency of a solid material to return to its original shape after being deformed. A material’s elasticity is described by a stress–strain curve |
| Elastic modulus (λ) | Defined as stress divided by strain—number that describes the resistance of a material to being deformed elastically. There are several types of elastic modulus, relating to the application of different forces (eg, shear modulus [G or µ], Young modulus [E]). Young modulus, which relates to tensile or compressive stress (ie, opposing forces along one axis), is sometimes referred to as “elastic modulus.” |
| Hysteresis | Difference between stress–strain curves as a material is being unloaded versus loaded. Consider an elastic band being first loaded then unloaded: during unloading, a given force produces a slightly longer length compared to that observed while the elastic band was being loaded. The effect becomes more pronounced if loading and unloading are done rapidly |
| Linear viscoelasticity | Rate of change in strain (strain rate) increases linearly with stress |
| Phase lag (δ) | Extent to which strain lags behind stress when the stress is oscillatory. Viscoelastic materials have a phase lag between 0° (value for a purely elastic material; stress and strain in phase) and 90° (purely viscous material). |
| Shear | Application of a force with direction perpendicular to the cross section of a material (eg, material with square cross section: bottom held in place, force applied to the top from left to right) |
| Shear complex dynamic modulus (G*) | Complex dynamic modulus represents the ratio of stress to strain under vibratory conditions. It is calculated from the storage modulus and the loss modulus as follows: G* = G’ + iG’’, where G’ is the shear storage modulus, G’’ is the shear loss modulus and i is the imaginary unit (square root of −1). As well as shear, it can be measured for tension (tensile complex dynamic modulus) or compression. |
| Shear loss modulus (G’’) | A measure of the deformation energy used up by the sample during the shear process. This parameter represents the viscous behavior of the material. As well as shear, it can be measured for tension (tensile loss modulus) or compression |
| Shear modulus/modulus of rigidity (G or µ; denoted by Hartert as ∊) | Defined as shear stress divided by shear strain. It is a type of elastic modulus, specifically for shear stress |
| Shear storage modulus (G’) | A measure of the deformation energy stored by a material during the shear process. This parameter represents the elastic behaviour of the material. As well as shear, it can be measured for tension (tensile storage modulus) or compression |
| Strain (∊) | A measure of the extent to which a material deforms when under stress. Measured as a ratio of the measurement under stress to the measurement at baseline. |
| Stress (σ) | Force per unit area—to study the properties of a material, a force is applied and the extent to which the material deforms is measured |
| Stress–strain curve | Graph showing relationship between stress and strain |
| Tensile | Relating to tension or the application of opposing forces along an axis. The act of stretching an elastic band in a straight line would involve the application of tensile stress |
| Viscoelasticity | Term used to describe materials possessing both elasticity and viscosity. When a stress is applied to a viscoelastic material, molecular rearrangement known as creep occurs. However, when the stress is removed “back stresses” within the material cause it to return to its original form |
| Viscous/viscosity | A measure of resistance to gradual deformation by shear stress or tensile stress. Corresponds to the “thickness” of a fluid—water has low viscosity and honey has higher viscosity |
| Young’s modulus (E) | Defined as tensile stress divided by tensile strain—similar to elastic modulus but specifically for tensile stress |
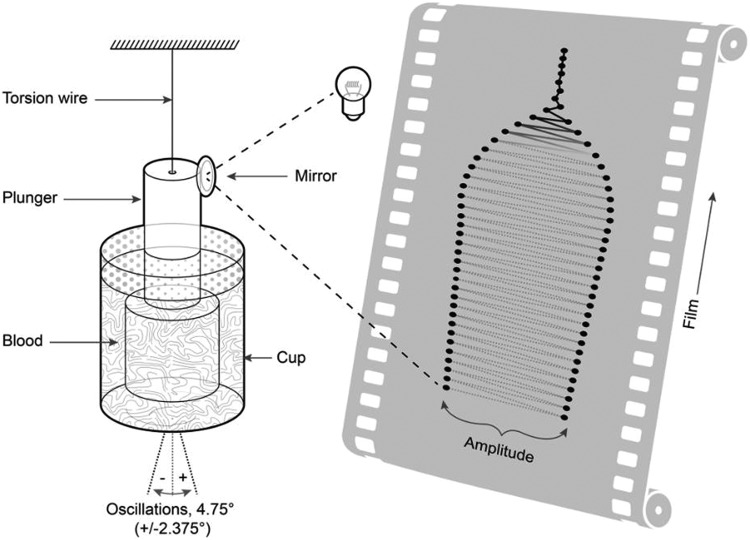
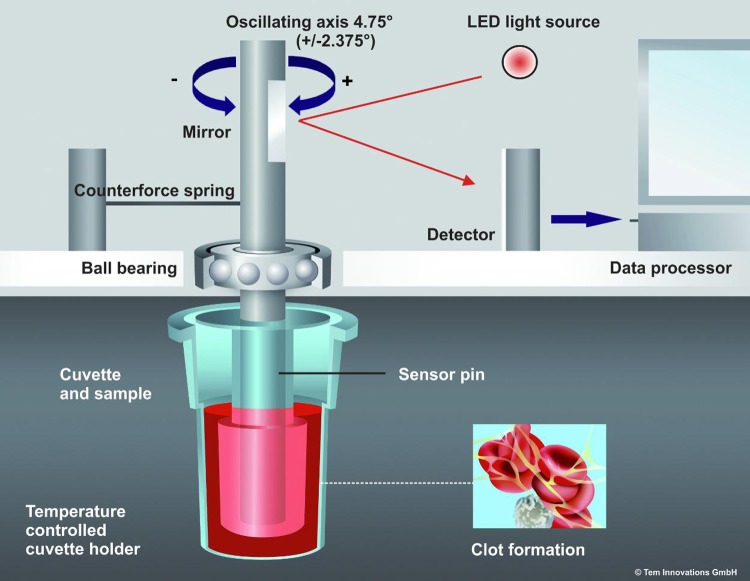
Viscoelastic monitoring, using either TEG or ROTEM is an established method for assessing a patient’s coagulation status: A sample of blood or plasma is placed in a cup (sometimes referred to as the “cuvette”) and coagulation is activated. With TEG, the cup rotates backward and forward in the same way as Hartert’s TEG device (H-TEG; Figure 1). As coagulation progresses, the blood exerts an increasing rotational force on the plunger (sometimes referred to as the “pin”). With ROTEM, the plunger oscillates while the cup remains stationary, and the plunger encounters increasing resistance as coagulation progresses (Figure 2). With both devices, viscoelastic clot strength is measured as amplitude in mm, on a scale usually running from 0 to 100. Zero represents no or negligible resistance (eg, water) and 100 represents infinite resistance (ie, TEG device: movement of plunger and cup identical; ROTEM device: no movement of the plunger). During early development of the H-TEG device, it was proposed that clot amplitude (s) can be transformed into shear modulus (G [arbitrary units]) using the formula G = (100s)/(100 − s).2 It is now conventional to use the term A instead of s to represent clot amplitude, with maximum amplitude and maximum clot firmness (MCF) as terms for maximum values observed with TEG and ROTEM, respectively.
Figure 1.
Hartert’s thrombelastograph device (H-TEG). The cylindrical container (cup) is rotated through a total angle of 4.75° around the vertical axis. Light from a slit lamp is reflected onto photographic film that moves at a rate of 2 mm/min to record rotation of the rod (the film roll is 15 m long and 100 mm wide). In practice, lines between the dots on the film are not visible because the intensity of the light and photosensitivity of the film are configured so that the film is blackened only when the light is stationary, that is, at the point of maximum rotation of the cup when there is a 1-second pause in the oscillatory movement. Adapted from Hartert.6
Figure 2.
Mechanics of the thromboelastometry (ROTEM) device (reproduced with permission from Tem Innovations). The plunger is rotated around the vertical axis, and the amount of rotation (which reduces as coagulation progresses) is recorded via reflected light-emitting diode (LED) light.
It is generally believed that clot amplitude can be transformed into clot elasticity (CE with ROTEM; E with TEG), using the formula CE (or E) = (100 × A)/(100 − A).5,7 This belief may be questioned on the basis that liquid blood as well as blood clots possess both viscosity and elasticity. Hartert asserted that the contribution of viscosity to clot amplitude is negligible,6 and on this basis, the transformation of clot amplitude into a measurement of clot elasticity could be valid. However, it has been suggested that both viscosity and elasticity contribute to clot amplitude.8–10 Since TEG/ROTEM analysis does not enable determination of the relative contributions of viscosity and elasticity to amplitude, it could be argued that measurement of elasticity is not strictly possible with TEG/ROTEM analysis. It has also been argued that absolute properties of blood clots cannot be measured accurately with TEG/ROTEM because the strain amplitude applied by the device is uncontrolled and changes during the course of coagulation.8,10 The potential of the device to affect the properties of the clot was highlighted some time ago in a study by Burghardt et al.11 In measurements performed using whole blood, the oscillating motion of the TEG device was shown to produce a considerably weaker clot than the equivalent one formed without such movement (amplitude 46.6 mm under normal TEG conditions vs 71.1 mm under quiescent conditions).
With TEG, it is proposed that clot amplitude can be transformed into shear modulus (G) using the formula G = (5000 × A)/(100 − A).5,12 The term “shear elastic modulus strength” is sometimes used instead of G to describe this parameter in the context of TEG analysis.13,14 When performing ROTEM analysis, G is calculated in the same way as with TEG and provided as one of the output parameters. However, it is used much less commonly with ROTEM than with TEG. The CE or E is a “relative” measure of clot elasticity, expressed without units (ie, dimensionless). For maximum values, the terms maximum clot elasticity (MCE) and E at maximum amplitude are used with ROTEM and TEG, respectively. With ROTEM, CE/MCE is used more commonly as a measurement of clot elasticity than G. Transformation of clot amplitude into clot elasticity is necessary for some assessments, such as when calculating platelets’ contribution to clot strength (eg, CEplatelets = CEEXTEM – CEFIBTEM).15
Unlike CE or E, G is a physical property referring to the rigidity of the clot (ratio of shear stress to shear strain; Table 1). It is expressed in Pascals (the SI unit of pressure) or alternatively in dynes per square centimeter (an old unit used before the SI system was established). As a result, calculation of G from clot amplitude requires knowledge of the physical properties of the device including the forces involved when a particular amplitude is observed. In 1962, Hartert and Schaeder calculated the value of G for a normal platelet-rich plasma clot to be 5000 dyn/cm2, based on a clot amplitude of 50 mm.2
We examined the validity of the formula G = (5000 × A)/(100 − A) by undertaking a series of steps as follows. First, we examined the assumptions and apparatus on which the early calculation was based. Second, using a similar overall approach as Hartert and Schaeder, we recalculated G using some revised assumptions. Third, we attempted a new calculation of G based on today’s ROTEM apparatus.
Step 1: Examination of Hartert’s Calculation of G
Use of the value 5000 in the formula G = (5000 × A)/(100 − A) stems from the early calculation by Hartert and Schaeder.2 The H-TEG apparatus used by Hartert and Schaeder is shown in Figure 1—the cup is rotated around its vertical axis, and rotational movement of the plunger is recorded. The H-TEG cup and plunger were made from unwettable type V2A polished steel.16 The calculation of shear modulus was based on a set of assumptions as follows:
The blood clot mass is exactly described by a hollow cylinder.
Either no part of the blood clot is in contact with the underside of the plunger or the bottom of the container or the clot can slip freely if in contact with the base of the container.
The shearing action is assumed to deform linearly, with no boundary effect.
Blood clot volume is constant as described by the dimensions of the hollow cylinder.
The deflection distance is assumed to represent an arc length and not a linear distance on a flat surface. The validity of this assumption can only be checked against the experimental setup.
The calculation of the shear modulus is based upon a flat representation of the sheared clot with sizes given by the inner cylinder.
Was the original calculation of 5000 correct?
The definition of shear modulus for a material is the shear stress divided by the shear strain:
where F is the force applied, l is the height, A is the area, and Δx is the distance the top surface moves in response to the force applied as shown in Figure 3.
Figure 3.
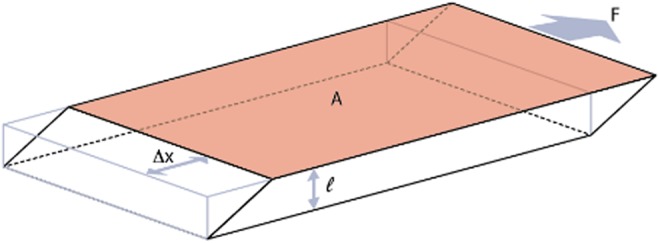
Shear modulus. For calculation of shear modulus, a shearing force is applied and deformation Δx is measured. Shear modulus can then be calculated using the following equation:
Using this formula and the assumptions and values provided within the Hartert and Schaeder publication,2 we calculated the shear modulus to be 5012 dyn/cm2 (see Supplementary File 1). Therefore, on first inspection, it appears that the value 5000 dyn/cm2 is approximately correct.
Are the underlying assumptions correct?
Logical consideration suggests at least two of the underlying assumptions of Hartert and Schaeder should be questioned:2
Either no part of the blood clot is in contact with the underside of the plunger or the bottom of the container or the clot can slip freely if in contact with the base of the container
Blood clot volume is constant as described by the dimensions of the hollow cylinder.
The reason for challenging these assumptions is that the entire system should be included for the calculation of shear modulus to be rigorous.
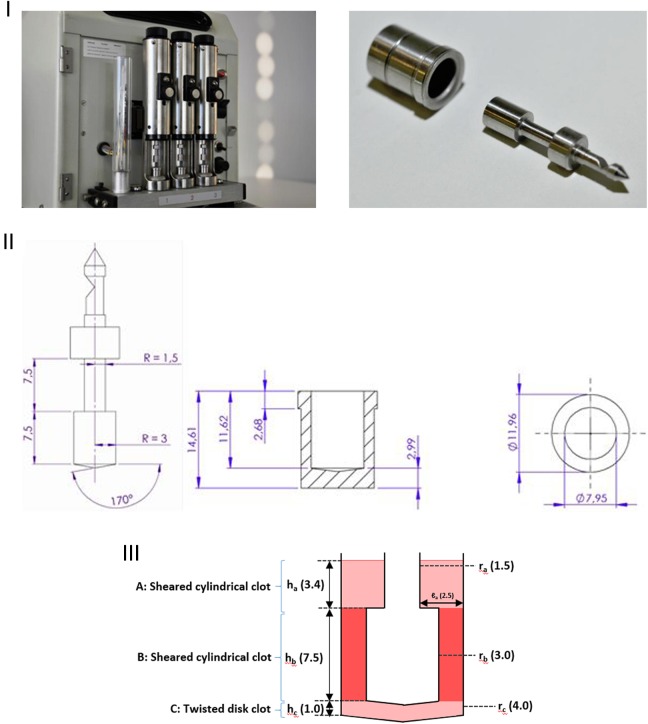
Figure 4 (III) shows the geometry of the H-TEG apparatus; clots A and C as well as clot B contribute to the torque measured from the plunger. Based on the Hartert and Schaeder publication, the following values may be deduced: lb = 0.1 cm, rb = 0.3 cm, and hb = 0.75 cm. Using these measurements, the volume for the hollow cylinder of clot B (Figure 4[III]) is 0.165 cm3. However, the total volume including the upper and lower parts of the cup was reported by Hartert and Schaeder as 0.36 cm3, meaning that less than half of the overall blood volume is included when using the assumptions of Hartert and Schaeder.
Figure 4.
Thrombelastograph used by Hartert (H-TEG) to investigate the shear modulus of a blood clot. Photographs of the device (I; not previously published, kindly provided by Dr Heinz Engel). Technical drawings of the device (II; not previously published, kindly provided by Tem Innovations). Diagram showing the basis for calculating G (III), with total fluid volume 360 µL. Part B (darker shading) represents the only portion considered by Hartert and Schaeder2 in their calculation of G (parts A and C were omitted). H-TEG device shown in the photographs: manufactured by Fritz Hellige & Co, GmbH, Division of Litton Industries, Freiburg im Breisgau; made in West Germany; cat. no. 104009 01; ser. no. 3790.
Step 2: Recalculation of G Using Revised Assumptions
For the calculation of the total force (torque) on the plunger, approximate forces from clots A, B, and C (Figure 4[III]) are added as shown in the following equation:
Within this equation, geometric terms are those shown in Figure 4, τ is the stiffness of the torsional wire (a spring constant), while α describes the angle of rotation of the plunger (θ) relative to that of the cup (θ’): αθ = θ’. Dimensions for clot A, not provided in the Hartert and Schaeder publication, were based on measurements of the H-TEG apparatus: ra = 0.15 cm and ℓa = 0.25 cm and ha could then be calculated as 0.34 cm. For expediency, the bottom of the cup was considered as a flat surface as opposed to the conical shape shown in Figure 4. Also, height hc was not provided in the Hartert and Schaeder publication, meaning that it had to be estimated as 0.1 cm from a drawing in the original publication.
Using the above-mentioned equation, G can be estimated as follows:
In addition to the values above the dimensions in the equation, we know from the Hartert and Schaeder publication that α = 2 (derived from observation [Figure 5]) and τ = 6377 dyn cm (stiffness of the torsional wire, documented in the Hartert and Schaeder publication).2 (Note: Torsional wire is 20 mm long and 0.2 mm in diameter).16 Using these values, G is calculated as 4466 dyn/cm2, a value that is approximately 11% below that reported by Hartert and Schaeder. Supplementary File 1 provides further details of the calculations.
Figure 5.
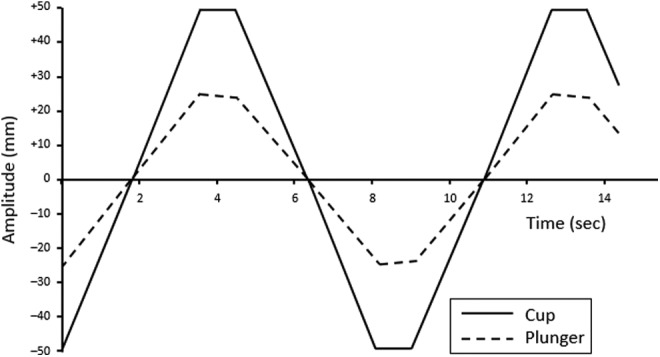
Schematic representation of the oscillatory, rotational movement of the cup and plunger after full formation of a normal blood clot (ie, once maximum clot strength has been reached). Reprinted with permission from Hartert and Schaeder.2
Step 3: New Calculation of G Based on Today’s ROTEM Apparatus
We adapted the above-mentioned method for calculating shear modulus to today’s ROTEM device. Unlike H-TEG, with ROTEM it is only the plunger that rotates (oscillating movement), and the device mechanics are illustrated in Figure 2 (see also Supplementary File 2). As the clot forms, the plunger encounters resistance and the angle of each oscillation is reduced. The mathematical approach was adjusted to account for this difference.
The following information was obtained from Tem International, the manufacturer of ROTEM: geometry of the cup and plunger, volume of fluid introduced into the cup (320 µL), and the spring constant for calculation of the force involved when a specific clot amplitude is observed. For comparison with the calculation of G by Hartert and Schaeder,2 the non-activated rotational thromboelastometry assay (NATEM) provides the nearest to an equivalent ROTEM test. A value of 50 mm has been reported for NATEM MCF among healthy adults.17
The geometry of the ROTEM apparatus is more complicated than that of the H-TEG (Figure 6). To calculate the total torque, 4 sections of clot were considered: A1, above the shoulder of the vessel; A2, below the shoulder of the vessel but above the main portion of the plunger; B, around the main portion of the plunge; and C, below the plunger (Figure 6[II]). Integration was used as required to account for tapering cross sections. Application of the dimensions shown in Figure 6(II), together with a plunger rotation angle of θ, yielded the following equation for the total force (torque) on the plunger (see Supplementary File 3):
Figure 6.
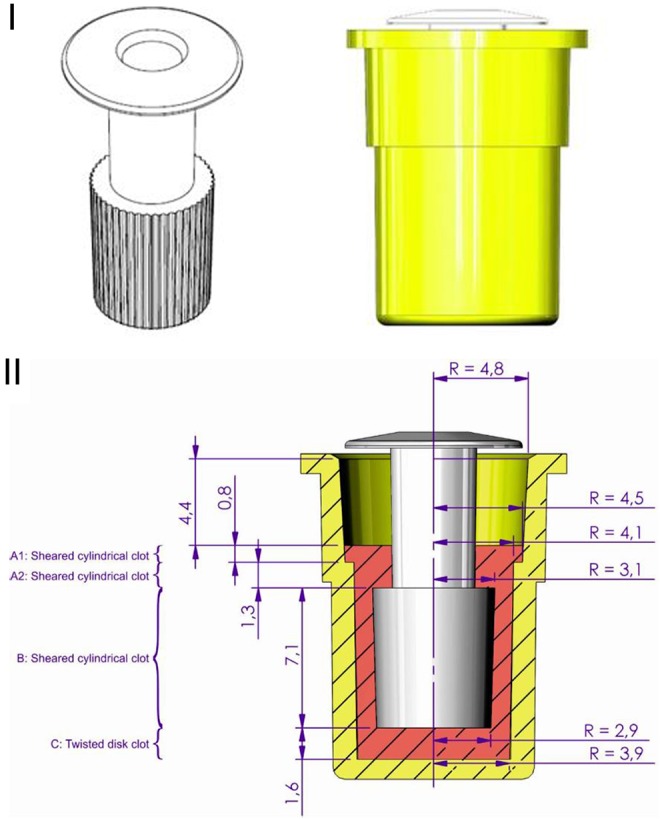
Geometry of the cup and plunger with the thromboelastometry (ROTEM) apparatus. The manufacturer’s schematics (I) and a diagram showing the basis for calculating G (II), with total fluid volume 320 µL. Reproduced with permission from Tem International.
Thus:
Based on experiments to determine the spring constant of the ROTEM device, (see Supplementary File 4). The maximum total rotation with ROTEM is 0.0829 radians (see Supplementary File 4), and θ may be written in terms of amplitude (mm):
This enabled G to be calculated for the NATEM blood clot as follows:
Observational experiments with ROTEM
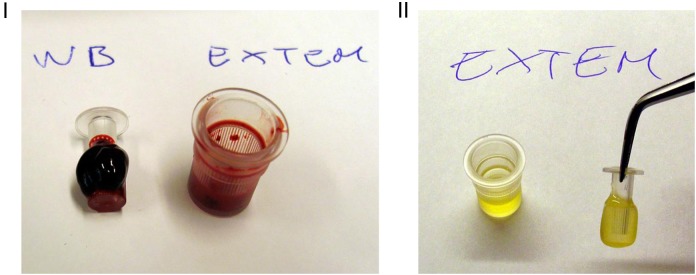
We performed experiments using the ROTEM device to explore the principle that the clot below the plunger (clot C in Figure 4[III]) affects clot amplitude. Blood samples for these experiments were provided by Christoph Schlimp, and the local ethics committee waived the need for formal approval because the researcher was exclusively using his own blood for the experiments. With whole blood and the extrinsically activated EXTEM assay (total cup volume 340 µL), mean MCF (9 observations) was 61.4 mm. Visual inspection of the clots formed from the EXTEM assay confirmed clot formation above as well as below the shoulder of the plunger (Figure 7). This confirms the need to include clot sections A1 and A2 in the calculation of G (Figure 6[II]).
Figure 7.
Clot formation in the extrinsically activated ROTEM assay (EXTEM). The clots formed from whole blood (I) and platelet-rich plasma (II) are shown. In both cases, clot is formed above as well as below the shoulder of the plunger. In addition, a proportion of the blood/plasma remains as liquid (residual fluid in the cup). Photographs (not previously published) kindly provided by Christoph Schlimp.
Applying the formulae mentioned earlier, G was calculated as 6812 dyn/cm2. Human albumin has the potential to block the binding of clot to the surface of the cup: performance of the EXTEM whole-blood assay after coating the whole cup with human albumin yielded a mean MCF of 4.6 mm (5 observations), indicating a high degree of inhibition of clot binding. The assay was then repeated with the bottom of the cup and the bottom of the plunger coated with human albumin, the intention being to prevent clot binding to these surfaces alone. The resulting MCF (mean of 9 observations) was 60.0 mm. The 1.4 mm reduction in MCF provides proof that clot C affects the overall force that the clot exerts on the plunger and therefore affects the calculation of G. The mathematical formulae were adjusted so that the term for clot C was removed and, based on the MCF of 60.0 mm, G was then calculated as 6916 dyn/cm2. The difference between this value for G and that obtained without human albumin suggests that the albumin was not 100% effective in preventing the clot from exerting a force on the bottom of the plunger.
Interpretation of the New Calculations
Our calculations have yielded 2 new values for the shear modulus of a normal blood clot, 4466 dyn/cm2 (H-TEG device) and 5289 dyn/cm2 (ROTEM device). Although our calculations may represent improved accuracy versus Hartert and Schaeder’s calculation of 5000 dyn/cm2, neither of the new values can be considered as definitive. Also, it would be valuable to extend our work to include the widely used TEG 5000 device.
The existence of a difference between the H-TEG and ROTEM values indicates a degree of inaccuracy with the calculations, although a lack of comparability between the samples upon which the normal values are based, or a lack of comparability between the conditions under which the ROTEM and H-TEG clots were formed is possible. The accuracy of our calculation methods is worthy of consideration. It was previously observed that “end effects associated with the gap between the bottom of the plunger and the cup are difficult to characterize precisely,”11 (p. 624) and the accuracy of our calculation for that portion of the clot with both H-TEG and ROTEM apparatus is open to question. In addition, we assumed that all of the fluid in the cup transforms into a clot so that there is then no residual liquid. It may be questioned whether this would be appropriate for definitive calculation of shear modulus (Figure 7).
Neither the apparatus nor the mathematics presented here reflect current methods typically used in materials science to investigate a material’s viscoelastic properties. Definitive calculations would be based on up-to-date methods such as a shear-wave approach; recent studies of blood clot properties have involved methods such as supersonic shear-wave imaging and shear-wave dispersion ultrasound vibrometry.18–20 Such methods enable separate measurement of viscosity and elasticity as well as distinction between shear storage modulus and shear loss modulus. The accuracy with which absolute viscoelastic parameters can be measured with today’s thrombelastography and thromboelastometry devices could be investigated by comparing results obtained with TEG/ROTEM with those from up-to-date rheological methods, using a range of different blood samples.
Despite these considerations, our calculations are valuable in showing that the value of 5000 dyn/cm2 reported by Hartert and Schaeder as the shear modulus of a normal blood clot is unreliable. The fact that we calculated a value of 4466 dyn/cm2 when considering the same H-TEG device may be attributable to the inclusion of less than half of the overall blood volume when Hartert calculated the value 5000 dyn/cm2. On this basis, the accuracy of the formula G = (5000 × A)/(100 − A) is questionable for the H-TEG device.
Importantly, the formula G = (5000 × A)/(100 − A)— or, according to our calculations, G = (4466 × A)/(100 − A)—should be specific to the H-TEG device. The formula is dependent on the precise details of the device including geometry, materials of the cup and plunger, stiffness of the torsional wire, and scale for measuring clot strength.16 It is important to consider that Gsample = Gdevice × Gexperiment. The H-TEG device was configured so that Gexperiment was 1 with a normal blood clot. It is somewhat surprising that, with the ROTEM device, the amplitude for a normal blood clot (NATEM assay) is 50 mm, meaning that Gexperiment is again 1. This implies that Gdevice is the same for ROTEM and H-TEG and, therefore, the same formula would be needed for measuring Gsample. However, our calculations suggest that this is not correct—it is unlikely that Gdevice is truly identical for the 2 devices.
Our calculations suggest that values for G, when based on results from ROTEM analysis, do not convey absolute physical properties of the blood clot. It may be asked whether the same might be true with the TEG device. We did not have the required geometric or clot strength data to replicate our ROTEM calculations with the TEG device. However, we do know that differences exist between today’s TEG device and that used by Hartert, for example, in relation to oscillation speed.21 It has also been shown that today’s TEG device provides slightly higher values for clot amplitude than ROTEM, when using identical assays and blood samples.4 Therefore, as with ROTEM, a recalculation of the constant for generating G is warranted. Conceivably, ROTEM and TEG devices could be calibrated to ensure consistent measurements of clot strength thus appearing to make the 5000 constant applicable. However, none of these steps (either device calibration or recalculation of the constant 5000) would eliminate fundamental reasons why it is doubtful that TEG/ROTEM analysis can provide an accurate measurement of shear modulus (lack of distinction between contributions of elasticity and viscosity to clot amplitude; lack of control of the applied strain amplitude—please see the Introduction section).8–10
Shear modulus (G) is presented in some publications as a relevant measure of clot elasticity arising from ROTEM or TEG analysis.22–26 G has also been singled out as a favorable means of measuring clot strength.27,28 In some circumstances, there is value in transforming amplitude (A) to elasticity (E or CE). However, considering that the relationship between G and E or CE is simple (G is 50 times E or CE) and that G might not provide an accurate value in absolute terms, it may be preferable to use a dimensionless parameter of clot elasticity (CE or E) instead of G. This correction would not impair the contribution of ROTEM or TEG analysis to coagulation management because clinical decisions are based on differences from reference ranges. The only requirement would be to ensure that the reference range triggers for treatment and (if applicable) treatment targets all have the same scale/units as the measurements being taken.
Mistakes appear likely with G—for example, in recent publications including the Denver protocol, values for G commonly appear to be wrong by a factor 1000.22,29–36 This error might be attributable to the fact that values for G exceed 1000 for all amplitudes above 17 mm (ie, a high proportion of readings). In contrast, with CE or E, only amplitudes above 90 mm produce values exceeding 1000. In most of the examples cited earlier, the error could be corrected by giving the units of G as kdyn/cm2 instead of dyn/cm2. However, in one of the studies some values appear wrong by a factor of 100.29
In addition to the parameter G, our suggestion to use a dimensionless parameter of clot elasticity is applicable to parameters that relate to the velocity curve showing the rate of change in clot elasticity over time. We agree with Grottke and ten Cate that these parameters, which have the potential to complement the clinical insight provided by standard TEG/ROTEM measurements, are better described as “derivative parameters” than “dynamic” or “parametric” parameters.37,38 Derivative parameters for TEG include maximum rate of thrombus generation (MRTG; unit = dyn/cm2/s), time to MRTG (TMRTG; unit = seconds), and total thrombus generation (TTG; unit = dyne/cm2).39 As with G, the use of dyne/cm2 for MRTG and TTG implies measurement of absolute physical properties and could therefore be considered as misleading. With ROTEM, the equivalent parameters to MRTG, TMRTG, and TTG are maximum velocity (MAXV; unit = mm × 100/s), time to MAXV (t-MAXV; unit = seconds), and area under the curve (AUC; unit = mm × 100).40 The units of these parameters do not imply that absolute physical properties are being measured, therefore current convention may be considered as acceptable with ROTEM derivative parameters. As a further consideration, the validity of coagulation parameters with other devices (eg, clot elastic modulus [CEM] measured in kdyn/cm2 by the Hemostasis Analysis System [HAS; Hemodyne Inc, Richmond, Virginia];41 maximum elasticity [G’max] measured in Pa by the ReoRox device [Medirox AB, Nyköping, Sweden]42) may be worthy of investigation, using a similar approach to that applied here with TEG and ROTEM.
In conclusion, TEG and ROTEM are valuable coagulation assessment tools that provide an evaluation of the viscoelastic properties of a clot, not through measuring absolute viscoelastic forces but through continuous reading of the clot amplitude relative to an arbitrary, preset scale.
Supplementary Material
Supplementary Material
Supplementary Material
Supplementary Material
Acknowledgments
The authors would like to thank Dr Dan Crispin for his valuable mathematical contributions.
Footnotes
Declaration of Conflicting Interests: The author(s) declared the following potential conflicts of interest with respect to the research, authorship, and/or publication of this article: GH is an employee of CSL Behring. CJS has received research support and speaker fees from CSL Behring, and research support from Tem International. CS is an employee of CSL Behring and previously received speaker honoraria and research support from Tem International and CSL Behring, and travel support from Haemoscope Ltd (former manufacturer of TEG®).KS, CL and HL have no conflicts of interest to declare.
Funding: The author(s) disclosed receipt of the following financial support for the research, authorship, and/or publication of this article: This work was not funded by the National Institutes of Health (NIH), Howard Hughes Medical Institute (HHMI), Medical Research Council (MRC), and/or Wellcome Trust. It was undertaken as an intellectual project without pharmaceutical industry funding.
Supplemental Material: The online supplementary files are available at http://journals.sagepub.com/doi/suppl/10.1177/1076029615606531.
References
- 1. Malek AM, Alper SL, Izumo S. Hemodynamic shear stress and its role in atherosclerosis. JAMA. 1999;282(21):2035–2042. [DOI] [PubMed] [Google Scholar]
- 2. Hartert H, Schaeder JA. The physical and biological constants of thrombelastography. Biorheology. 1962;1:31–39. [Google Scholar]
- 3. Schlimp CJ, Solomon C, Ranucci M, Hochleitner G, Redl H, Schöchl H. The effectiveness of different functional fibrinogen polymerization assays in eliminating platelet contribution to clot strength in thromboelastometry. Anesth Analg. 2014;118(2):269–276. [DOI] [PubMed] [Google Scholar]
- 4. Solomon C, Sorensen B, Hochleitner G, Kashuk J, Ranucci M, Schöchl H. Comparison of whole blood fibrin-based clot tests in thrombelastography and thromboelastometry. Anesth Analg. 2012;114(4):721–730. [DOI] [PubMed] [Google Scholar]
- 5. Haemoscope Corporation. TEG 5000 Thrombelastograph hemostasis system: user manual. Published 2008. Web site http://diamedil.info/MediGal/Technical%20Support/PN06-510_TEG_UserManual_v4_3_2008-10.PDF . Accessed August 2014.
- 6. Hartert H. Thrombelastography: physical and physiological aspects In: Copley AL, Stainsby G, eds. Flow Properties of Blood and Other Biological Systems. Oxford, UK: Pergamon Press; 1960:186–196. [Google Scholar]
- 7. Lang T, Toller W, Gutl M, et al. Different effects of abciximab and cytochalasin D on clot strength in thrombelastography. J Thromb Haemost. 2004;2(1):147–153. [DOI] [PubMed] [Google Scholar]
- 8. Evans PA, Hawkins K, Williams PR. Rheometry for blood coagulation studies. Rheology Rev. 2006:255–291. [Google Scholar]
- 9. Blair GW, Matchett RH. The kinetics of the polymerization of fibrin in some normal and pathological bloods as studied with the thrombelastograph. Biorheology. 1971;7(3):171–176. [DOI] [PubMed] [Google Scholar]
- 10. Evans PA, Hawkins K, Lawrence M, et al. Rheometry and associated techniques for blood coagulation studies. Med Eng Phys. 2008;30(6):671–679. [DOI] [PubMed] [Google Scholar]
- 11. Burghardt WR, Goldstick TK, Leneschmidt J, Kempka K. Nonlinear viscoelasticity and the thrombelastograph: 1. Studies on bovine plasma clots. Biorheology. 1995;32(6):621–630. [DOI] [PubMed] [Google Scholar]
- 12. Chandler WL. The thromboelastography and the thromboelastograph technique. Semin Thromb Hemost. 1995;21(suppl 4):1–6. [PubMed] [Google Scholar]
- 13. Narani K. Thrombelastography in the perioperative period. Indian J Anaesth. 2005;49(2):89–95. [Google Scholar]
- 14. Roeloffzen WW, Kluin-Nelemans HC, Mulder AB, de Wolf JT. Thrombocytopenia affects plasmatic coagulation as measured by thrombelastography. Blood Coagul Fibrinolysis. 2010;21(5):389–397. [DOI] [PubMed] [Google Scholar]
- 15. Lang T, Johanning K, Metzler H, et al. The effects of fibrinogen levels on thromboelastometric variables in the presence of thrombocytopenia. Anesth Analg. 2009;108(3):751–758. [DOI] [PubMed] [Google Scholar]
- 16. Marchal G, Leroux ME, Samama M. Atlas de Thrombodynamographie. Paris: Service de Propagande; 1962. [Google Scholar]
- 17. Bohner J, Von Pape KW. Method dependent reference values and preanalytical influences in rotation thromboelastography. Poster presented at the Annual Meeting of the German, Austrian and Swiss Society of Thrombosis and Hemostasis Research (GTH) 2003. [Google Scholar]
- 18. Bernal M, Gennisson JL, Flaud P, Tanter M. Correlation between classical rheometry and supersonic shear wave imaging in blood clots. Ultrasound Med Biol. 2013;39(11):2123–2136. [DOI] [PubMed] [Google Scholar]
- 19. Huang CC, Chen PY, Shih CC. Estimating the viscoelastic modulus of a thrombus using an ultrasonic shear-wave approach. Med Phys. 2013;40(4):042901. [DOI] [PubMed] [Google Scholar]
- 20. Schmitt C, Hadj Henni A, Cloutier G. Characterization of blood clot viscoelasticity by dynamic ultrasound elastography and modeling of the rheological behavior. J Biomech. 2011;44(4):622–629. [DOI] [PubMed] [Google Scholar]
- 21. Solomon C, Ranucci M, Hochleitner G, et al. Assessing the methodology to calculate the contribution of platelets to clot strength (platelet component) in thromboelastometry and thrombelastography. Anesth Analg. 2015;75(3):239–246. [DOI] [PMC free article] [PubMed] [Google Scholar]
- 22. Gonzalez E, Kashuk JL, Moore EE, Silliman CC. Differentiation of enzymatic from platelet hypercoagulability using the novel thrombelastography parameter delta (delta). J Surg Res. 2010;163(1):96–101. [DOI] [PMC free article] [PubMed] [Google Scholar]
- 23. Hickerson WL, Nur I, Meidler R. A comparison of the mechanical, kinetic, and biochemical properties of fibrin clots formed with two different fibrin sealants. Blood Coagul Fibrinolysis. 2011;22(1):19–23. [DOI] [PubMed] [Google Scholar]
- 24. Kuitunen AH, Suojaranta-Ylinen RT, Kukkonen SI, et al. Tranexamic acid does not correct the haemostatic impairment caused by hydroxyethyl starch (200 kDa/0.5) after cardiac surgery. Blood Coagul Fibrinolysis. 2006;17(8):639–645. [DOI] [PubMed] [Google Scholar]
- 25. Ostrowski SR, Berg RM, Windelov NA, et al. Discrepant fibrinolytic response in plasma and whole blood during experimental endotoxemia in healthy volunteers. PLoS One. 2013;8(3):e59368. [DOI] [PMC free article] [PubMed] [Google Scholar]
- 26. Trapani LM. Thromboelastography: current applications, future directions. Open J Anesthesiol. 2013;3(1):23–27. [Google Scholar]
- 27. Kashuk JL, Moore EE, Sabel A, et al. Rapid thrombelastography (r-TEG) identifies hypercoagulability and predicts thromboembolic events in surgical patients. Surgery. 2009;146(4):764–772. [DOI] [PubMed] [Google Scholar]
- 28. Nielsen VG, Geary BT, Baird MS. Evaluation of the contribution of platelets to clot strength by thromboelastography in rabbits: the role of tissue factor and cytochalasin D. Anesth Analg. 2000;91(1):35–39. [DOI] [PubMed] [Google Scholar]
- 29. Meyer AS, Meyer MA, Sorensen AM, et al. Thrombelastography and rotational thromboelastometry early amplitudes in 182 trauma patients with clinical suspicion of severe injury. J Trauma Acute Care Surg. 2014;76(3):682–690. [DOI] [PubMed] [Google Scholar]
- 30. Ko RH, Ji L, Young G. A novel approach for detecting hypercoagulability utilizing thromboelastography. Thromb Res. 2013;131(4):352–356. [DOI] [PubMed] [Google Scholar]
- 31. Branco BC, Inaba K, Ives C, et al. Thromboelastogram evaluation of the impact of hypercoagulability in trauma patients. Shock. 2014;41(3):200–207. [DOI] [PubMed] [Google Scholar]
- 32. Kashuk JL, Moore EE, Sawyer M, et al. Postinjury coagulopathy management: goal directed resuscitation via POC thrombelastography. Ann Surg. 2010;251(4):604–614. [DOI] [PubMed] [Google Scholar]
- 33. Jankun J, Skrzypczak-Jankun E. Bleeding diathesis is associated with an A15 T heterozygous mutation in exon 2 of the plasminogen activator inhibitor type 1. Exp Ther Med. 2010;1(4):575–577. [DOI] [PMC free article] [PubMed] [Google Scholar]
- 34. Kashuk JL, Moore EE, Wohlauer M, et al. Initial experiences with point-of-care rapid thrombelastography for management of life-threatening postinjury coagulopathy. Transfusion. 2012;52(1):23–33. [DOI] [PubMed] [Google Scholar]
- 35. Taura P, Rivas E, Martinez-Palli G, et al. Clinical markers of the hypercoagulable state by rotational thrombelastometry in obese patients submitted to bariatric surgery. Surg Endosc. 2014;28(2):543–551. [DOI] [PubMed] [Google Scholar]
- 36. Barua RS, Sy F, Srikanth S, et al. Effects of cigarette smoke exposure on clot dynamics and fibrin structure: an ex vivo investigation. Arterioscler Thromb Vasc Biol. 2010;30(1):75–79. [DOI] [PubMed] [Google Scholar]
- 37. Faraoni D, Fenger-Eriksen C, Gillard S, et al. Evaluation of dynamic parameters of thrombus formation measured on whole blood using rotational thromboelastometry in children undergoing cardiac surgery: a descriptive study. Pediatr Anesth. 2015;25(6):573–579. [DOI] [PubMed] [Google Scholar]
- 38. Grottke O, Cate HT, Reply to Faraoni D, Fenger-Eriksen C, Gillard S, et al. Evaluation of dynamic parameters of thrombus formation measured on whole blood using rotational thromboelastometry in children undergoing cardiac surgery: a descriptive study. Paediatr Anaesth. 2015;25(6):646–647. [DOI] [PubMed] [Google Scholar]
- 39. Nielsen VG. Beyond cell based models of coagulation: analyses of coagulation with clot “lifespan” resistance-time relationships. Thromb Res. 2008;122(2):145–152. [DOI] [PubMed] [Google Scholar]
- 40. Sorensen B, Johansen P, Christiansen K, Woelke M, Ingerslev J. Whole blood coagulation thrombelastographic profiles employing minimal tissue factor activation. J Thromb Haemost. 2003;1(3):551–558. [DOI] [PubMed] [Google Scholar]
- 41. Carr ME., Jr Development of platelet contractile force as a research and clinical measure of platelet function. Cell Biochem Biophys. 2003;38(1):55–78. [DOI] [PubMed] [Google Scholar]
- 42. Solomon C, Schochl H, Ranucci M, Schött U, Schlimp CJ. Comparison of fibrin-based clot elasticity parameters measured by free oscillation rheometry (ReoRox®) versus thromboelastometry (ROTEM®). Scand J Clin Lab Invest. 2015;75(3):239–246. [DOI] [PMC free article] [PubMed] [Google Scholar]
Associated Data
This section collects any data citations, data availability statements, or supplementary materials included in this article.


