

Summary
CD4+ T cells are central mediators of autoimmune pathology; however, defining their key effector functions in specific autoimmune diseases remains challenging. Pathogenic CD4+ T cells within affected tissues may be identified by expression of markers of recent activation1. Here, we used mass cytometry to evaluate activated T cells in joint tissue from patients with rheumatoid arthritis (RA), a chronic immune-mediated arthritis that affects up to 1% of the population2. This approach revealed a strikingly expanded population of PD-1hi CXCR5- CD4+ T cells in RA synovium. These cells are not exhausted. Rather, multidimensional cytometry, transcriptomics, and functional assays define a population of PD-1hi CXCR5- ‘peripheral helper’ T (Tph) cells that express factors enabling B cell help, including IL-21, CXCL13, ICOS, and MAF. Like PD-1hi CXCR5+ T follicular helper (Tfh) cells, Tph cells induce plasma cell differentiation in vitro via IL-21 and SLAMF5-interactions3,4. However, global transcriptomics robustly separate Tph cells from Tfh cells, with altered expression of Bcl6 and Blimp-1 and unique expression of chemokine receptors that direct migration to inflamed sites, such as CCR2, CX3CR1, and CCR5, in Tph cells. Tph cells appear uniquely poised to promote B cell responses and antibody production within pathologically inflamed non-lymphoid tissues.
Keywords: autoimmunity, follicular helper T cells, rheumatoid arthritis, PD-1, plasma cells, CCR2, mass cytometry
We analyzed CD4+ T cells in 3 seropositive (defined as rheumatoid factor+ or anti-citrullinated peptide antibody+) RA synovial tissue samples with dense leukocyte infiltrates using a mass cytometry panel designed to interrogate both stromal and leukocyte populations (Extended Data Table 1). Two-dimensional visualization of the multidimensional cytometry data using the viSNE algorithm5 revealed a heterogeneous CD4+ T cell population with distinct expression patterns of 5 activation markers (PD-1, MHC II, ICOS, CD69, CD38) (Fig. 1a). Strikingly, a large population of cells with high PD-1 expression clustered together in each of the 3 samples (Fig. 1a, Extended Data Fig. 1a). Biaxial gating of data from 6 seropositive RA synovial tissue samples confirmed high expression of PD-1 on ∼25% of synovial CD4+ T cells, the majority of which co-expressed MHC II and/or ICOS (Fig. 1b, Extended Data Fig. 1b, Extended Data Table 2).
Figure 1. Expanded PD-1hi CXCR5- CD4+ T cells in joints and blood of seropositive RA patients.

a) viSNE plots of mass cytometry of RA synovial tissue total CD4+ T cells. Color indicates cell expression level of labeled marker. Circle demonstrates PD-1hi cells. Arrow indicates CXCR5+ cells. b) PD-1hi T cell frequency in RA synovial tissue (n=6). c) PD-1hi CD4+ T cell frequencies in synovial fluid from seropositive RA (n=9) and seronegative inflammatory arthritides (n=19). d) PD-1hi cell frequencies in seropositive RA synovial fluid (n=9) and tissue (n=10). e) Percentage of PD-1hi CXCR5- cells within memory CD4+ T cells in seropositive RA (n=42), seronegative RA (n=16), spondyloarthropathy (SpA, n=11), and control (n=35) patient blood. f) PD-1hi frequency in blood of seropositive RA patients with low (n=14) or moderate-high (n=28) disease activity. g) PD-1hi CXCR5- CD4+ T cell and plasmablast frequencies in blood before and after RA treatment escalation (n=18). Mean ± SD in b,c,d, median ± interquartile range in e,f shown. * p<0.05, ** p<0.01, *** p<0.001, **** p<0.0001 by Mann-Whitney (c,d), Kruskal-Wallis (e,f), Wilcoxon test (g).
In a complementary approach, 11-dimensional flow cytometric analysis of memory CD4+ T cells from paired synovial fluid and blood samples from 3 seropositive RA patients also revealed a large population of synovial PD-1hi CD4+ T cells, a subset of which co-expressed MHC II and/or ICOS (Extended Data Fig. 1c). Approximately 30% of synovial fluid CD4+ T cells displayed high PD-1 expression, mirroring results from synovial tissue (Fig. 1c, Extended Data Fig. 1c,d). The frequency of PD-1hi CD4+ T cell populations was over 5-fold higher in seropositive RA synovial fluid (n=9) compared to synovial fluid from 19 patients with seronegative inflammatory arthritides (seronegative RA n=2, spondyloarthropathy n=8, juvenile idiopathic arthritis n=9) (Fig. 1c).
The dramatic expansion of PD-1hi cells specifically in seropositive RA, a disease characterized by autoantibody production and frequent synovial T cell-B cell aggregates6,7, led us to considered whether synovial PD-1hi cells might be Tfh cells. Tfh cells, often identified as CXCR5+ PD-1+, are uniquely adapted to promote B cell recruitment and differentiation in lymph node follicles via production of IL-21, IL-4, CD40L, and CXCL13, the ligand for CXCR53. However, seropositive RA synovial tissue samples contained few PD-1hi CXCR5+ Tfh cells (Fig. 1d), which clustered separately from PD-1hi CXCR5- cells in viSNE analyses (Fig. 1a). In contrast, ∼85% of PD-1hi CD4+ cells in synovial tissue lacked CXCR5, as did almost all PD-1hi CD4+ cells in synovial fluid (Fig. 1d). Measurement of CXCR5 transcript levels in sorted PD-1hi CXCR5- and PD-1hi CXCR5+ cells from synovial tissue, synovial fluid, and blood confirmed that PD-1hi CXCR5- cells from all 3 sources contained little, if any, CXCR5 mRNA (Extended Data Fig. 1e,f). Thus, seropositive RA synovium contains abundant PD-1hi CD4+ T cells that are distinct from Tfh cells.
Intriguingly, PD-1hi CXCR5- CD4+ T cells with a similar multidimensional phenotype, including increased MHC II and ICOS expression, also appeared in the circulation, albeit at much lower frequencies (Extended Data Fig. 1c,e, Extended Data Fig. 2a,b). Quantification of circulating PD-1hi CXCR5- memory CD4+ T cells in patients with established seropositive RA, seronegative RA, spondyloarthropathy, and non-inflammatory controls demonstrated a significantly increased frequency of PD-1hi CXCR5- cells specifically in seropositive RA patients (Fig. 1e, Extended Data Table 2). PD-1hi CXCR5- MHC II+ and PD-1hi CXCR5- ICOS+ cells were also increased in blood of seropositive RA patients (Extended Data Fig. 2c). In contrast, the frequencies of PD-1hi CXCR5+ cells and cells with intermediate PD-1 expression were not increased (Extended Data Fig. 2d,e).
PD-1hi CXCR5- cell frequencies were more robustly increased in seropositive RA patients with moderate or high disease activity (clinical disease activity index (CDAI)>10) (Fig. 1f). The frequency of PD-1hi CXCR5- cells did not vary with other clinical parameters such as age, sex, disease duration, use of methotrexate or biologic therapies, or serum anti-CCP antibody titer (Extended Data Fig. 2f-h). In an independent cohort of 23 seropositive RA patients assayed before and after starting a new RA medication, there was a significant correlation between reduction in disease activity and reduction in the frequency of PD-1hi CXCR5- T cells (Extended Data Fig. 2i). The frequency of PD-1hi CXCR5- cells, PD-1hi MHC II+ CXCR5- and PD-1hi ICOS+ CXCR5- cells decreased significantly in the 18 patients whose disease activity decreased after treatment escalation (Fig. 1g, Extended Data Fig. 2j).
Since high PD-1 expression is often considered indicative of an exhausted state8,9, we assessed the function of synovial PD-1hi CXCR5- cells. Surprisingly, despite lack of CXCR5, PD-1hi CD4+ T cells sorted from seropositive RA synovial fluid showed >100-fold increased mRNA expression of IL-21 and >1000-fold increased expression of CXCL13, as well as higher levels of IFN-γ and IL-10, compared to PD-1- T cells, with the highest expression in PD-1hi MHC II+ cells (Fig. 2a, sorted as in Extended Data Fig. 1e). In contrast, IL-2 showed a trend towards lower expression in PD-1hi cells.
Figure 2. Synovial PD-1hi CXCR5- CD4+ T cells express factors associated with B cell help.

a) RT-PCR for cytokines in memory CD4+ T cell populations from RA synovial fluid (n=7 donors). Median ± interquartile range. b) Cytokine production by synovial fluid memory CD4+ T cells (n=3 experiments using different donors). c) Transcription factor expression in synovial tissue memory CD4+ T cells by flow cytometry. d) Quantification of transcription factor expression in T cells from synovial fluid (blue, n=3 donors) or synovial tissue (green, n=3 donors). For b,d, mean ± SD shown. * p<0.05, ** p<0.01, *** p<0.001, **** p<0.0001 by Friedman's test compared to PD-1- MHC II- cells (a) or one-way ANOVA comparing PD-1-CXCR5-, PD-1hi CXCR5-, and PD-1- CXCR5+ (d).
Consistent with mRNA expression, PD-1hi CXCR5- cells sorted from RA synovial fluid more frequently produced IL-21 (∼30%), but less frequently produced IL-2, compared to PD-1- or PD-1int cells, after stimulation with PMA+ionomycin (Fig. 2b). Optimal CXCL13 production was detected after 24 hours of stimulation with anti-CD3/CD28 beads. Strikingly, at this timepoint, ∼25% of PD-1hi CXCR5- cells produced CXCL13, but not IL-2, compared to <1% of PD-1- or PD-1int cells (Fig. 2b). High IL-21 and CXCL13 production by synovial fluid PD-1hi CXCR5- CD4+ T cells indicates that these cells are not globally exhausted, and instead suggested possible B cell-helper function.
PD-1hi MHC II+ cells in seropositive RA synovial fluid also expressed high mRNA levels of the transcription factors MAF and BATF and the signaling adaptor SAP (encoded by SH2D1A), 3 factors important for Tfh cell development or function (Extended Data Fig. 3a)3. However, Bcl6, a transcription factor characteristically expressed in Tfh cells, was not elevated in synovial fluid PD-1hi cells, while Blimp-1, a transcription factor typically downregulated in Tfh cells, was upregulated (Extended Data Fig. 3a)3,10.
Intracellular flow cytometry confirmed that Blimp-1 was significantly elevated in PD-1hi CXCR5- cells, but not PD-1hi CXCR5+ cells, from seropositive RA synovial samples (Fig. 2c,d). In contrast, Bcl6 was dramatically elevated in PD-1hi CXCR5+ cells, such that the Bcl6/Blimp-1 ratio was uniquely elevated in synovial PD-1hi CXCR5+ cells. Expression of MAF, a factor that promotes IL-21 production in human CD4+ T cells11, was elevated in both PD-1hi CXCR5- and PD-1hi CXCR5+ cells.
PD-1hi memory CD4+ T cells from peripheral blood showed a transcriptional pattern similar to that in synovial fluid PD-1hi cells, with increased expression of IL-21, CXCL13, IFN-γ, MAF, SAP, and Blimp-1, but not IL-2 or Bcl6, in circulating PD-1hi MHC II+ cells compared to PD-1- cells (Extended Data Fig. 3b,c). Both PD-1hi CXCR5- and PD-1hi CXCR5+ cells expressed increased IL-21 and CXCL13 and decreased IL-2 compared to PD-1- T cells (Extended Data Fig. 3c). However, Blimp-1 expression was ∼3-fold higher in blood PD-1hi CXCR5-cells compared to PD-1hi CXCR5+ cells. Consistently, after in vitro stimulation, blood PD-1hi CXCR5- cells expressed more Blimp-1 and less Bcl6 protein than did PD-1hi CXCR5+ cells (Extended Data Fig. 3d). Taken together, these results indicate that both synovial and blood PD-1hi CXCR5- cells express factors associated with B cell-helper function without an elevated Bcl6/Blimp-1 expression ratio.
To compare PD-1hi CXCR5- and PD-1hi CXCR5+ cells more broadly, we analyzed PD-1hi cells from blood by mass cytometry (Extended Data Table 1). viSNE visualization of memory CD4+ T cells clustered PD-1hi CXCR5- and PD-1hi CXCR5+ cells in close proximity, indicating a similar multidimensional phenotype (Fig. 3a, Extended Data Fig. 4a). In contrast, FoxP3+ T regulatory cells aggregated in a separate region, indicating that most PD-1hi cells are not T regulatory cells, a finding confirmed by flow cytometry (Fig. 3a, Extended Data Fig. 4b).
Figure 3. High dimensional analyses of PD-1hi CXCR5- and PD-1hi CXCR5+ cells identify shared and distinct features.

a) viSNE plots of blood memory CD4+ T cells from an RA patient. Circle indicates PD-1hi cells. b) Difference in expression of significantly altered proteins between PD-1hi populations and PD-1- CXCR5- cells (n=14 RA patients). c) Expression of indicated proteins by mass cytometry (n=7 RA patients (black) and 7 controls (grey)). d) PCA of RNA-seq transcriptomes (n=4 RA patients). e,f) Heatmap of expression of Tfh-associated genes (e) or chemokine receptors (f). g) CCR2 expression on PD-1hi CD4+ T cells by flow cytometry (blood n=20, fluid n=5, tissue n=10). Mean ± SD shown. ** p<0.001, *** p<0.0001 by Wilcoxon (c), Kruskal-Wallis test (g).
Both PD-1hi CXCR5- cells and PD-1hi CXCR5+ cells showed significantly increased expression of 11 proteins, including TIGIT, ICOS, CD38, and CD57, and significantly decreased expression of 5 proteins, including CD25 and CD127, compared to PD-1- CXCR5- cells (Fig. 3b). Unlike TIGIT, the inhibitory receptors TIM-3, LAG-3, and CTLA-4 did not appear enriched on PD-1hi CXCR5- cells (Extended Data Fig. 4c). Compared to PD-1hi CXCR5+ cells, PD-1hi CXCR5-cells showed lower expression of CCR7 and CD27 but higher CD44 and T-bet (Fig. 3b,c), suggesting a potentially distinct migratory capacity12,13.
We next performed an unbiased global transcriptomic comparison of blood PD-1hi CXCR5- and PD-1hi CXCR5+ cell subpopulations by RNA-seq. Principal components analysis separated PD-1hi populations that co-expressed ICOS and/or MHC II from PD-1- cells along the first principal component (PC), irrespective of CXCR5 expression (Fig. 3d, Extended Data Fig. 4d). However, PD-1hi CXCR5- and PD-1hi CXCR5+ cell populations were largely distinguished by PC2, indicating considerable differences in the global transcriptomes of PD-1hi CXCR5- cells and PD-1hi CXCR5+ cells beyond CXCR5 expression alone.
Sixty-six genes were differentially expressed when comparing all of the PD-1hi populations to the PD-1- populations (log fold change >1.2, FDR<0.01, Extended Data Table 3), including a set of genes previously reported to be elevated in Tfh cells, such as MAF, TIGIT, and SLAMF614,15. Analysis of a curated list of Tfh-associated genes14,16,17 demonstrated similar upregulation of multiple genes in the pooled PD-1hi CXCR5+ cell samples and PD-1hi CXCR5- cell samples (Fig. 3e). When all 8 subpopulations were analyzed without pooling, hierarchical clustering based on these genes perfectly segregated PD-1hi populations from PD-1- populations, regardless of CXCR5 expression (p<0.026, Extended Data Fig. 4e). These results highlight a shared transcriptional program associated with B cell-helper function in PD-1hi CXCR5- cells and Tfh cells.
However, we also identified 16 genes with significantly different expression between PD-1hi CXCR5- and PD-1hi CXCR5+ cells (Extended Data Table 4). Notably, PD-1hi CXCR5- cells showed 34-fold increased expression of CCR2, a chemokine receptor that mediates migration to sites of peripheral inflammation18. A targeted analysis of chemokine receptor expression on PD-1hi CXCR5- cells demonstrated striking upregulation of a set of ‘inflammatory’ chemokine receptors on these cells, including CCR2, CX3CR1, and CCR5, which was confirmed by flow cytometry (Fig. 3f,g, Extended Data Fig. 4f)19. Notably, ∼50% of PD-1hi CXCR5- cells in seropositive RA synovial tissue and synovial fluid expressed CCR2 (Fig. 3g). These results indicate that PD-1hi CXCR5- cells can be distinguished from PD-1hi CXCR5+ cells not only by the lack of CXCR5 but also by high expression of inflammatory chemokine receptors.
To investigate the interconversion of PD-1hi cells that express distinct chemokine receptors, PD-1hi CXCR5- CCR2-, PD-1hi CXCR5- CCR2+, and PD-1hi CXCR5+ CCR2- cell populations sorted from blood were stimulated in vitro and re-evaluated at different timepoints (Extended Data Fig. 5a,b). After 7 days, the majority of PD-1hi cells that started out CXCR5- CCR2+ cells remained CCR2+, while less than 5% of these cells acquired CXCR5 (Extended Data Fig. 5c,d). Conversely, most PD-1hi cells that started out CXCR5+ CCR2- remained CXCR5+, and less than 5% of these cells acquired CCR2. These results suggest that CXCR5 and CCR2 expression remain persistent, distinguishing features on PD-1hi CD4+ T cells in vitro.
We next tested directly if PD-1hi CXCR5- CD4+ T cells can provide B cell help in vitro. PD-1hi CXCR5- cells sorted from seropositive RA synovial tissue or synovial fluid induced differentiation of co-cultured memory B cells into plasma cells, while CXCR5- cells without high PD-1 expression did not (Fig. 4a). The limited number of CXCR5+ T cells in synovial samples precluded comparison with PD-1hi CXCR5+ cells. PD-1hi CXCR5- cells from blood also induced memory B cell differentiation into plasma cells, with comparable activity in PD-1hi CXCR5-CCR2-, PD-1hi CXCR5- CCR2+, and PD-1hi CXCR5+ cells (Fig. 4a,b). PD-1hi CXCR5- cells from synovial fluid and blood also enhanced IgG production in the co-cultures (Fig. 4c). Neutralization of IL-21 inhibited plasma cell differentiation induced by both blood PD-1hi CXCR5- cells and PD-1hi CXCR5+ cells by ∼90% (Fig. 4d). Expression of SLAMF5, a factor important for T-B interactions,4 was elevated on both PD-1hi CXCR5- and PD-1hi CXCR5+ cells, and antibody blockade of SLAMF5, but not SLAMF6, completely abrogated plasma cell differentiation and IgG production (Fig. 4e, Extended Data Fig. 6a-c). Consistent with a link in vivo, RA treatment escalation reduced the frequency of circulating plasmablasts in parallel with the reduction in PD-1hi CXCR5- T cells (Fig. 1g).
Figure 4. PD-1hi CXCR5- CD4+ T cells promote plasma cell differentiation via IL-21 and SLAMF5 interactions.

a) Plasma cell frequency in T cell-B cell co-cultures using memory CD4+ T cells from indicated sources. Pooled data from 2 experiments (synovial tissue, n=3 replicates per experiment), 3 experiments (synovial fluid), or 6 experiments (blood) using different donors. b) Co-cultures as in (a) using blood T cell subpopulations. c) IgG in supernatants of co-cultures. d,e) Co-cultures with IL-21R-Ig fusion protein (d) or anti-SLAMF5/SLAMF6 antibody (e). For b-e) 1 of 3 experiments with different donors (n=3 replicates). f,g) Immunofluorescence microscopy of RA synovium showing PD-1hi CXCR5- cells (white arrow) and PD-1hi CXCR5+ cell (grey arrow). Scale bar = 50μM. h,i) Quantification of PD-1hi cells in RA synovium (n=5-8 HPF from 4 samples). Mean ± SD shown. * p<0.05, ** p<0.01, *** p<0.001 by Mann-Whitney (a[synovial tissue],d), Kruskal-Wallis compared to PD-1- CXCR5- (a[blood, synovial fluid],c,e), or Wilcoxon test (h,i).
Finally, immunofluorescence microscopy identified CD3+ T cells with bright PD-1 expression in all 4 seropositive RA synovial samples analyzed (Fig. 4f). CXCR5 was observed on CD20+ B cells and on a minority of PD-1hi T cells that were enriched within lymphoid aggregates (Fig. 4g,h). However, PD-1hi CXCR5- cells outnumbered PD-1hi CXCR5+ cells within lymphoid aggregates, and were ∼4-fold more abundant than PD-1hi CXCR5+ cells in regions outside of lymphoid aggregates (Fig. 4h). Within lymphoid aggregates, both PD-1hi CXCR5- cells and PD-1hi CXCR5+ cells were found adjacent to B cells (Fig. 4g,i). However, in areas outside of lymphoid aggregates, the majority of PD-1hi cells adjacent to B cells were CXCR5- (Fig. 4i, Extended Data Fig. 6d). These results suggest a unique capacity of PD-1hi CXCR5- T cells to interact with B cells both within lymphoid aggregates and more diffusely throughout the inflamed synovium.
Here, we have defined a PD-1hi CXCR5- CD4+ T ‘peripheral helper’ (Tph) cell population markedly expanded in rheumatoid arthritis that combines B cell helper function with a migratory program targeting inflamed tissues. The abundance of Tph cells in RA synovium highlights the importance of tissue-localized T-B cell interactions20. Tph cells may infiltrate chronically inflamed tissues, which would not be expected to readily recruit Tfh cells, providing a potential mechanism for the initiation of ectopic lymphoid structures21-23. Tph cell production of CXCL13 and IL-21 may recruit both Tfh and B cells, promoting local autoantibody production that may not be reflected in serum, and perhaps modulating other B cell functions such as cytokine production7,24. Identification of the Tph cell phenotype considerably expands the spectrum of B cell-helper T cells that may be assessed as biomarkers for autoantibody-associated diseases. Further, high expression of PD-1 on Tph cells may offer a potential strategy for therapeutic targeting of tissue T cell-B cell interactions.
Methods
Human subjects research
Human subjects research was performed according to the Institutional Review Boards at Partners HealthCare, Hospital for Special Surgery, or the University of Birmingham Local Ethical Review Committee (Birmingham, UK) via approved protocols with appropriate informed consent as required. Patients with RA fulfilled the ACR 2010 Rheumatoid Arthritis classification criteria. Rheumatoid factor and anti-CCP antibody status, C-reactive protein level, and medication usage were obtained by review of electronic medical records. Biologic therapy was defined as use of anti-TNF, abatacept, rituximab, tocilizumab, or tofacitinib. Synovial tissue samples for mass and flow cytometry were collected from seropositive RA patients undergoing arthroplasty at the Hospital for Special Surgery, New York or at Brigham and Women's Hospital, Boston. Samples with lymphocytic infiltrates on histology were prioritized for analyses. Synovial tissue for microscopy was acquired by synovial biopsy of a clinically inflamed joint from seropositive RA patients within the Birmingham early arthritis cohort (BEACON) at the University of Birmingham, UK.
Synovial fluid samples were obtained as excess material from a separate cohort of patients undergoing diagnostic or therapeutic arthrocentesis of an inflammatory knee effusion as directed by the treating rheumatologist. These samples were de-identified; therefore, additional clinical information was not available, except for the 3 patients from whom paired synovial fluid and blood were obtained.
Blood samples for clinical phenotyping were obtained from patients seen at the Brigham and Women's Hospital Arthritis Center. For blood cell analyses in the cross-sectional cohort, CDAI was measured by the treating clinician on the day of sample acquisition. Anti-CCP titers were measured using the Immunoscan CCPLus ELISA (Eurodiagnostica), with a positive result defined as >25 units/mL. For RA patients followed longitudinally, a new treatment was initiated at the discretion of the treating physician, and CDAIs were determined at each visit by trained research study staff. Blood samples were acquired before initiation of a new biologic therapy or within 1 week of starting methotrexate. Concurrent prednisone at doses ≤10mg/day were permitted.
All synovial fluid and blood samples were subjected to density centrifugation using Ficoll-Hypaque to isolate mononuclear cells, which were cryopreserved for batched analyses. Most phenotypic and transcriptomic analyses of blood T cells were performed on samples from both RA patients and non-inflammatory controls, with similar results unless specifically indicated. In vitro PD-1hi T cell interconversion assays and in vitro B cell helper-assays using blood T cells were performed using PBMC from blood bank leukoreduction collars from anonymous donors.
All blood CD4+ T cell analyses included only CD45RA- memory CD4+ T cells except where naïve (CD45RA+) cells are specifically indicated. Here the term ‘memory’ is used to denote an ‘antigen-experienced’ status indicated by loss of the naïve T cell marker CD45RA. This population includes both resting and activated antigen-experienced T cells. Synovial fluid and tissue analyses also utilize only memory CD4+ T cells unless total CD4+ T cells are indicated. Naïve T cells constituted <10% of the total population of CD4+ T cells in synovial tissue and synovial fluid.
Synovial tissue analysis
Synovial samples were acquired from discarded arthroplasty tissue. Synovial tissue was isolated by careful dissection, minced, and digested with 100μg/mL LiberaseTL and 100μg/mL DNaseI (both Roche) in RPMI (Life Technologies) for 15 minutes, inverting every 5 minutes. Cells were passed through a 70μm cell strainer, washed, subjected to red blood cell lysis, and cryopreserved in Cryostor CS10 (BioLife Solutions) for batched analyses.
Mass cytometry
Cryopreserved disaggregated synovial cells or PBMCs were thawed into RPMI + 10% FBS (HyClone). Viability was assessed with rhodium for PBMCs and cisplatin (both Fluidigm) for synovial cells. Cells were then washed and stained with primary antibody cocktails at 1:100 dilution (Extended Data Table 1). All antibodies were obtained from the Longwood Medical Area CyTOF Antibody Resource Core (Boston, MA). Cells were then washed, fixed and permeabilized using the Ebioscience Transcription Factor Fix/Perm Buffer for 45 minutes, washed in PBS/1%BSA/0.3% saponin, then stained for intracellular markers. Cells were re-fixed in formalin (Sigma), washed with Milli-Q water, and analyzed on a CyTOF2 (Fluidigm) for PBMC or Helios (Fluidigm) for synovial cells. Mass cytometry data were normalized using EQ™ Four Element Calibration Beads (Fluidigm) as described25.
viSNE analyses were performed on cytometry data from 3 of 6 synovial tissue samples, 3 of 9 synovial fluid samples, and 8 of 14 blood samples using the Barnes-Hut SNE implementation on Cytobank (www.cytobank.org). All 3 individual synovial tissue sample analyses are shown. For synovial fluid and blood cell analyses, one representative patient sample is shown. For synovial tissue mass cytometry data, gated CD4+ T cells were analyzed using all available protein markers, and each synovial tissue sample was analyzed individually to allow for maximal resolution. For paired synovial fluid-blood flow cytometry data, gated memory CD4+ T cells from synovial fluid and blood were analyzed together in a single viSNE analysis for direct comparison using an equal number of randomly selected cells from each sample. For blood mass cytometry analyses, equal numbers of gated memory CD4+ T cells from each sample were analyzed together using all markers except those used for gating (CD3, CD4, CD45RO). Comparison of marker expression on PD-1hi CXCR5- and PD-1hi CXCR5+ cells was performed with R-3.2 using Mann-Whitney tests and p-values were adjusted for multiple testing using the Bonferroni correction. Mass cytometry data were transformed using the inverse hyperbolic sine prior to expression analysis in Fig. 3b25.
Flow cytometry and cell sorting
For PD-1hi T cell quantification, cryopreserved cells were thawed into warm RPMI/10% FBS, washed once in cold PBS, and stained in PBS/1% BSA with the following antibodies for 45 minutes: anti-CD27-FITC (TB01), anti-CXCR3-PE (CEW33D), anti-CD4-PE-Cy7 (RPA-T4), anti-ICOS-PerCP-Cy5.5 (ISA-3), anti-CXCR5-BV421 (J252D4), anti-CD45RA-BV510 (HI100), anti-HLA-DR-BV605 (G46-6), anti-CD49d-BV711 (9F10), anti-PD-1-APC (EH12.2H7), anti-CD3-AlexaFluor700 (HIT3A), anti-CD29-APC-Cy7 (TS2/16), propidium iodide. Antibodies used in additional panels included anti-SLAM-AF488 (A12), anti-SLAMF5-PE (CD84.1.21), anti-SLAMF6-PE (NT-7), anti-CCR2-PE (K036C2), anti-CX3CR1-FITC (2A9-1), anti-CD38-PE (HIT2), anti-CD138-PE/Cy7 (MI15), anti-CTLA-4-PerCP/Cy5.5 (L3D10) from BioLegend, anti-CCR5-FITC (2D7) and anti-FoxP3-AF647 (236A/E7) from BD Biosciences, anti-LAG-3-APC from R&D Systems, anti-TIM-3-PE/Cy7 (F38-2E2) and anti-TIGIT-PE (MBSA43) from eBioscience.
Cells were washed in cold PBS, passed through a 70-micron filter, and data acquired on a BD FACSAria Fusion, BD Fortessa, or BD Canto II analyzer using FACSDiva software. Data were analyzed using FlowJo 10.0.7. For blood cell quantification in Fig. 1 and Extended Data Fig. 2, samples were analyzed in uniformly processed batches of coded samples with multiple disease conditions included in each batch. Upon data acquisition, disease categories were assigned to data files. A single set of gates for PD-1, CXCR5, ICOS, and MHC II was applied to all samples. The percentage of PD-1hi T cell populations among memory CD4+ T cells populations and the percentage of plasmablasts (CD19+ CD20lo CD38hi CD27+) among total CD19+ B cells were calculated for indicated samples.
T cells were sorted directly from synovial fluid and synovial tissue samples. For sorting blood T cells, total CD4+ T cells were first isolated by magnetic bead negative selection (Miltenyi Biotec). Cell sorting was performed on a BD FACSAria Fusion sorter using a 70 micron nozzle. Sort gates were drawn as depicted in Extended Data Fig. 1e. Cell purity was routinely >98%. For functional analyses, cells were sorted into cold RPMI/10% FBS. For RNA analyses, sorted cells were lysed in RLT lysis buffer (Qiagen) with 1% β-mercaptoethanol (Sigma).
Intracellular cytokine staining
Synovial fluid mononuclear cells were stained with anti-PD-1-PE/Dazzle 594, CXCR5-BV605, and CD4-BV650 (Biolegend), and propidium iodide. CXCR5- PD-1hi, PD-1int, and PD-1- CD4+ T cells sorted as above were pelleted by centrifugation and resuspended in RPMI/10% FBS at a density of 5×10⁵ cells/mL in 24-well plates. Cells were stimulated with either anti-CD3/anti-CD28 beads at a ratio of 2:1 (cell:bead) for 24 hours, or with PMA (50ng/mL) and ionomycin (1μg/mL). Brefeldin A and monensin (both 1:1000, eBioscience) were added for the last 5 hours. Cells were washed twice in cold PBS, incubated for 30 minutes with Fixable Viability Dye eFluor 455UV (eBioscience), washed in PBS/1%BSA, and then fixed and permeabilized using the eBioscience Transcription Factor Fix/Perm Buffer. Cells were washed in PBS/1%BSA/0.3% saponin and incubated with anti-IL-21-APC (3A3-N2), anti-IL-2-PE/Cy7 (MQ1-17H12), and anti-CXCL13-AlexaFluor700 (53610, R&D Systems) for 30 minutes, washed once, filtered, and data acquired on a BD Fortessa analyzer.
Intracellular transcription factor staining
Synovial tissue and synovial fluid cells were thawed, washed twice in PBS, and incubated with Fixable Viability Dye eFluor 455UV (eBioscience) for 30 minutes. Cells were then washed in PBS/1%BSA and stained with antibodies against surface markers anti-CD3-AF700, anti-CD4-BV650, anti-CCR2-PE, anti-CXCR5-BV421, anti-PD-1-PE/Dazzle 594 (all Biolegend) for 30 minutes. Cells were washed once and incubated with eBioscience Transcription Factor Fix/Perm Buffer. Cells were washed in PBS/1%BSA/0.3% saponin and incubated in intracellular antibodies anti-MAF-PerCP-eFluor710 (sym0F1, eBioscience), anti-Bcl6-APC (BCL-UP, eBioscience), and anti-Blimp-1-AF488 (646702, R&D Systems) at 1:20 dilutions for 4 hours. Cells were washed once, filtered, and data acquired on a BD Fortessa analyzer. Intracellular detection of FoxP3 and CTLA-4 were performed by the same method on magnetic-bead purified blood CD4+ T cells using the indicated surface markers.
RT-PCR analyses
RNA isolated using RNeasy Micro Kits (Qiagen). cDNA was prepared using Quantitect RT-PCR (Qiagen) and PCR performed with Brilliant III SYBRGreen on an a Stratagene Mx3000. Primers used were as follows: RPL13A (Forward: 5′-CATAGGAAGCTGGGAGCAAG-3′; Reverse: 5′-GCCCTCCAATCAGTCTTCTG-3′), IL-2 (Forward: 5′-AGAACTCAAACCTCTGGAGGAAG-3′; Reverse: 5′-GCTGTCTCAGCATATTCACAC-3′), IFN-γ (Forward: 5′-GCATCGTTTTGGGTTCTCTTG-3′; Reverse: 5′-AGTTCCATTATCCGCTACATCTG-3′), IL-10 (Forward: 5′-CGCATGTGAACTCCCTGG-3′; Reverse: 5′-TAGATGCCTTTCTCTTGGAGC-3′), IL-21 (Forward: 5′-AGGAAACCACCTTCCACAAA-3′; Reverse: 5′-GAATCACATGAAGGGCATGTT-3′), CXCL13 (Forward: 5′-TCTCTGCTTCTCATGCTGCT-3′; Reverse: 5′-TCAAGCTTGTGTAATAGACCTCCA-3′), PD-1 (Forward: 5′-CCAGGATGGTTCTTAGACTCC-3′; Reverse: 5′-TTTAGCACGAAGCTCTCCGAT-3′), CXCR5 (Forward: 5′-GGGAGCCTCTCAACATAAGAC-3′; Reverse: 5′-CCAATCTGTCCAGTTCCCAGA-3′), MAF (Forward: 5′-CCGTCCTCTCCCGAGTTTTT-3′; Reverse: 5′-TGCTGGGGCTTCCAAAATGT-3′), Bcl6 (Forward: 5′-GTTTCCGGCACCTTCAGACT-3′; Reverse: 5′-CTGGCTTTTGTGACGGAAAT-3′), BATF (Forward: 5′-TGGCAAACAGGACTCATCTG-3′; Reverse: 5′-CTGTTTCTCCAGGTCTTCGC-3′), SAP (Forward: 5′-GCTATTTGCTGAGGGACAGC-3′; Reverse: 5′-TGTCTGGGACACTCGGTATG-3′), Blimp-1 (Forward: 5′-AACTTCTTGTGTGGTATTGTCGG- 3′; Reverse: 5′-TCTCAGTGCTCGGTTGCTTT-3′). Expression levels relative to control gene RPL13A were calculated.
RNA sequencing
RNA was isolated from 800-1000 cells from sorted T cell subpopulations as described. 5uL of total RNA were placed in wells of a 96-well plate and RNA sequencing libraries were prepared at Broad Technology Labs at the Broad Institute of Harvard and MIT using the Illumina SmartSeq2 platform. Samples were sequenced on a NextSeq500 using 75bp paired-end reads to an average depth of 9M pairs of reads per sample. All cDNA transcripts from Ensembl release 82 were quantified with Kallisto version 0.42.426. We used limma to model each gene as a linear combination of donor-specific effects. The residuals from these models were tested by ANOVA across 8 gates, and 581 genes with a significant F statistic with <5% FDR were selected for PCA. Heatmaps show row-normalized relative gene expression z-scores across columns (mean 0 and variance 1), with subpopulations of PD-1hi CXCR5- or PD-1hi CXCR5+ averaged to yield overall PD-1hi CXCR5- and PD-1hi CXCR5+ expression values. In comparisons of specific cell populations, genes with log fold change >1.2 and FDR <1% were considered differentially expressed.
PD-1hi cell in vitro stimulation assays
CD4+ T cells were purified from PBMCs from blood bank leukoreduction collars by magnetic bead negative selection and stained with anti-CD4-BV650, anti-CD45RA-BV510, anti-PD-1-APC, anti-CXCR5-BV605, and anti-CCR2-PE/Cy7. Naïve CD4+ T cells and memory CD4+ T cell subpopulations were sorted into RPMI/10% FBS. 50,000 cells were resuspended in RPMI/10%FBS at 0.25 × 10⁶ cells/mL and cultured with anti-CD3/CD28 beads (Dynabeads) at a cell:bead ratio of 5:1 for 2 or 7 days. Cells were then either re-stained with anti-PD-1-PE and anti-CXCR5-BV421 antibodies and sorted into lysis buffer for RT-PCR analyses, or stained with CCR2-PE and CXCR5-BV421 and analyzed by intracellular flow cytometry for transcription factors as above.
T cell-B cell co-cultures
Total B cells were isolated first from PBMCs from blood bank leukoreduction collars by magnetic bead positive selection using CD19 (Miltenyi), then CD4+ T cells were isolated by negative selection. B cells were stained with CD14-APC, CD3-PeCy7, and CD27-BV510 (all from Biolegend), and memory B cells sorted as CD27+ CD14- CD3- cells on a BD FACSAria Fusion to remove contaminating T cells and monocytes. Sorted T cell populations were co-cultured with autologous memory B cells at a ratio of 1:10 in 100uL of RPMI/10%FBS and stimulated with LPS (5μg/mL) and SEB (1μg/mL) for 7 days. For co-cultures using synovial tissue or synovial fluid T cells, allogeneic memory B cells from PBMC were used. Supernatants were collected and total IgG measured by ELISA (eBioscience). Cells were harvested and analyzed by flow cytometry, with plasmablasts defined as CD19+ CD20low CD38hi CD27+ and plasma cells defined as CD19+ CD20low CD38hi CD27+ CD138+. For blocking experiments, 10μg/ml anti-SLAMF5 or anti-SLAMF6 antibodies (Biolegend) or 20μg/mL IL-21R-Ig (R&D Systems) were used.
Immunofluorescence microscopy
6 micron sections of synovium frozen in OCT were fixed in acetone, rehydrated in PBS, and blocked with 10% normal goat serum prior to application of primary antibodies as follows: PD-1 (EH12.2H7, BioLegend), CD3 (SP7, Abcam), CD20 (L26, Dako), CXCR5 (MAB190, R&D Systems), all at a dilution of 1:100 except for CD20, which was used at 1:300. All secondary antibodies were raised in goat. CXCR5 was detected using anti mouse IgG2b biotin (Southern biotech) followed by streptavidin conjugated AlexaFluor 546 (Life Technologies), CD20 with anti-mouse IgG2a FITC (both Southern Biotech), PD-1 with anti-mouse IgG1 conjugated to AlexaFluor 647 and CD3 with anti-rabbit AlexaFluor 546 (both Life Technologies). FITC staining was amplified with anti-FITC AlexaFluor 488 (Life Technologies). Slides were mounted using ProLong Diamond (Life Technologies), left to cure overnight and imaged using a Zeiss LSM 780 confocal microscope. Images were processed using Zen Black (Zeiss) and then ImageJ. Cell counts were performed on images obtained from confocal imaging using the Cell Counter plugin for ImageJ (imagej.net/Cell_Counter). Synovial regions were categorized as ‘lymphoid aggregates’ when the B cells and T cells formed distinct clusters, and ‘diffusely infiltrated’ when B cells were loosely distributed within the synovium.
Statistical analyses
Statistical comparisons were performed as indicated in figure legends using two-sided tests. P-values < 0.05 were considered significant after adjusting for multiple testing using the Bonferroni correction for ANOVA (Fig. 2d) and blood mass cytometry analysis (Fig. 3b), or Dunn's test for non-parametric multi-group comparisons
Data availability
The RNA-seq dataset is available at the ImmPort repository, accession number SDY939 (https://www.immport.org/immport-open/public/study/study/displayStudyDetail/SDY939).
The data that support the findings of this study are available from the corresponding author upon reasonable request.
Extended Data
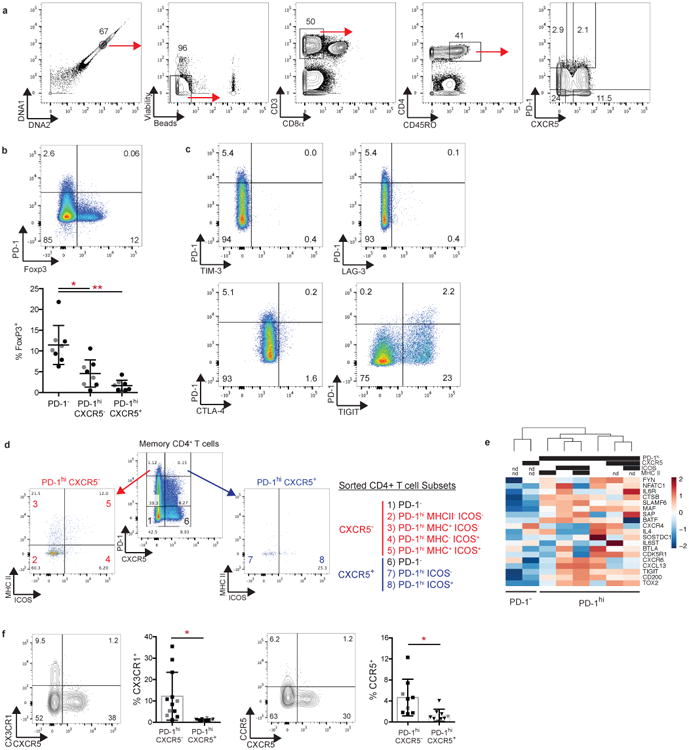
Extended Data Figure 1. Detection of PD-1hi CD4+ T cells in RA synovial tissue and fluid by mass and flow cytometry.

a) viSNE plots of mass cytometry of RA synovial tissue CD4+ T cells as in Fig. 1a from 2 additional donors. b) Gating strategy to identify synovial tissue PD-1hi CD4+ T cell populations by mass cytometry. c) viSNE plots of flow cytometry of paired RA synovial fluid and blood memory CD4+ T cells. d) Gating strategy to identify synovial fluid PD-1hi memory CD4+ T cells by flow cytometry. e) Examples of gating used to sort memory CD4+ T cell populations from patient samples. f) Detection of CXCR5 mRNA by RT-PCR in sorted memory CD4+ T cell populations from synovial tissue (n=3 donors, 2 of which provided sufficient PD-1hi CXCR5+ cells for analysis), synovial fluid (n=3 donors, 1 of which provided sufficient PD-1hi CXCR5+ cells for analysis), and blood (n=2 donors). Purple boxes indicate PD-1- and PD-1hi CXCR5+ cells sorted from human tonsil as controls. Lines in (f) indicate mean for synovial or blood samples.
Extended Data Figure 2. PD-1hi CXCR5- CD4+ T cells are expanded in circulation of patients with active, seropositive RA and decrease with response to therapy.

a) Mean expression of MHC II and ICOS in memory CD4+ T cell populations from synovial tissue (n=10), synovial fluid (n=9), and blood (n=42) from seropositive RA patients. Mean ± SD shown. b) Flow cytometric detection of PD-1 and CXCR5 expression on blood memory CD4+ T cells. c-e) Frequency of PD-1hi cells that co-express MHC II or ICOS (c), PD-1hi CXCR5+ cells (d) or cells with intermediate PD-1 expression (e) within memory CD4+ T cells from blood of patients with seropositive RA (n=42), seronegative RA (n=16), spondyloarthropathy (SpA, n=11), and non-inflammatory controls (n=35). f) Correlation between age or disease duration and blood PD-1hi CXCR5- cell frequency in seropositive RA patients (n=38). g) PD-1hi CXCR5- cell frequencies in seropositive RA patients segregated based on sex or medication usage (n=38). h) Correlation between serum anti-CCP antibody titer and blood PD-1hi CXCR5- cell frequency in all RA patients (n=53, black line, p=0.0049) or in only anti-CCP antibody+ patients (n=29, green line, p=0.48). i) Correlation between fold change in CDAI and fold change in PD-1hi CXCR5- cell frequency in patients 3 months after addition of a new RA medication (n=23; methotrexate=11, anti-TNF=4, abatacept=4, tocilizumab=2, tofacitinib=2). j) Frequency of PD-1hi T cell subpopulations in blood before and after RA treatment escalation in 18 patients with reduced disease activity after therapy. Median ± interquartile range in c,d,e; mean ± SD in a,g shown. * p<0.05, ** p<0.01, *** p<0.001, **** p<0.0001 by Mann-Whitney (c,g), Kruskal-Wallis (d,e), Wilcoxon test (j). In f,h,i p-values calculated by Spearman correlation.
Extended Data Figure 3. Blood PD-1hi CXCR5- CD4+ T cells express factors associated with B cell help.

a) RT-PCR for intracellular regulators in memory CD4+ T cell populations from RA synovial fluid (n=5 or 6 donors). b) RT-PCR for cytokines (n=10 donors, 6 RA patients (black), 4 controls (grey)) and intracellular regulators (n=4 or 5 donors) in memory CD4+ T cell populations from blood. c) Cytokine and transcription factor mRNA expression in blood PD-1hi memory CD4+ T cell populations divided according to CXCR5 expression, relative to PD-1- cells (n=6 donors). d) Flow cytometric quantification of Bcl6 and Blimp-1 in blood PD-1hi memory CD4+ T cell subpopulations sorted according to chemokine receptor expression, then stimulated in vitro for 2 days with anti-CD3/CD28 beads. Representative data from 1 of 3 experiments using cells from different donors. Median ± interquartile range in a,b; mean ± SD in c,d shown. * p<0.05, ** p<0.01, *** p<0.001 by Friedman's test, compared to PD-1- MHCII- group (a,b).
Extended Data Figure 4. Identification and characterization of circulating PD-1hi CXCR5- and PD-1hi CXCR5+ in mass cytometry and RNA-seq analyses.
a) Gating of blood PD-1hi memory CD4+ T cells in mass cytometry analyses. b) Flow cytometric detection of FoxP3 and PD-1 in blood memory CD4+ T cells from RA patients (black, n=5) and controls (grey, n=3). c) Flow cytometric detection of inhibitory receptors on blood CXCR5- memory CD4+ T cells. Data from 1 of 3 RA patients with similar results. d) Sorting strategy for PD-1hi CXCR5- and PD-1hi CXCR5+ cell populations for RNA-seq. e) Hierarchical clustering T cell subpopulations sorted as in (d), with clustering based on expression of Tfh-associated genes measured by RNA-seq. f) Chemokine receptor expression on blood memory CD4+ T cells from RA patients (black) or controls (grey) by flow cytometry. Mean ± SD shown. * p<0.05, **p<0.001, *** p<0.0001 by Kruskal-Wallis test compared to PD-1- cells (b) or Wilcoxon test (f).
Extended Data Figure 5. Limited interconversion of PD-1hi CCR2+ and PD-1hi CXCR5+ T cells in vitro.

a) Flow cytometry of CXCR5 and CCR2 on gated PD-1hi memory CD4+ T cells from blood. b) Expression of CXCR5 and CCR2 on indicated sorted PD-1hi T cell populations 7 days after in vitro stimulation with anti-CD3/CD28 beads. c,d) Percentage of cells from each sorted PD-1hi population that expressed CXCR5 or CCR2 on day 2 (c) or day 7 (d) after in vitro stimulation. Naive CD4+ T cells are shown as control. Mean ± SD shown (n=3 donors from 3 separate experiments).
Extended Data Figure 6. SLAMF5 is required for B cell-helper function of PD-1hi CXCR5- CD4+ T cells.

a) Flow cytometric quantification of SLAM, SLAMF5, and SLAMF6 expression on memory CD4+ T cells (n=10 donors; 5 RA patients, 5 controls). b) Quantification of frequency of memory B cells with plasma cell markers after co-culture with PD-1hi CXCR5+ CD4+ T cells with addition of blocking antibodies against SLAMF5 and/or SLAMF6. c) IgG quantification by ELISA in co-cultures of memory B cells with PD-1hi CXCR5- or PD-1hi CXCR5+ T cells with addition of blocking antibodies against SLAMF5 and/or SLAMF6. For b,c) 1 of 3 experiments with similar results (n=3 replicates shown). Mean ± SD shown. * p<0.05, ** p<0.01, *** p<0.001 by Kruskal-Wallis compared to PD-1- CXCR5- (a) or isotype control (b,c). d) Immunofluorescence microscopy of CD20 (green), CXCR5 (red), and PD-1 (blue), in seropositive RA synovial tissue. Arrows point to PD-1hi CXCR5- cells adjacent to B cells. Scale bar = 50 microns.
Extended Data Table 1. Mass cytometry panels for analysis of synovial and blood cells.
| Synovial Panel | Blood Cell Panel | |||
|---|---|---|---|---|
| Metal | Target | Clone | Target | Clone |
| 89Y | CD45 | HI30 | ||
| 103Rh | Live/Dead | Cell-ID | ||
| 141Pr | CD27 | M-T271 | CD27 | M-T271 |
| 142Nd | CD19 | HIB19 | CD45RA | HI100 |
| 143Nd | RANKL | MIH24 | CD44 | BJ18 |
| 144Nd | CD64 | 10.1 | CD39 | A1 |
| 145Nd | CD16 | 3G8 | CD16 | 3G8 |
| 146Nd | CD8α | RPA T8 | CD8α | RPA T8 |
| 147Sm | FAP | Poly | CD45RO | UCHL1 |
| 148Nd | CD20 | 2H7 | CD28 | CD28.2 |
| 149Sm | CD45RO | UCHL1 | CD25 | M-A251 |
| 150Nd | CD38 | HIT2 | ||
| 151Eu | PD-1 | EH12.2H7 | PD-1 | EH12.2H7 |
| 152Sm | CD14 | M5E2 | ||
| 153Eu | CD69 | FN50 | CD69 | FN50 |
| 154Sm | CXCR5 | J252D4 | CXCR5 | J252D4 |
| 155Gd | CD4 | RPA T4 | CD4 | RPA T4 |
| 156Gd | Podoplanin | NC-08 | CD73 | AD2 |
| 158Gd | CD3 | UCHT1 | CD3 | UCHT1 |
| 159Tb | CD11c | Bu15 | CD57 | HCD57 |
| 160Gd | FcRL4 | 413D12 | ICOS | C398.4A |
| 161Dy | CD138 | MI15 | ||
| 162Dy | CD90 | 5E 10 | CXCR3 | G025H7 |
| 163Dy | CCR2 | K036C2 | ||
| 164Dy | Cadherin11 | 23C6 | CD161 | HP-3G10 |
| 165Ho | FoxP3 | PCH101 | FoxP3 | PCH101 |
| 166Er | CD34 | 581 | ||
| 167Er | CD146 | SHM-57 | CD38 | HIT2 |
| 168Er | IgA | 9H9H11 | CCR6 | G034E3 |
| 169Tm | TCRγδ | B1 | CCR7 | G043H7 |
| 170Er | ICOS | C398.4A | ||
| 171Yb | CD66b | G10F5 | CD127 | A019D5 |
| 172Yb | IgM | MHM-88 | CD122 | TU27 |
| 173Yb | CD144 | BV9 | TIGIT | MBSA43 |
| 174Yb | MHCII | L243 | HLA-DR | L243 |
| 175Lu | IgD | IA6-2 | Tbet | 4B10 |
| 176Yb | VCAM-1 | STA | Perforin | dG9 |
| 195Pt | Live/Dead | Cell-ID | ||
Extended Data Table 2. Clinical characteristics of evaluated patients.
Synovial tissue samples from patients 1-6 were used for mass and flow cytometry phenotyping. Samples from patients 7-10 were also included in flow cytometry phenotyping. Average ± SD shown. Parentheses indicate percentage of patients. Other biologics include abatacept, rituximab, tocilizumab, and tofacitinib.
| Patient | #1 | #2 | #3 | #4 | #5 | #6 | #7 | #8 | #9 | #10 | |
|---|---|---|---|---|---|---|---|---|---|---|---|
| Synovial Tissue Donors | Age | 57 | 54 | 76 | 46 | 46 | 79 | 62 | 63 | 52 | 43 |
| Sex | F | F | F | F | F | F | M | M | F | F | |
| Disease | |||||||||||
| Duration (years) | 13 | 17 | 4 | 8 | 19 | 0.5 | 19 | 8 | N/A | N/A | |
| CDAI | 14 | 9 | 17 | 15 | 21 | 25 | 5 | 9 | N/A | N/A | |
| CRP (mg/L) | 25 | 8 | 8 | 11 | 17 | 19 | 13 | 66 | 76 | 0.8 | |
| Methotrexate | No | Yes | No | No | No | No | No | Yes | No | No | |
| Biologic therapy | Yes | Yes | Yes | Yes | Yes | No | No | No | No | Yes | |
| Other synthetic | |||||||||||
| DMARD | Yes | No | Yes | No | Yes | No | No | No | Yes | No | |
|
| |||||||||||
| Samples from patients 1-6 were used for mass and flow cytometry phenotyping. | |||||||||||
| Samples from patients 7-10 were also included in flow cytometry phenotyping. | |||||||||||
|
| |||||||||||
| Control | Seropositive RA | Seronegative RA | Spondyloarthropathy | ||||||||
|
| |||||||||||
| Blood Cross-sectional cohort | Number | 35 | 42 | 16 | 11 | ||||||
| Age | 61 ± 13 | 58 ± 14 | 58 ± 13 | 48 ± 12 | |||||||
| Female | 22 (63) | 33 (78) | 11 (69) | 5 (45) | |||||||
| Disease Duration (years) | N/A | 13 ± 9 | 14 ± 10 | 10 ± 6 | |||||||
| CRP (mg/L) | ND | 9.3 ± 17.4 | 6.3 ± 8.5 | 3.9 ± 4.2 | |||||||
| CDAI | ND | 13.7 ± 8.1 | 9.8 ± 7.6 | ND | |||||||
| Methotrexate | 0 | 19 (45) | 8 (50) | 2 (18) | |||||||
| Anti-TNF | 0 | 16 (38) | 6 (38) | 10 (90) | |||||||
| Other biologics | 0 | 10 (24) | 5 (31) | 0 | |||||||
| Other synthetic DMARD | 0 | 4 (10) | 1 (6) | 0 | |||||||
|
| |||||||||||
| Average ± SD shown. Parentheses indicate percentage of patients. Other biologics include abatacept, rituximab, tocilizumab, tofacitinib. | |||||||||||
|
| |||||||||||
| Improved | Not Improved | ||||||||||
|
| |||||||||||
| Blood Longitudinal cohort | Number | 18 | 5 | ||||||||
| Age | 49 ± 17 | 57 ± 10 | |||||||||
| Female | 17 (94) | 4 (80) | |||||||||
| CDAI Before | 17.6 ± 9.3 | 21.7 ± 8.9 | |||||||||
| CDAI After | 6.3 ± 4.2 | 25.6 ± 10.2 | |||||||||
| Started methotrexate | 7 | 4 | |||||||||
| Started anti-TNF | 4 | 0 | |||||||||
| Started other biologic | 7 | 1 | |||||||||
|
| |||||||||||
| Average ± SD shown. Parentheses indicate percentage of patients. | |||||||||||
Extended Data Table 3. Significantly differentially expressed genes between PD-1- and PD-1hi cell populations.
| Gene | logFC PD-1neg vs PD-1hi | p-value | adjusted p-value |
|---|---|---|---|
| PD-1 | -6.39 | 1.03E-17 | 2.07E-13 |
| TOX | -3.97 | 7.21E-13 | 7.21E-09 |
| ITM2A | -1.21 | 4.54E-10 | 3.02E-06 |
| TIGIT | -1.92 | 1.03E-09 | 5.15E-06 |
| MAF | -1.42 | 4.43E-09 | 1.77E-05 |
| CA6 | 3.05 | 6.13E-09 | 2.04E-05 |
| CST7 | -3.16 | 1.47E-08 | 3.80E-05 |
| SCML1 | 3.90 | 1.71E-08 | 3.80E-05 |
| SCO2 | -5.20 | 1.67E-08 | 3.80E-05 |
| CDCA7 | -4.50 | 2.56E-08 | 5.12E-05 |
| RAB37 | -1.57 | 6.90E-08 | 1.15E-04 |
| ICA1 | -2.95 | 2.32E-07 | 3.24E-04 |
| EZH2 | -3.02 | 2.43E-07 | 3.24E-04 |
| GZMK | -2.75 | 2.68E-07 | 3.35E-04 |
| MAP3K9 | -2.36 | 4.44E-07 | 5.22E-04 |
| PFN1 | -1.46 | 7.05E-07 | 7.05E-04 |
| SLAMF6 | -1.24 | 8.88E-07 | 8.18E-04 |
| EPSTI1 | -2.04 | 8.99E-07 | 8.18E-04 |
| NEFL | 4.05 | 1.14E-06 | 9.90E-04 |
| CHN1 | -3.45 | 1.22E-06 | 1.01E-03 |
| UBE2L6 | -1.23 | 1.55E-06 | 1.14E-03 |
| FANCI | -2.79 | 1.77E-06 | 1.26E-03 |
| PSMA4 | -1.42 | 2.22E-06 | 1.48E-03 |
| TOX2 | -3.64 | 2.72E-06 | 1.70E-03 |
| FABP5 | -2.44 | 3.07E-06 | 1.81E-03 |
| ANXA2 | -1.27 | 3.38E-06 | 1.93E-03 |
| CTLA4 | -1.74 | 4.31E-06 | 2.33E-03 |
| PLAG1 | 3.60 | 4.77E-06 | 2.51E-03 |
| HVCN1 | -3.52 | 5.08E-06 | 2.61E-03 |
| FAM210A | -2.78 | 5.37E-06 | 2.68E-03 |
| ALOX5 | 3.44 | 5.88E-06 | 2.80E-03 |
| RGS1 | -1.20 | 6.09E-06 | 2.83E-03 |
| MYL6B | -3.07 | 8.27E-06 | 3.65E-03 |
| CEP128 | -3.16 | 8.18E-06 | 3.65E-03 |
| ENC1 | -3.61 | 8.40E-06 | 3.65E-03 |
| MIS18BP1 | -2.07 | 8.89E-06 | 3.78E-03 |
| F5 | -1.46 | 1.00E-05 | 4.05E-03 |
| FN1 | 2.50 | 1.07E-05 | 4.05E-03 |
| CXCR3 | -3.02 | 1.06E-05 | 4.05E-03 |
| ASB13 | 3.35 | 1.06E-05 | 4.05E-03 |
| HIST2H2BF | 3.68 | 9.85E-06 | 4.05E-03 |
| PRR5L | -2.17 | 1.10E-05 | 4.08E-03 |
| KRT72 | 3.19 | 1.24E-05 | 4.43E-03 |
| BZRAP1 | -1.97 | 1.37E-05 | 4.81E-03 |
| DUSP2 | -1.46 | 1.55E-05 | 5.33E-03 |
| DHFR | -2.73 | 1.74E-05 | 5.62E-03 |
| FBXO41 | -2.41 | 1.94E-05 | 6.14E-03 |
| CCDC86 | -3.43 | 1.99E-05 | 6.21E-03 |
| FCRL3 | -1.77 | 2.06E-05 | 6.27E-03 |
| AKR1C3 | -3.31 | 2.07E-05 | 6.27E-03 |
| SHMT2 | -1.53 | 2.17E-05 | 6.38E-03 |
| DDX54 | -1.73 | 2.21E-05 | 6.41E-03 |
| UBE2A | -1.32 | 2.88E-05 | 7.68E-03 |
| ANXA9 | 2.92 | 2.85E-05 | 7.68E-03 |
| TUBB4B | -1.24 | 3.12E-05 | 8.10E-03 |
| TIMELESS | -2.61 | 3.24E-05 | 8.26E-03 |
| CCL5 | -3.36 | 3.26E-05 | 8.26E-03 |
| UQCRC1 | -1.29 | 3.42E-05 | 8.44E-03 |
| TBC1D4 | -1.30 | 3.49E-05 | 8.51E-03 |
| SYT11 | -1.38 | 3.88E-05 | 9.23E-03 |
| PMAIP1 | -2.19 | 3.84E-05 | 9.23E-03 |
| DIRC2 | -2.78 | 4.00E-05 | 9.30E-03 |
| SOX8 | 1.94 | 4.26E-05 | 9.80E-03 |
| SPG20 | 1.80 | 4.50E-05 | 9.90E-03 |
| DPP3 | -1.96 | 4.39E-05 | 9.90E-03 |
| DUSP4 | -2.50 | 4.50E-05 | 9.90E-03 |
Extended Data Table 4. Significantly differentially expressed genes between PD-1hi CXCR5- and PD-1hi CXCR5+ cell populations.
| Gene | logFC PD-1hi CXCR5neg vs PD-1hi CXCR5pos | p-value | adjusted p-value |
|---|---|---|---|
| RPL39 | -1.23 | 1.42E-07 | 2.30E-04 |
| LSP1 | 1.20 | 2.65E-07 | 2.94E-04 |
| RPL34 | -1.27 | 7.88E-07 | 4.77E-04 |
| TTC4 | 4.63 | 1.29E-06 | 6.30E-04 |
| LIME1 | 1.56 | 2.07E-06 | 9.20E-04 |
| CCR2 | 5.09 | 2.25E-06 | 9.58E-04 |
| ACTN4 | 2.32 | 2.83E-06 | 1.13E-03 |
| CTSH | 2.65 | 3.19E-06 | 1.25E-03 |
| PLAC8 | -1.35 | 6.85E-06 | 2.36E-03 |
| GLIPR2 | 1.40 | 7.14E-06 | 2.38E-03 |
| PRR5 | 2.82 | 1.02E-05 | 3.06E-03 |
| RGS19 | 2.46 | 1.19E-05 | 3.45E-03 |
| SAMD3 | 1.25 | 2.50E-05 | 6.51E-03 |
| FOS | -1.60 | 3.68E-05 | 8.77E-03 |
| ANXA4 | 2.27 | 4.03E-05 | 9.37E-03 |
| LTK | 3.89 | 4.20E-05 | 9.66E-03 |
Acknowledgments
This work was supported by T32 AR007530-31 and the William Docken Inflammatory Autoimmune Disease Fund (to M.B.B), Mallinckrodt Research Fellowship (to D.A.R), R01 AR064850-03 (to Y.C.L), NIH 5U01GM092691-05, 1U19 AI111224-01 and Doris Duke Charitable Foundation Grant #2013097 (to S.R.), Rheumatology Research Foundation Scientist Development Award (to L.A.H.), K01 AR066063 (to L.T.D.), Arthritis Research UK programme grant #19791 (to C.D.B), and Arthritis Research UK Clinician Scientist Fellowship #18547 (to A.F). J.L.M was supported by the FP7-HEALTH-F2-2012-305549 EuroTEAM. P.A.N. was supported by P30 AR070253 and the Fundación Bechara. We thank Adam Chicoine and the BWH Human Immunology Center Flow Cytometry Core for cell sorting assistance.
Footnotes
Author Contributions: D.A.R conceived of the project, performed experiments, analyzed data, and wrote the manuscript. M.F.G., Y.L., N.T., and F.M. performed experiments and analyzed data. K.S. analyzed transcriptomic data. C.F. analyzed mass cytometry data. J.L.M. performed immunofluorescence microscopy. J.A.L. assisted with mass cytometry. K.W., L.A.H., P.A.N., M.E.W., Y.C.L., J.S.C., D.J.T., E.M.M., S.M.H., E.W.K., L.T.D., V.P.B., L.B.I., S.M.G., A.B.P., A.F., and C.D.B participated in study design, patient recruitment and sample acquisition. M.B.B. and S.R. conceived of the project, supervised the work, analyzed data, and co-wrote the manuscript. All authors discussed the results and commented on the manuscript.
The authors have no competing financial interests.
References
- 1.Maecker HT, McCoy JP, Nussenblatt R. Standardizing immunophenotyping for the Human Immunology Project. Nature reviews Immunology. 2012;12:191–200. doi: 10.1038/nri3158. [DOI] [PMC free article] [PubMed] [Google Scholar]
- 2.McInnes IB, Schett G. The pathogenesis of rheumatoid arthritis. The New England journal of medicine. 2011;365:2205–2219. doi: 10.1056/NEJMra1004965. 10.7748/phc2011.11.21.9.29.c8797. [DOI] [PubMed] [Google Scholar]
- 3.Crotty S. Follicular helper CD4 T cells (TFH) Annual review of immunology. 2011;29:621–663. doi: 10.1146/annurev-immunol-031210-101400. [DOI] [PubMed] [Google Scholar]
- 4.Cannons JL, et al. Optimal germinal center responses require a multistage T cell:B cell adhesion process involving integrins, SLAM-associated protein, and CD84. Immunity. 2010;32:253–265. doi: 10.1016/j.immuni.2010.01.010. [DOI] [PMC free article] [PubMed] [Google Scholar]
- 5.Amir el AD, et al. viSNE enables visualization of high dimensional single-cell data and reveals phenotypic heterogeneity of leukemia. Nature biotechnology. 2013;31:545–552. doi: 10.1038/nbt.2594. [DOI] [PMC free article] [PubMed] [Google Scholar]
- 6.Takemura S, et al. Lymphoid neogenesis in rheumatoid synovitis. Journal of immunology. 2001;167:1072–1080. doi: 10.4049/jimmunol.167.2.1072. [DOI] [PubMed] [Google Scholar]
- 7.Humby F, et al. Ectopic lymphoid structures support ongoing production of class-switched autoantibodies in rheumatoid synovium. PLoS medicine. 2009;6:e1. doi: 10.1371/journal.pmed.0060001. [DOI] [PMC free article] [PubMed] [Google Scholar]
- 8.Wherry EJ, Kurachi M. Molecular and cellular insights into T cell exhaustion. Nature reviews Immunology. 2015;15:486–499. doi: 10.1038/nri3862. [DOI] [PMC free article] [PubMed] [Google Scholar]
- 9.Kamphorst AO, Ahmed R. Manipulating the PD-1 pathway to improve immunity. Current opinion in immunology. 2013;25:381–388. doi: 10.1016/j.coi.2013.03.003. [DOI] [PMC free article] [PubMed] [Google Scholar]
- 10.Johnston RJ, et al. Bcl6 and Blimp-1 are reciprocal and antagonistic regulators of T follicular helper cell differentiation. Science. 2009;325:1006–1010. doi: 10.1126/science.1175870. [DOI] [PMC free article] [PubMed] [Google Scholar]
- 11.Kroenke MA, et al. Bcl6 and Maf cooperate to instruct human follicular helper CD4 T cell differentiation. Journal of immunology. 2012;188:3734–3744. doi: 10.4049/jimmunol.1103246. [DOI] [PMC free article] [PubMed] [Google Scholar]
- 12.DeGrendele HC, Estess P, Siegelman MH. Requirement for CD44 in activated T cell extravasation into an inflammatory site. Science. 1997;278:672–675. doi: 10.1126/science.278.5338.672. [DOI] [PubMed] [Google Scholar]
- 13.Forster R, et al. CCR7 coordinates the primary immune response by establishing functional microenvironments in secondary lymphoid organs. Cell. 1999;99:23–33. doi: 10.1016/s0092-8674(00)80059-8. [DOI] [PubMed] [Google Scholar]
- 14.Chtanova T, et al. T follicular helper cells express a distinctive transcriptional profile, reflecting their role as non-Th1/Th2 effector cells that provide help for B cells. Journal of immunology. 2004;173:68–78. doi: 10.4049/jimmunol.173.1.68. [DOI] [PubMed] [Google Scholar]
- 15.Locci M, et al. Human circulating PD-1+CXCR3-CXCR5+ memory Tfh cells are highly functional and correlate with broadly neutralizing HIV antibody responses. Immunity. 2013;39:758–769. doi: 10.1016/j.immuni.2013.08.031. [DOI] [PMC free article] [PubMed] [Google Scholar]
- 16.Weinstein JS, et al. Global transcriptome analysis and enhancer landscape of human primary T follicular helper and T effector lymphocytes. Blood. 2014;124:3719–3729. doi: 10.1182/blood-2014-06-582700. [DOI] [PMC free article] [PubMed] [Google Scholar]
- 17.Kenefeck R, et al. Follicular helper T cell signature in type 1 diabetes. The Journal of clinical investigation. 2015;125:292–303. doi: 10.1172/JCI76238. [DOI] [PMC free article] [PubMed] [Google Scholar]
- 18.Kuziel WA, et al. Severe reduction in leukocyte adhesion and monocyte extravasation in mice deficient in CC chemokine receptor 2. Proceedings of the National Academy of Sciences of the United States of America. 1997;94:12053–12058. doi: 10.1073/pnas.94.22.12053. [DOI] [PMC free article] [PubMed] [Google Scholar]
- 19.Rot A, von Andrian UH. Chemokines in innate and adaptive host defense: basic chemokinese grammar for immune cells. Annual review of immunology. 2004;22:891–928. doi: 10.1146/annurev.immunol.22.012703.104543. [DOI] [PubMed] [Google Scholar]
- 20.Vu Van D, et al. Local T/B cooperation in inflamed tissues is supported by T follicular helper-like cells. Nature communications. 2016;7:10875. doi: 10.1038/ncomms10875. [DOI] [PMC free article] [PubMed] [Google Scholar]
- 21.Pitzalis C, Jones GW, Bombardieri M, Jones SA. Ectopic lymphoid-like structures in infection, cancer and autoimmunity. Nature reviews Immunology. 2014;14:447–462. doi: 10.1038/nri3700. [DOI] [PubMed] [Google Scholar]
- 22.Kobayashi S, et al. A distinct human CD4+ T cell subset that secretes CXCL13 in rheumatoid synovium. Arthritis and rheumatism. 2013;65:3063–3072. doi: 10.1002/art.38173. [DOI] [PubMed] [Google Scholar]
- 23.Manzo A, et al. Mature antigen-experienced T helper cells synthesize and secrete the B cell chemoattractant CXCL13 in the inflammatory environment of the rheumatoid joint. Arthritis and rheumatism. 2008;58:3377–3387. doi: 10.1002/art.23966. [DOI] [PubMed] [Google Scholar]
- 24.Shen P, Fillatreau S. Antibody-independent functions of B cells: a focus on cytokines. Nature reviews Immunology. 2015;15:441–451. doi: 10.1038/nri3857. [DOI] [PubMed] [Google Scholar]
Methods References
- 25.Finck R, et al. Normalization of mass cytometry data with bead standards. Cytometry Part A: the journal of the International Society for Analytical Cytology. 2013;83:483–494. doi: 10.1002/cyto.a.22271. [DOI] [PMC free article] [PubMed] [Google Scholar]
- 26.Bray N, P H, Melsted P, Pachter L. Near-optimal RNA-Seq quantification. arXiv. 2015;1505 02710v02712. [Google Scholar]
Associated Data
This section collects any data citations, data availability statements, or supplementary materials included in this article.
Data Availability Statement
The RNA-seq dataset is available at the ImmPort repository, accession number SDY939 (https://www.immport.org/immport-open/public/study/study/displayStudyDetail/SDY939).
The data that support the findings of this study are available from the corresponding author upon reasonable request.