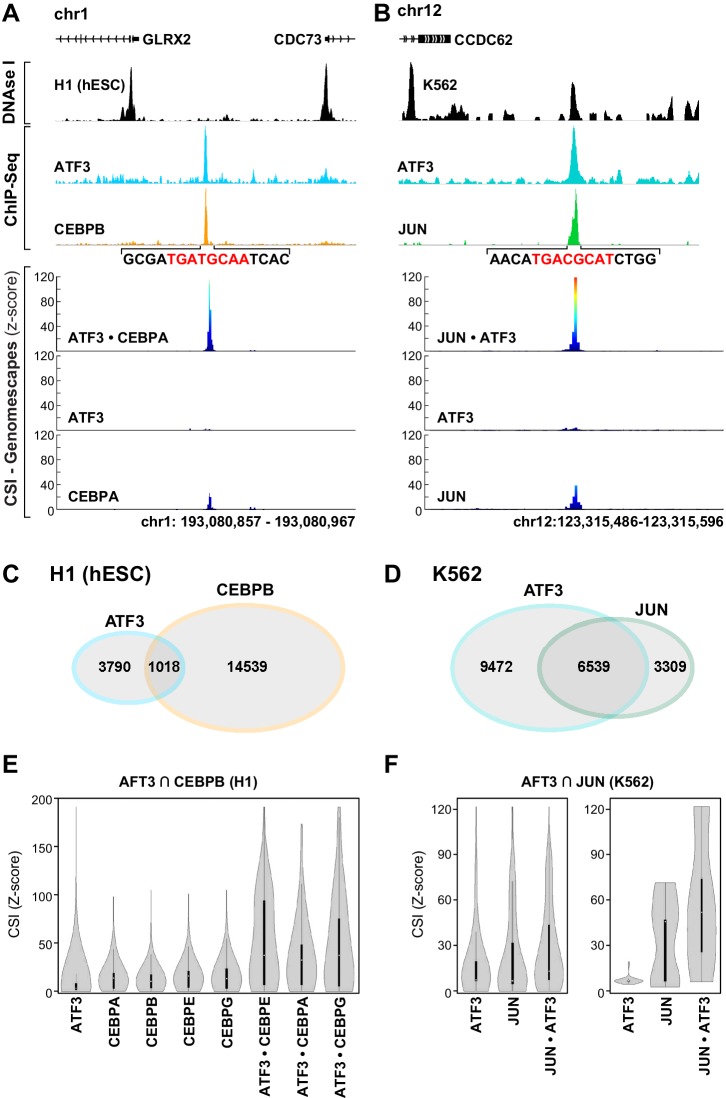
Figure 6. bZIP heterodimer DNA sites are bound in vivo.
(A) ChIP-seq traces for ATF3 (blue) and CEBPB (orange) and DNase I hypersensitivity (black) trace for in H1 human embryonic stem cells. Below, CSI-Genomescape for bound genomic regions for ATF3 and CEBPA homodimers and ATF3•CEPBA heterodimer. CEBPA and CEBPB share 76% identity over their bZIP domain. (B) ChIP-seq traces for ATF3 (blue) and JUN (green) and DNAse I hypersensitivity trace (black) in K562 cells. Below, CSI-Genomescape for bound genomic region for ATF3 and JUN homodimers, and for JUN•ATF3 heterodimer. (C) Venn diagram of bound regions (ChIP-seq peaks) for ATF3 and CEBPB in H1hESC and for (D) ATF3 and JUN in K562 cells. (E) Violin plots of CSI-seq scores for the ChIP-seq peaks derived from the intersection of ATF3 and CEBPB ChIP peaks (1018 overlapping peaks) in H1 stem cells using in vitro data for ATF3, CEBPA, CEBPB (from Jolma et al.) (Jolma et al., 2013), CEBPE, CEBPG homodimers and ATF3•CEBPA, ATF3•CEBPE, and ATF3•CEBPG heterodimers. CSI intensities were quantile normalized. (F) Violin plots of CSI-seq scores for the ChIP-seq peaks derived from the intersection of ATF3 and JUN ChIP peaks (left, 6539 overlapping peaks) in K562 cells, left. Violin plots for the subset of overlapping peaks of ATF3 and JUN containing a match for the heterodimer-specific site TGACGCAT (39 peaks), right. Peaks were scored using ATF3 and JUN homodimers, and JUN•ATF3 heterodimers.


