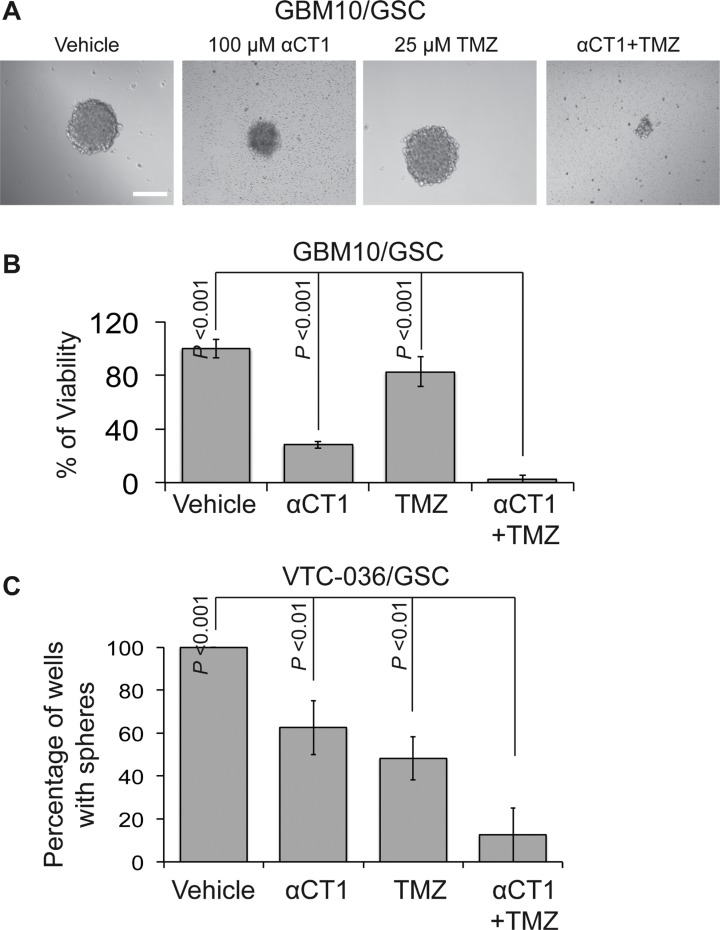
Figure 8. The effect of αCT1 and TMZ in GBM10/GSCs and VTC-036/GSCs.
(A) GBM10/GSCs treated with αCT1 and/or TMZ were imaged using a 40 X lens of an inverted microscope. Scale bar is 10 μm. (B) The viability of GBM10/GSCs determined by the MTS viability assay. (C) The sphere formation of VTC-036/GSCs. Error bars represent standard deviations from three independent experiments.

