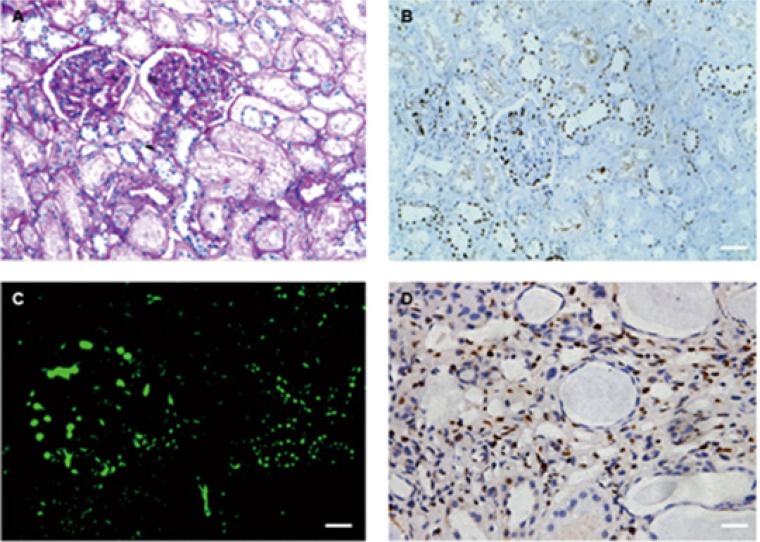
Figure 1. PAS staining, immunohistochemistry and immunofluorescence for DACH1.
(A) PAS staining in normal kidney. (B) Sequential sections with A and showing positive staining for DACH1 in human normal kidney. (C) Immunofluorescence for DACH1, showing the intensity of expression of DACH1 in glomerular is higher than tubules. (D) DACH1 staining in renal tissue with fibrosis, seeing renal interstitium was positive for DACH1. Original magnification × 400, Bar, 50 μm.

