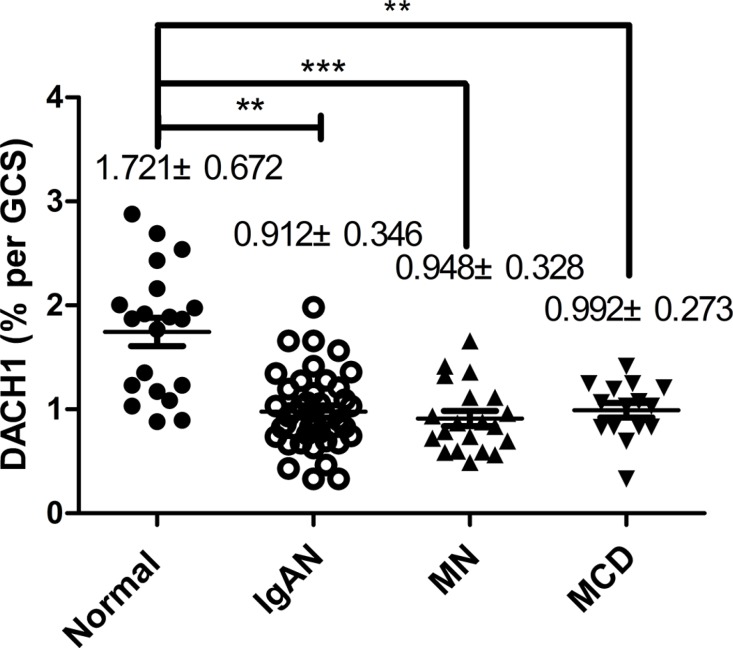
Figure 3. The magnitude of DACH1-expressing in glomerulus.
Compared with normal kidneys, DACH1 expression was decreased in kidneys associated with IgAN, MN, and MCD, **P < 0.001, ***P < 0.01, **P < 0.01, respectively. IgAN vs MN, IgAN vs MCD, MN vs MCD, P > 0.05, respectively, Tukey’s Multiple comparison test. The horizontal bars represent medians.

