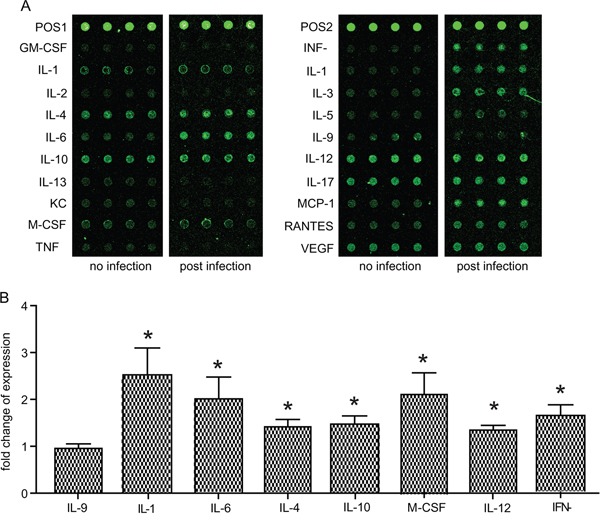
Figure 2. Cytokine level changes induced by chronic T. gondii infection.

Expression levels of the 20 indicated cytokines in peripheral blood sera of uninfected vs chronically infected mice were determined by mice cytokine array chips. A. Typical results from the scanning of cytokine array chips (each had four internal replicates). The data shown were from two chips, one for an uninfected mouse (no infection) and one for a chronically infected mouse (post infection). POS1 and POS2 indicated positive controls. B. Histogram quantification of results from three independent experiments of (A). As a way for data normalization, the average level of each cytokine in uninfected mice was set to 1. Cytokine levels in chronically infected mice after data normalization were graphed. Only the ones with significant difference (compared to uninfected control) were shown. IL-9 was included as an example with no significant changes. Means ± SD, *P <0.05, student's t-test.
