

Abstract
Epigenetics underlying refractory epilepsy is poorly understood, especially in patients without distinctive genetic alterations. DNA methylation may affect gene expression in epilepsy without affecting DNA sequences. Herein, we analyzed genome-wide DNA methylation and gene expression in brain tissues of 10 patients with refractory epilepsy using methylated DNA immunoprecipitation linked with sequencing and mRNA Sequencing. Diverse distribution of differentially methylated genes was found in X chromosome, while differentially methylated genes appeared rarely in Y chromosome. 62 differentially expressed genes, such as MMP19, AZGP1, DES, and LGR6 were correlated with refractory epilepsy for the first time. Although general trends of differentially enriched gene ontology terms and Kyoto Encyclopedia of Genes and Genome pathways in this study are consistent with previous researches, differences also exist in many specific gene ontology terms and Kyoto Encyclopedia of Genes and Genome pathways. These findings provide a new genome-wide profiling of DNA methylation and gene expression in brain tissues of patients with refractory epilepsy, which may provide a basis for further study on the etiology and mechanisms of refractory epilepsy.
Keywords: refractory epilepsy, human, epigenetics, DNA methylation, gene expression
INTRODUCTION
65 millions of people were affected by epilepsy in the world according to International League Against Epilepsy (ILAE) [1], and approximately 36% of epilepsy patients were drug-resistant [2]. Varieties of genes encoding channels, receptors, transporters, synaptic transmission, etc. have been associated with different types of epilepsy, among which, some were associated with refractory epilepsy [3, 4, 5, 6]. Many environmental factors, such as economic situation, diet, trauma, stroke, etc. were also associated with epilepsy or seizure [7, 8, 9, 10].
Epigenetic modifications, including DNA methylation, histone modification and aberrant microRNA expression, can affect genomic reprogramming, tissue-specific gene expression and global gene silencing without affecting DNA sequence itself [11, 12]. The most common form of DNA methylation occurs at the 5’carbon of cytosine in CpG dinucleotides which often locates in CpG islands within the promoters [13]. More recently, DNA methylation is raised as one of the main epigenetic mechanisms in epilepsy [14]. Previous genome-wide DNA methylation profiling in epileptic animal models presented altered DNA methylation in promoters of genes, and identified many genes that were associated with epilepsy [15].
DNA methylation in promoter may decrease gene expression, for example, increased methylation of reelin promoter resulted in the decrease of reelin expression in epilepsy model [16]. Katja Kobow and colleagues found a genome-wide distinctive DNA methylation pattern in rat models of pilocarpine-induced epilepsy in addition to an inverse relationship between gene expression and DNA methylation in promoter, exon and intron [17]. Meanwhile, ketogenic diet could attenuate seizure progression via ameliorating DNA methylation [17]. Selective changes in genome-wide DNA methylation and increased DNA-methyltransferase were also discovered in patients with temporal lobe epilepsy (TLE) [18, 19]. However, the profiling of genome-wide DNA methylation and gene expression in patients with refractory epilepsy remains unclear.
In this study, methylated DNA immunoprecipitation linked with sequencing (MeDIP-Seq) and mRNA sequencing (mRNA-Seq) were used to analyze the pattern of genome-wide DNA methylation and gene expression, as well as the relationship between DNA methylation and gene expression. Our findings identified a new distribution pattern of DNA methylation and gene expression in refractory epilepsy patients. Most of the differentially methylated genes (DMG) were methylated in gene element of coding sequences (CDS) and introns. More importantly, some new refractory epilepsy-related genes that have not been documented previously were found in this study.
RESULTS
Demographic and clinical characteristics of subjects
The mean age (mean±SD) of the 10 epileptic samples (5 male/5 female) was 17.10±5.84, and the age of epilepsy onset was 6.49±6.16. The mean age of the 10 controls (7 male/3 female) was 39.00±17.40. The detailed data of demographic and clinical characteristics of epileptic samples were presented in Table 1 & Supplementary Table S1.
Table 1. Clinical characteristics of patients and controls.
| Characteristics | Patients | Controls |
|---|---|---|
| Age (year) | 17.10±5.84 | 39.00±17.40 |
| Age of onset (year) | 6.49±6.16 | N/A |
| Sex (male/female) | 5/5 | 7/3 |
| Frequency of seizures per month | N/A | |
| <10 | 5 | |
| 10∼100 | 1 | |
| >100 | 4 | |
| Pattern of seizures | N/A | |
| GS | 4 | |
| GTCS+CPS | 4 | |
| PS | 2 | |
| AEDs before operation | N/A | |
| VPA | 9 | |
| CMZ | 6 | |
| TPM | 3 | |
| PB | 2 | |
| OMZ | 2 | |
| LEV | 5 | |
| LTG | 2 | |
| PHT | 1 | |
| CZP | 1 |
GS: generalized seizure; GTCS: generalized tonic clonic seizure; CPS: complex partial seizure; PS: partial seizure; VPA: valproic acid; CMZ: carbamazipine; TPM: topiramate; PB: phenobarbital; OMZ: oxcarbazepine; LEV: levetiracetam; LTG: lamotrigine; PHT: phenytoin; CZP: clonazepam; N/A: non applicable.
No significant difference in distribution of DNA methylation reads
In each sample, 81632654 methylation reads (49 bp) were sequenced. In epileptic samples, an average 71.20% of the reads were uniquely mapped to the reference genome, and in controls, 70.77% of the reads were uniquely mapped. There was no significant difference of uniquely mapped reads between the two groups by T test (Supplementary Table S2).
Moreover, no significant difference was identified between epileptic samples and controls in 1) genome coverage distribution across sequencing depth, 2) distribution of CpG, CHG, and CHH sites across sequencing depth, 3) reads distribution in genome regions with different CpG density, 4) distribution of reads in different gene elements and repetitive elements, 5) distribution of reads around CpG island and gene body.
No significant difference in distribution of DNA methylation peaks
In each epileptic sample, an average of 115128.10±21674.80 peaks were identified, covering an average of 152796189.80±26659961.36 bp and 4.87±0.85% of human genome. In controls, the mean identified peaks were 111020.20±25956.50, covering 148106055.60±25489074.79 bp and 4.72±0.81% of human genome (Supplementary Table S2). No significant difference between the two groups was found. In addition, no significant difference in the number of peaks with different length, the distribution of peaks with different CpG density and distribution of peaks in gene elements (including peak number and peak coverage) was observed between epileptic samples and control.
Analysis of differentially methylated regions (DMR) and DMGs
The median of DMRs identified by pairwise comparison was 7604.50, covering a median of 8580791.00 bp. The distribution of DMGs in paired samples was mapped to human genome using Circos [20] (Figure 1). DMGs appeared on all of chromosomes extensively except for Y chromosome in refractory epilepsy patients.
Figure 1. Distribution of differentially methylated genes (DMGs) across genome.
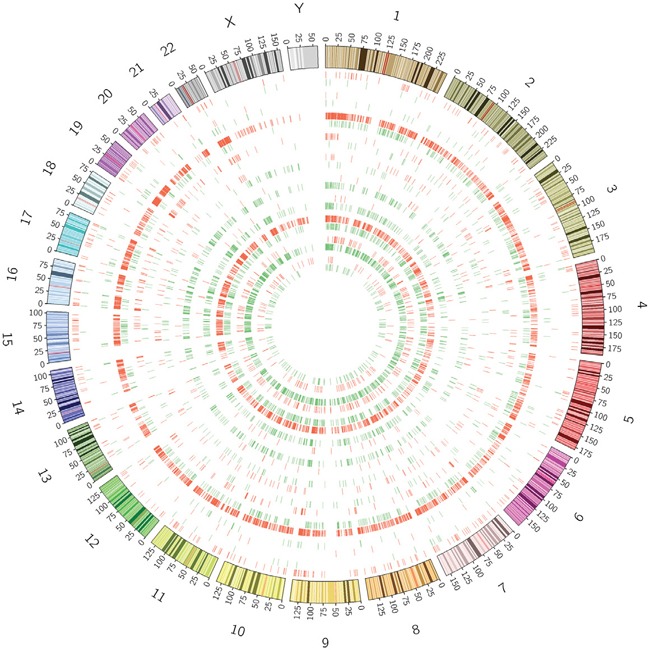
Hyper-methylated (purple) and hypo-methylated (green) regions in epileptic samples vs. controls were targeted to each chromosome. Diverse distribution of DMGs was found in X chromosome, while DMGs appeared rarely in Y chromosome.
The significant enriched gene ontology (GO) terms of DMGs were presented in Table 2. Most of the DMGs were differentially methylated in gene element of CDS and introns. Significant enrichment of DMGs was observed in GO terms of binding of various molecules, such as ATP binding, ion binding, cation binding, and nucleoside binding. In addition, DMG enrichment was also identified in the GO terms involved in receptor activity, transporter activity, kinase activity, transducer activity and channel activity. Those DMGs participate mainly in the biological processes of adhesion and ion transport.
Table 2. GO enrichment analysis of differentially methylated genes.
| Element | Category | Terms |
|---|---|---|
| CDS | C | apical part of cell; apical plasma membrane; axonemal dynein complex; basement membrane; cell surface; cytoplasm; cytoskeleton; cytoskeleton; dynein complex; extracellular matrix; extracellular matrix part;extracellular region; extracellular region part; extracellular space; insoluble fraction; integral to plasma membrane; intracellular; intracellular organelle; intracellular organelle part;intracellular part; intrinsic to plasma membrane; membrane; membrane attack complex; membrane fraction; membrane part; membrane-bounded organelle; myosin complex; myosin filament;nucleolus; organelle; organelle part; plasma membrane; plasma membrane part; platelet alpha granule lumen; proteinaceous extracellular matrix; striated muscle thick filament |
| F | GTPase binding; adenyl nucleotide binding; adenyl ribonucleotide binding; ATP binding; calcium ion binding;calmodulin binding; collagen binding; extracellular matrix structural constituent; GTPase regulator activity; guanyl-nucleotide exchange factor activity; microtubule motor activity;motor activity; NAD(P)H oxidase activity; nucleoside binding; phosphotransferase activity, alcohol group as acceptor; purine nucleoside binding; purine nucleotide binding;Ras guanyl-nucleotide exchange factor activity; Rho guanyl-nucleotide exchange factor activity; small GTPase binding | |
| P | cell adhesion; biological adhesion | |
| Intron | C | synapse; actin cytoskeleton; basement membrane; basolateral plasma membrane; cell; cell junction; cell part;cell projection; cytoskeleton; extracellular matrix; extracellular region part; integral to membrane;integral to plasma membrane; intrinsic to membrane; intrinsic to plasma membrane;membrane; membrane part; neuron projection; plasma membrane; plasma membrane part;postsynaptic membrane; presynaptic membrane; proteinaceous extracellular matrix; synapse part |
| F | actin binding; adenyl nucleotide binding; adenyl ribonucleotide binding; ATP binding; binding; cadherin binding;calcium channel activity; calcium ion binding; cation binding; cation channel activity; cell adhesion molecule binding; channel activity; cytoskeletal protein binding; diacylglycerol binding;extracellular-glutamate-gated ion channel activity; gated channel activity; glutamate receptor activity; GTPase regulator activity; guanyl-nucleotide exchange factor activity;ion binding; ion channel activity; ion transmembrane transporter activity;ionotropic glutamate receptor activity; kinase activity; ligand-gated channel activity;ligand-gated ion channel activity; metal ion binding; metal ion transmembrane transporter activity;molecular transducer activity; nucleoside binding; nucleoside-triphosphatase regulator activity;passive transmembrane transporter activity; phosphoric diester hydrolase activity;phosphotransferase activity, alcohol group as acceptor; protein kinase activity;protein tyrosine kinase activity; protein tyrosine phosphatase activity; purine nucleoside binding;Rho GTPase activator activity; signal transducer activity; transferase activity, transferring phosphorus-containing groups; transmembrane receptor protein kinase activity;transmembrane receptor protein tyrosine kinase activity | |
| P | cell adhesion; biological adhesion; homophilic cell adhesion; cell-cell adhesion; ion transport; metal ion transport | |
| 5’-UTR | C | membrane attack complex |
| F | calcium-dependent protein binding | |
| P | none | |
| 3’-UTR | C | glycerol-3-phosphate dehydrogenase complex |
| F & P | none | |
| Promoter | C | synaptosome |
| F | transmembrane receptor activity; receptor activity; G-protein coupled receptor activity; signal transducer activity;molecular transducer activity; olfactory; voltage-gated ion channel activity; voltage-gated channel activity | |
| P | G-protein coupled receptor protein signaling pathway; cell surface receptor linked signal transduction;sensory perception of chemical stimulus; inorganic; anion transport |
Gene expression profiling
In each epileptic sample, an average of 78044550.80±8806016.67 reads covering 7024009572.00±792541500.40 bp were sequenced, among which an average 83.71% of reads were uniquely mapped to reference genome, and 66.95% of reads were uniquely mapped to reference genes. In controls, an average of 79185195.80±9170582.72 reads covering 7126667622.00±825352445.10 bp were sequenced, among which an average 83.80% of reads were uniquely mapped to reference genome, and 65.99% of reads were uniquely mapped to reference genes. No significant difference was found between the two groups by T test (p<0.05 was considered statistically significant). (Supplementary Table S3).
A total of 21353 genes were sequenced, among which 17665 genes were expressed by all samples. The sequencing coverage of 65.01% and 65.45% genes was over 90% in epileptic samples and controls, respectively, indicating a good sequencing quality.
Pairwise comparison identified 8850 differentially expressed genes (DEG), among which 885 genes were differentially expressed in ≥5 of the 10 pairs (Figure 2). Out of the 8850 DEGs, 246 were epilepsy-related genes according to NCBI Gene (http://www.ncbi.nlm.nih.gov/gene), and 34 epilepsy-related genes were differentially expressed in ≥5 of the 10 pairs (Table 3). However, only 3 out of the 65 genes differentially expressed in ≥8 pairs of the 10 pairs were epilepsy-related genes according to NCBI Gene (Table 4), which suggested that some new DEGs, including AZGP1, MMP19, DES, LGR6, SERPINA3, CX3CR1, DUSP5, EGR4, GPR37, etc. might be correlated with refractory epilepsy.
Figure 2. The gene expression signature of differentially expressed genes in ≥ 5 pairs of samples.
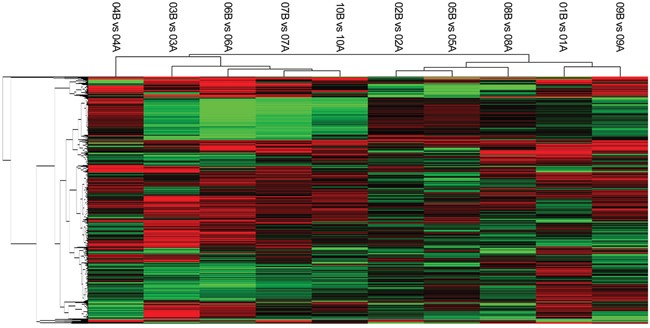
(purple: expression up; green: expression down; black: no difference). The hierarchical cluster showed a distinct expression signature with viariation between the paired samples.
Table 3. Differentially expressed epilepsy-relate genes in ≥ 5 pairs of samples.
| Symbol | description | Epilepsy-Related Disorders |
|---|---|---|
| AQP1 | aquaporin 1 | refractory epilepsy/mesial temporal lobe sclerosis |
| ATF3 | activating transcription factor 3 | refractory mTLE |
| C3 | complement component 3 | TLE/FS/seizures following acute viral infection |
| CALB2 | calbindin 2 | TLE/FCD/LTP |
| CCR5 | chemokine (C-C motif) receptor 5 | refractory epilepsy/infantile-onset epilepsy/SUDEP/SE |
| EGR1 | early growth response 1 | IAE/focal epilepsy |
| EMP1 | epithelial membrane protein 1 | refractory epilepsy |
| GRIN2B | glutamate receptor, ionotropic, N-methyl D-aspartate 2B | West syndrome/FCD/TLE/anti-NMDAR encephalitis |
| HLA-DQA1 | major histocompatibility complex, class II, DQ alpha 1 | IGE/JME/absence epilepsy |
| HP | haptoglobin | IGE/familial epilepsy |
| IL1A | interleukin 1, alpha | TLE/FS |
| IL1B | interleukin 1, beta | epilepsy |
| IL1RN | interleukin 1 receptor antagonist | TLE |
| IL6 | interleukin 6 | TLE/FS/familial epilepsy/refractory epilepsy |
| CXCL8 | chemokine (C-X-C motif) ligand 8 | refractory epilepsy |
| IL18 | interleukin 18 | seizures in MS |
| ITGA2 | integrin, alpha 2 | refractory epilepsy |
| KCNA1 | potassium channel, voltage gated shaker related subfamily A, member 1 | SUDEP/TLE/partial epilepsy/Myokymia |
| NPY | neuropeptide Y | absence epilepsy/TLE/SE |
| OPRM1 | opioid receptor, mu 1 | tonic-clonic seizures/TLE/IGE/SE/IAE |
| PDYN | prodynorphin | TLE/FLTLE |
| RELN | reelin | TLE |
| PTGS2 | prostaglandin-endoperoxide synthase 2 | mTLE/absence seizures/poststroke seizures |
| SCN1B | sodium channel, voltage gated, type I beta subunit | Genetic GEFS+/Dravet Syndrome/convulsions with gastroenteritis/BPEI/LQTS/brugada syndrome |
| SCN5A | sodium channel, voltage gated, type V alpha subunit | Dravet syndrome/SUDEP/BFNS/LQTS/brugada syndrome |
| CCL2 | chemokine (C-C motif) ligand 2 | refractory epilepsy/SE |
| CCL4 | chemokine (C-C motif) ligand 4 | TLE |
| CDKL5 | cyclin-dependent kinase-like 5 | West syndrome/early-onset epileptic encephalopathies |
| CNTN2 | contactin 2 (axonal) | PME/Autosomal recessive epilepsy/Autoimmune epilepsy |
| TNF | tumor necrosis factor | TLE/refractory epilepsy |
| TRPC4 | transient receptor potential cation channel, subfamily C, member 4 | generalized epilepsy with photosensitivity |
| CACNA1H | calcium channel, voltage-dependent, T type, alpha 1H subunit | IGE/CAE/generalized epilepsy syndromes |
| PLCB1 | phospholipase C, beta 1 (phosphoinositide-specific) | early infantile epilepsy syndromes/malignant migrating partial seizures in infancy |
| ERMN | ermin, ERM-like protein | epileptic seizure/oligodendrocytes and epilepsy |
mTLE: mesial temporal lobe epilepsy; TLE: temporal lobe epilepsy; FS: febrile seizures; FCD: focal cortical dysplasia; LTP: long-term potentiation; SUDEP: sudden unexpected death in epilepsy; SE: status epilepticus; IAE: idiopathic absence epilepsy; IGE: idiopathic generalized epilepsy; JME: juvenile myoclonic epilepsy; MS: multiple sclerosis; FLTLE: familial lateral temporal lobe epilepsy; GEFS+: generalized epilepsy with febrile seizure plus; BPEI: benign partial epilepsy in infancy; LQTS: long QT syndrome; BFNS: benign familial neonatal seizure; PME: progressive myoclonic epilepsy; CAE: childhood absence epilepsy.
Table 4. Differentially expressed genes in ≥8 pairs of the samples.
| Symbol | Description | Symbol | Description |
|---|---|---|---|
| SERPINA3 | serpin peptidase inhibitor, clade A (alpha-1 antiproteinase, antitrypsin), member 3 | SOCS3 | suppressor of cytokine signaling 3 |
| AQP1a | aquaporin 1 (Colton blood group) | CH25H | cholesterol 25-hydroxylase |
| AZGP1 | alpha-2-glycoprotein 1, zinc-binding | CD163 | CD163 molecule |
| BMP5 | bone morphogenetic protein 5 | CARTPT | CART prepropeptide |
| CHRM5 | cholinergic receptor, muscarinic 5 | KCNH4 | potassium channel, voltage gated eag related subfamily H, member 4 |
| CX3CR1 | chemokine (C-X3-C motif) receptor 1 | CDH19 | cadherin 19, type 2 |
| DES | desmin | BLNK | B-cell linker |
| DUSP5 | dual specificity phosphatase 5 | GCNT4 | glucosaminyl (N-acetyl) transferase 4, core 2 |
| EGR4 | early growth response 4 | TNFRSF12A | tumor necrosis factor receptor superfamily, member 12A |
| FCGR3A | Fc fragment of IgG, low affinity IIIa, receptor (CD16a) | CD244 | CD244 molecule, natural killer cell receptor 2B4 |
| FOS | FBJ murine osteosarcoma viral oncogene homolog | LGR6 | leucine-rich repeat containing G protein-coupled receptor 6 |
| FOSB | FBJ murine osteosarcoma viral oncogene homolog B | STRA6 | stimulated by retinoic acid 6 |
| GPR37 | G protein-coupled receptor 37 (endothelin receptor type B-like) | SH3TC2 | SH3 domain and tetratricopeptide repeats 2 |
| GRIN2Ba | glutamate receptor, ionotropic, N-methyl D-aspartate 2B | DCSTAMP | dendrocyte expressed seven transmembrane protein |
| HBA2 | hemoglobin, alpha 2 | CNDP1 | carnosine dipeptidase 1 (metallopeptidase M20 family) |
| HBB | hemoglobin, beta | PNMA6A | paraneoplastic Ma antigen family member 6A |
| SERPIND1 | serpin peptidase inhibitor, clade D (heparin cofactor), member 1 | SLC5A11 | solute carrier family 5 (sodium/inositol cotransporter), member 11 |
| HDC | histidine decarboxylase | KIF19 | kinesin family member 19 |
| HLA-DRB5 | major histocompatibility complex, class II, DR beta 5 | FREM3 | FRAS1 related extracellular matrix 3 |
| HSD11B1 | hydroxysteroid (11-beta) dehydrogenase 1 | DLGAP1-AS3 | DLGAP1 antisense RNA 3 |
| HTR3A | 5-hydroxytryptamine (serotonin) receptor 3A, ionotropic | C20orf166-AS1 | C20orf166 antisense RNA 1 |
| TNC | tenascin C | NPAS4 | neuronal PAS domain protein 4 |
| IL6a | interleukin 6 | HMGA1P7 | high mobility group AT-hook 1 pseudogene 7 |
| ITK | IL2-inducible T-cell kinase | C11orf96 | chromosome 11 open reading frame 96 |
| LRP2 | low density lipoprotein receptor-related protein 2 | TMEM233 | transmembrane protein 233 |
| MBP | myelin basic protein | TMEM215 | transmembrane protein 215 |
| MC4R | melanocortin 4 receptor | CTXN3 | cortexin 3 |
| MMP19 | matrix metallopeptidase 19 | LOC643711 | platelet-activating factor acetylhydrolase 1b, catalytic subunit 2 (30kDa) pseudogene |
| NPPA | natriuretic peptide A | LOC100130331 | POTE ankyrin domain family, member F pseudogene |
| VCAM1 | vascular cell adhesion molecule 1 | CD24 | CD24 molecule |
| ZFP36 | ZFP36 ring finger protein | BRE-AS1 | BRE antisense RNA 1 |
| NR4A3 | nuclear receptor subfamily 4, group A, member 3 | LINC00507 | long intergenic non-protein coding RNA 507 |
| BAIAP3 | BAI1-associated protein 3 |
a: Epilepsy-related genes according to NCBI Gene (http://www.ncbi.nlm.nih.gov/gene).
Pairwise comparison presented a total of 395 GO terms significantly enriched in epileptic samples compared to controls (Component 68, Function 70, Process 257). 77 GO terms were significantly enriched in ≥5 epileptic samples compared to controls, including 12 component terms, 23 function terms and 42 process terms (Table 5). The GO enrichment analysis of gene expression revealed that the biological functions of DEGs are mainly correlated with channel activity, transporter activity, and receptor activity. Furthermore, the biological processes mainly targeted by DEGs were immune system, biological regulation, response to stimulus, signaling, development, and behavior.
Table 5. Enriched GO terms and KEGG pathways in epileptic sample.
| Term | Genes | Term | Genes |
|---|---|---|---|
| GO Component | |||
| GO:0071944-Cell periphery | 516 | GO:0016020-Membrane | 2319 |
| GO:0009986-Cell surface | 48 | GO:0044425-Membrane part | 1912 |
| GO:0005576-Extracellular region | 333 | GO:0016021-Integral to membrane | 509 |
| GO:0044421-Extracellular region part | 326 | GO:0031224-Intrinsic to membrane | 1654 |
| GO:0031012-Extracellular matrix | 114 | GO:0005886-Plasma membrane | 511 |
| GO:0005578-Protenaceous extracellular matrix | 44 | GO:0044459-Plasma membrane part | 488 |
| GO Function | |||
| GO:0015267-Channel activity | 172 | GO:0001653-Peptide receptor activity | 39 |
| GO:0005261-Cation channel activity | 113 | GO:0008528-Peptide receptor activity, G-protein coupled | 36 |
| GO:0005216-Ion channel activity | 167 | GO:0060089-Molecular transducer activity | 586 |
| GO:0022838-Substrate-specific channel activity | 167 | GO:0004871-Signal transducer activity | 506 |
| GO:0005215-Transporter activity | 402 | GO:0005515-Protein binding | 1337 |
| GO:0022857-Transmembrane transporter activity | 241 | GO:0005102-Receptor binding | 286 |
| GO:0015075-Ion transmembrane transporter activity | 276 | GO:0001871-Pattern binding | 59 |
| GO:0022803-Passive transmembrane transporter activity | 173 | GO:0042277-Peptide binding | 50 |
| GO:0022892-Substrate-specific transporter activity | 367 | GO:0030246-Carbohydrate binding | 120 |
| GO:0022891-Substrate-specific transmembrane transporter activity | 220 | GO:0030247-Polysaccharide binding | 57 |
| GO:0004872-Receptor activity | 347 | GO:0005539-Glycosaminoglycan binding | 52 |
| GO:0004888-Transmembrane receptor activity | 225 | ||
| GO Process | |||
| GO:0001775-Cell activation | 421 | GO:0009605-Response to external stimulus | 42 |
| GO:0007154-Cell communication | 120 | GO:0009617-Response to bacterium | 201 |
| GO:0030154-Cell differentiation | 1390 | GO:0009991-Response to extracellular stimulus | 287 |
| GO:0002376-Immune system process | 449 | GO:0031667-Response to nutrient levels | 79 |
| GO:0032501-Multicellular organismal process | 604 | GO:0009611-Response to wounding | 168 |
| GO:0032501-Biological regulation | 160 | GO:0023052-Signaling | 75 |
| GO:0050789-Regulation of biological process | 1153 | GO:0019932-Second-messenger-mediated signaling | 308 |
| GO:0048518-Positive regulation of biological process | 146 | GO:0023033-Signaling pathway | 96 |
| GO:0065008-Regulation of biological quality | 326 | GO:0007166-Cell surface receptor linked signaling pathway | 1022 |
| GO:0050793-Regulation of developmental process | 283 | GO:0007186-G-protein coupled receptor protein signaling pathway | 434 |
| GO:0002682-Regulation of immune system process | 898 | GO:0009653-Anatomical structrue morphogenesis | 67 |
| GO:0051239-Regulation of multicellular organismal process | 1211 | GO:0048856-Anatomical structure development | 89 |
| GO:0050896-Response to stimulus | 496 | GO:0007275-Multicellular organismal development | 239 |
| GO:0042221-Response to chemical stimulus | 527 | GO:0032502-Developmental process | 614 |
| GO:0010033-Response to organic substance | 1625 | GO:0048869-Cellular developmental process | 332 |
| GO:0006950-Response to stress | 669 | GO:0048731-System development | 1342 |
| GO:0006952-Defense response | 259 | GO:0048513-Organ development | 906 |
| GO:0009719-Response to endogenous stimulus | 201 | GO:0009888-Tissue development | 824 |
| GO:0009725-Response to hormone stimulus | 350 | GO:0007610-Behavior | 988 |
| GO:0048545-Response to steroid hormone stimulus | 59 | GO:0006811-Ion transport | 222 |
| GO:0031960-Response to corticosteroid stimulus | 615 | GO:0048878-Chemical homeostasis | 182 |
| KEGG Pathway | |||
| ko05143-African trypanosomiasis | 36 | ko04640-Hematopoietic cell lineage | 110 |
| ko05330-Allograft rejection | 38 | ko04672-Intestinal immune network for IgA production | 37 |
| ko05146-Amoebiasis | 120 | ko05140-Leishmaniasis | 87 |
| ko05310-Asthma | 24 | ko04670-Leukocyte transendothelial migration | 151 |
| ko05320-Autoimmune thyroid disease | 43 | ko05144-Malaria | 47 |
| ko04662-B cell receptor signaling pathway | 92 | ko04650-Natural killer cell mediated cytotoxicity | 109 |
| ko04020-Calcium signaling pathway | 177 | ko04080-Neuroactive ligand-receptor interaction | 244 |
| ko04514-Cell adhesion molecules | 137 | ko04380-Osteoclast differentiation | 127 |
| ko04062-Chemokine signaling pathway | 151 | ko04145-Phagosome | 197 |
| ko04610-Complement and coagulation cascades | 113 | ko05020-Prion diseases | 54 |
| ko04060-Cytokine-cytokine receptor interaction | 171 | ko05323-Rheumatoid arthritis | 78 |
| ko04512-ECM-receptor interaction | 155 | ko05150-Staphylococcus aureus infection | 85 |
| ko04666-Fc gamma R-mediated phagocytosis | 116 | ko04940-Type I diabetes mellitus | 45 |
| ko05332-Graft-versus-host disease | 43 |
In Kyoto Encyclopedia of Genes and Genome (KEGG) pathway enrichment analysis, 75 pathways were significantly enriched in epileptic samples compared to controls, while 27 pathways were significantly enriched in ≥5 epileptic samples compared to controls (Table 5). DEGs mainly participate in calcium signaling pathway, neuroactive ligand-receptor interaction, and pathways involved in inflammation, immune response, and autoimmune diseases.
DNA methylation and gene expression
The distribution of hyper-, hypo- and unmethylated gene expression levels in different gene elements were presented in Figure 3. The trend of gene expression of the three groups were similar, and in all the 5 elements, the percentage of hyper-methylated genes with log2(RPKM ratio) (RPKM ratio = RPKM of epileptic sample/RPKM of control) approximately ranging from 1 to 3 were higher than that of hypo-methylated and unmethylated genes. Generally, no significant relationship in modulation was found between DNA methylation and gene expression.
Figure 3. The distribution of hyper-, hypo- and unmethylated gene expression levels in different gene elements.
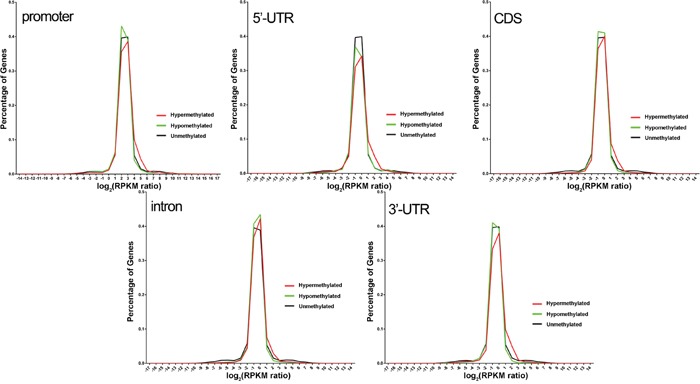
No significant relationship was found between DNA methylation and gene expression in all the 5 gene elements, and the percentage of hyper-methylated genes with log2(RPKM ratio) approximately ranging from 1 to 3 were higher than that of hypo-methylated and unmethylated genes.
DISCUSSION
It is the first genome-wide report on DNA methylation and gene expression in refractory epilepsy patients. 62 differentially expressed genes such as MMP19, AZGP1, DES, and LGR6 were discovered to be correlated with refractory epilepsy, and diverse distribution of differentially methylated genes was found in X chromosome instead of in Y chromosome.
Although many genes were observed differentially methylated or expressed, the general distribution of DNA methylation reads, DNA methylation peaks and mRNA sequencing reads were similar between refractory epileptic samples and controls, which indicate no significant difference in global DNA methylation and global gene expression between the two groups. Inconsistent with previous report which identified decreased DNA methylation in Y chromosome of TLE patients [18], our study presented no difference in DNA methylation in Y chromosome between refractory epileptic samples and controls. It is noteworthy that 4 out of the 5 male epileptic samples in our study were frontal lobe epilepsy, suggesting a possible difference in DNA methylation in Y chromosome between frontal lobe epilepsy and TLE. On the contrary to a previous research which found no change of DNA methylation in X chromosome in rat models of epilepsy [17], we identified diverse DMR distribution on X chromosome in all patients. This difference may be attributed to the much more complicated environmental factors involved by human beings or the difference between species.
In pairwise comparison of gene expression analysis, we identified distinct gene expression signatures. 34 DEGs are correlated with epilepsy or seizure and 14 of these genes are associated with refractory epilepsy, such as AQP1 [21], CCR5 [22], EMP1 [23], CXCL8 [24], ITGA2 [25], and CCL2 [26]. For the first time, 62 DEGs differentially expressed in ≥8 pairs of samples were found related to epilepsy/seizure in our study. These newly-identified refractory epilepsy-related genes may possibly reveal new mechanisms of refractory epilepsy. In all the DEGs, only MMP19 and AZGP1 were differentially expressed in all the 10 pairs. Compared to the controls, 9 of the 10 epileptic samples showed increased expression of MMP19, while 1 epileptic sample showed decreased expression. MMP19 and other matrix metalloproteinases can cleave and remodel the extracellular matrix, including tenascin and laminin, and thus influence synapse formation and remodeling, N-methyl-D-aspartate receptor activity, learning and memory, and hippocampal long-term potentiation [27]. Inhibition of MMP19 and other matrix metalloproteinases may prevent development of epilepsy at the early stage of epileptogenesis [28]. Meanwhile, we found the expression of AZGP1 were decreased in 8 of the 10 epileptic samples, and increased in 2 of the 10 epileptic samples when compared to controls. AZGP1 encodes Zinc-a2-glycoprotein, which is an adipokine participates in lipid mobilization, lipolytic effect, and immune response [29, 30]. Moreover, both DES in 9 pairs and LGR6 in 8 pairs showed consistently increased expression in epileptic samples. To the best of our knowledge, it is the first time that MMP19, AZGP1, DES, and LGR6 were reported to be correlated with refractory epilepsy.
Significant enrichment of DMGs in GO terms of binding, transport, and enzymatic activity were found, which is consistent with previous studies [18]. Interestingly, most of the DMGs were differentially methylated in CDS and intron, while previous research showed differential methylation in all the gene elements in rat models of chronic epilepsy induced by pilocarpine [17]. These findings indicate DNA methylation in CDS and intron may play critical roles in refractory epilepsy besides promoter methylation which has been a very popular target in research on epilepsy [18, 31]. The GO enrichment analysis of gene expression revealed a trend similar to a previous report [17] that the DEGs are mainly correlated with biological functions such as protein binding, receptor binding, channel activity, transporter activity, and receptor activity, as well as being involved in biological processes such as immune system, biological regulation, response to stimulus, signaling, development, and behavior.
The change of DNA methylation in this study is not exactly corresponded with alteration of gene expression. Kobow and his colleagues found that DNA methylation in promoter, exon and intron were inversely correlated with gene expression in rat models of chronic epilepsy induced by pilocarpine [17], but our study found that most of the hyper- and hypo-methylated genes were not differentially expressed in epilepsy patients, and the percentage of hyper-methylated genes with log2(RPKM ratio) ranging from 1 to 3 were higher than that of hypo-methylated and unmethylated genes, which indicate a complicated modulation between DNA methylation and gene expression in refractory epilepsy in human beings.
In KEGG analysis of gene expression, DEGs significantly enriched in calcium signaling pathway, neuroactive ligand-receptor interaction, and pathways participating in inflammation, immune response, autoimmune diseases. Calcium signaling pathway has been increasingly recognized as a vital factor in epileptogenesis and the excess synchronization, and hyperexcitability of neurons for seizures can be linked to various calcium signaling pathways [32]. The aberrantly neuroactive ligand-receptor interaction can enhance the susceptibility to epileptic seizures [33, 34]. It may explain partially that the drugs regulating the function of calcium signaling pathway and neuroactive ligand-receptor interaction are able to alleviate the seizure frequency [35]. The roles of immune response and inflammation in epilepsy have been recognized in previous studies [36]. Autoimmune epilepsy frequently present drug-resistance which can be controlled by immunosuppressive and immunomodulatory therapies [36, 37]. Consistent with Lukic and his colleagues’ study, we also identified that prion disease was significantly targeted by DEGs which indicate both refractory epilepsy and prion diseases may share some common pathway [38].
MATERIALS AND METHODS
Study approval
The research protocol was approved by the Ethics Committees of the Second Affiliated Hospital of Chongqing Medical University. All procedures performed in studies involving human participants were in accordance with the ethical standards of the institutional and/or national research committee and with the 1964 Helsinki declaration. Written informed consent was obtained from all individual participants included in the study or their proxies.
Patients and tissues preparation
Resected brain tissues were retrospectively but consecutively collected from 10 patients with refractory epilepsy and 10 patients with post-traumatic intracranial hypertension who underwent surgical treatment since 2008 to 2014. Patients with refractory epilepsy were diagnosed following the definition of ILAE [39]. Briefly, all patients were resistant to maximum doses of at least three anti-epileptic drugs (AED), and evaluated by detailed history, neurological examination, neuropsychological test and neuroimaging data. For presurgical evaluation and epileptogenic zones identification, a combined assessment of ictal simiology, brain magnetic resonance imaging, video-electroencephalography, sphenoidal electrode monitoring and intracerebral electroencephalography and intraoperative electrocorticography were applied. After evaluation, standard en bloc resection was performed. No refractory epilepsy patient received adjustment of AEDs during the 2 months before surgery. Brain tissues as control from the 10 post-trauma intracranial hypertension patients were identified normal by neuropathologist. These patients had no history of epilepsy or exposure to AEDs. All the resected brain tissues were immediately frozen in liquid nitrogen and then stored at -80°C.
The 10 epileptic samples and 10 controls were paired, the difference in genome-wide DNA methylation and gene expression between the paired samples were analyzed using MeDIP-seq and mRNA-seq.
DNA methylation profiling
Genomic DNA was extracted using QIAamp DNA Micro Kit (Qiagen, Hilden, Germany) according to the manufacturer's instruction. Extracted DNA was fragmented to a size of 100-500 bp by sonication (Bioruptor NGS, Digenode, Liege, Belgium), and subjected to DNA-end repair, 3’-dA overhang and ligation of sequencing adaptors according to manufacturer's instruction (Paired-End DNA Sample Prep kit, Illumina, San Diego, USA) and denatured to single-stranded. Then the methylated DNA was immunoprecipitated by 5mc antibody (Magnetic Methylated DNA Immunoprecipitation kit, Diagenod, Liege, Belgium). After Real-time Quantitative polymerase chain reaction (PCR) (TaqMan Probe, Applied Biosystems, Thermo Fisher Scientific, Waltham, USA) validation and quality control of sample library (Agilent 2100 BioAnalyzer, Agilent, Santa Clara, USA), electrophoretically selected DNA fragments sizing from 200-300 bp were subjected to high-throughput sequencing (Illumina HiSeqTM 2000, Illumina, San Diego, USA). Sequencing strategy was Single-end 50 bp, and reads size was 49 bp.
Filtered MeDIP-Seq data (Adapters, reads containing more than 10% bases undetermined, and low quality reads were removed. Low quality read means the quality values (Q) of more than 50% bases in this read were ≤20, Q=-10lg(rate of sequencing error)) was mapped to reference genome using SOAP software, version 2.21 (Website: http://soap.genomics.org.cn)[40], only unique alignments with no more than 2 mismatches were included for further analysis. The reference genome data and the data used for annotation of all aligned genes were from UCSC Genome Bioinformatics Download (Reference genome: http://hgdownload.cse.ucsc.edu/goldenPath/hg19/chromosomes/chr*.fa.gz. Reference genes: http://hgdownload.cse.ucsc.edu/goldenPath/hg19/bigZips/chromOut.tar.gz).
To describe the distribution of MeDIP-Seq data on genome, the following items were calculated: 1) Genome coverage distribution across sequencing depth; 2) Distribution of CpG, CHG and CHH sites varies with sequencing depth; 3) Reads distribution in genome regions with different CpG density; 4) Distribution of reads in different gene elements, including CpG islands, promoters, 5’-Untranslated regions (UTR), CDS, introns, 3’-UTR, repeat regions and each class of repetitive elements (Repeat dataset is obtained from RepeatMasker (Transposons) and Tandem Repeats Finder (Tandom repeats), and is available at:http://hgdownload.cse.ucsc.edu/goldenPath/hg19/bigZips/chromOut.tar.gz); 5) Distribution of MeDIP-Seq reads around CpG island and gene body.
Whole genome scanning of enrichment region of methylation/Peak was based on a defined analysis model, MACS 1.4.0 (Website:http://liulab.dfci.harvard.edu/MACS/) with default parameters [41]. The following items were calculated: 1) Distribution of peaks with different length; 2) Distribution of peaks with different CpG density; 3) Number and coverage of peaks in gene elements (promoter, 5’-UTR, CDS, intron, and 3’-UTR).
DMGs based on peak of all the paired samples were analyzed. Briefly, peaks of the paired two samples were merged as candidate DMRs. For each candidate DMR, the number of reads of each sample was calculated and tested to get true DMRs. The downtrend DMRs indicate that the number of reads of the control sample was larger than the epileptic sample and the uptrend DMRs indicate the opposite. DMGs were defined as the genes overlapping DMRs. Genes with an element merely overlap uptrend DMRs were considered hyper-methylated with such an element, genes with an element merely overlap downtrend DMRs were considered hypo-methylated with such an element.
To clarify the biological functions of DMGs, GO enrichment analysis was performed. Briefly, DMGs were mapped to GO terms in reference database (http://www.geneontology.org) and gene numbers for every term were calculated and tested to identify the significantly enriched GO terms.
Gene expression profiling
RNA was extracted using Trizol method. After DNase I treatment, mRNA was isolated with magnetic beads with Oligo (dT) and fragmented. Then cDNA was synthesized using the mRNA fragments as templates. The synthesized cDNA fragments were purified and subjected to end reparation, single nucleotide adenine addition and adapter connection. cDNA fragments suitable for PCR amplification were selected with electrophoresis. Quality control of sample library was performed using Agilent 2100 Bioanaylzer (Agilent, Santa Clara, USA) and Applied Biosystems StepOnePlus Real-Time PCR System (Applied Biosystems, Thermo Fisher Scientific, Waltham, USA). The library was sequenced using Illumina HiSeqTM 2000 (Illumina, San Diego, USA).
After sequencing quality control, the mRNA-Seq data was mapped to reference genome and reference genes using SOAP software, version 2.21 (Website:http://soap.genomics.org.cn) [40]. Then the distribution of reads on reference genome and genes was calculated and coverage analysis was performed. After alignment quality control, the DEGs were selected. And for further analysis, expression pattern analysis of DEGs were also performed.
To clarify the biological functions of DEGs, GO enrichment analysis of DEGs was performed as described above. To further clarify the biological functions of DEGs, KEGG pathway analysis was performed using the same calculating formula as GO enrichment analysis with database available at http://www.kegg.jp/kegg/.
Correlation analysis of DNA methylation and gene expression
The distribution of hyper-, hypo- and unmethylated gene expression levels in different gene elements were calculated to analyze the relationship between DNA methylation and gene expression as previously described [42].
Statistics and analysis
To identify true DMRs, the numbers of reads were calculated and assessed using chi-square statistics and False discovery rate (FDR) statistics (p≤0.01, and the difference of read numbers should be more than twice). To identify significantly enriched GO terms and KEGG pathways, gene numbers for every term or pathway were calculated and then assessed using hypergeometric test, p-value of hypergeometric test was corrected using Bonferroni Correction [43]. GO terms with corrected p-value ≤0.01, and KEGG pathways with corrected p-value ≤0.05 were considered significantly enriched. In selection of DEGs, the gene expression level was calculated using RPKM method [44], and DEGs were selected as previously described [45]. The adjusted p-value was calculated using Benjamini, Yekutieli. 2001 FDR method [46] and DEGs was defined as genes with FDR≤0.001 and the RPKM difference between the paired samples should be more than twice. Hierarchical cluster was performed to analyze the expression pattern of DEGs using Cluster [47] and presented using Java Treeview [48]. The DEGs were clustered by Euclidean distance.
Abbreviations
CDS=coding sequences; DMG=differentially methylated genes; DMR=Differentially Methylated Regions; DEG=differentially expressed genes; GO=gene ontology; ILAE=International League Against Epilepsy; KEGG=Kyoto Encyclopedia of Genes and Genome; MeDIP-Seq=methylated DNA immunoprecipitation linked with sequencing; mRNA-Seq=mRNA sequencing; PCR=polymerase chain reaction; RPKM=Reads Per Kilobases per Millionreads; TLE=temporal lobe epilepsy; UTR=Untranslated regions.
SUPPLEMENTARY TABLES
Acknowledgments
The authors sincerely thank BGI tech (Shenzhen, China) for technique support.
Footnotes
CONFLICTS OF INTEREST
The authors have declared that no competing financial interests exists.
FUNDING
This study is funded by National Science Foundation of China (81571259 & 81571167), and Chongqing Municipal Public Health Bureau (2015ZDXM011).
REFERENCES
- 1.Thurman DJ, Beghi E, Begley CE, Berg AT, Buchhalter JR, Ding D, Hesdorffer DC, Hauser WA, Kazis L, Kobau R, Kroner B, Labiner D, Liow K, et al. Standards for epidemiologic studies and surveillance of epilepsy. Epilepsia. 2011;52:2–26. doi: 10.1111/j.1528-1167.2011.03121.x. [DOI] [PubMed] [Google Scholar]
- 2.Kwan P, Brodie MJ. Early identification of refractory epilepsy. N Engl J Med. 2000;342:314–9. doi: 10.1056/NEJM200002033420503. [DOI] [PubMed] [Google Scholar]
- 3.Noebels J. Pathway-driven discovery of epilepsy genes. Nat Neurosci. 2015;18:344–50. doi: 10.1038/nn.3933. [DOI] [PMC free article] [PubMed] [Google Scholar]
- 4.Martin HC, Kim GE, Pagnamenta AT, Murakami Y, Carvill GL, Meyer E, Copley RR, Rimmer A, Barcia G, Fleming MR, Kronengold J, Brown MR, Hudspith KA, et al. Clinical whole-genome sequencing in severe early-onset epilepsy reveals new genes and improves molecular diagnosis. Hum Mol Genet. 2014;23:3200–11. doi: 10.1093/hmg/ddu030. [DOI] [PMC free article] [PubMed] [Google Scholar]
- 5.Nieh SE, Sherr EH. Epileptic encephalopathies: new genes and new pathways. Neurotherapeutics. 2014;11:796–806. doi: 10.1007/s13311-014-0301-2. [DOI] [PMC free article] [PubMed] [Google Scholar]
- 6.Hani AJ, Mikati HM, Mikati MA. Genetics of pediatric epilepsy. Pediatr Clin North Am. 2015;62:703–22. doi: 10.1016/j.pcl.2015.03.013. [DOI] [PubMed] [Google Scholar]
- 7.Pickrell WO, Lacey AS, Bodger OG, Demmler JC, Thomas RH, Lyons RA, Smith PE, Rees MI, Kerr MP. Epilepsy and deprivation, a data linkage study. Epilepsia. 2015;56:585–591. doi: 10.1111/epi.12942. [DOI] [PubMed] [Google Scholar]
- 8.Felton EA, Cervenka MC. Dietary therapy is the best option for refractory nonsurgical epilepsy. Epilepsia. 2015;56:1325–9. doi: 10.1111/epi.13075. [DOI] [PubMed] [Google Scholar]
- 9.Christensen J, Pedersen MG, Pedersen CB, Sidenius P, Olsen J, Vestergaard M. Long-term risk of epilepsy after traumatic brain injury in children and young adults: a population-based cohort study. Lancet. 2009;373:1105–10. doi: 10.1016/S0140-6736(09)60214-2. [DOI] [PubMed] [Google Scholar]
- 10.Adelöw C, Andersson T, Ahlbom A, Tomson T. Prior hospitalization for stroke, diabetes, myocardial infarction, and subsequent risk of unprovoked seizures. Epilepsia. 2011;52:301–7. doi: 10.1111/j.1528-1167.2010.02757.x. [DOI] [PubMed] [Google Scholar]
- 11.Hwang JY, Aromolaran KA, Zukin RS. Epigenetic mechanisms in stroke and epilepsy. Neuropsychopharmacology. 2013;38:167–82. doi: 10.1038/npp.2012.134. [DOI] [PMC free article] [PubMed] [Google Scholar]
- 12.Li Y, Zhu Y, Prochownik EV. MicroRNA-Based Screens for Synthetic Lethal Interactions with c-Myc. RNA Dis. 2016;3:e1330. doi: 10.14800/rd.1330. [DOI] [PMC free article] [PubMed] [Google Scholar]
- 13.Jones PA. Functions of DNA methylation: islands, start sites, gene bodies and beyond. Nat Rev Genet. 2012;13:484–92. doi: 10.1038/nrg3230. [DOI] [PubMed] [Google Scholar]
- 14.Kobow K, Blümcke I. Epigenetic mechanisms in epilepsy. Prog Brain Res. 2014;213:279–316. doi: 10.1016/B978-0-444-63326-2.00014-4. [DOI] [PubMed] [Google Scholar]
- 15.Miller-Delaney SF, Das S, Sano T, Jimenez-Mateos EM, Bryan K, Buckley PG, Stallings RL, Henshall DC. Differential DNA methylation patterns define status epilepticus and epileptic tolerance. J Neurosci. 2012;32:1577–88. doi: 10.1523/JNEUROSCI.5180-11.2012. [DOI] [PMC free article] [PubMed] [Google Scholar]
- 16.Kobow K, Blümcke I. The methylation hypothesis: do epigenetic chromatin modifications play a role in epileptogenesis? Epilepsia. 2011;52:15–9. doi: 10.1111/j.1528-1167.2011.03145.x. [DOI] [PubMed] [Google Scholar]
- 17.Kobow K, Kaspi A, Harikrishnan KN, Kiese K, Ziemann M, Khurana I, Fritzsche I, Hauke J, Hahnen E, Coras R, Mühlebner A, El-Osta A, Blümcke I. Deep sequencing reveals increased DNA methylation in chronic rat epilepsy. Acta Neuropathol. 2013;126:741–56. doi: 10.1007/s00401-013-1168-8. [DOI] [PMC free article] [PubMed] [Google Scholar]
- 18.Miller-Delaney SF, Bryan K, Das S, McKiernan RC, Bray IM, Reynolds JP, Gwinn R, Stallings RL, Henshall DC. Differential DNA methylation profiles of coding and non-coding genes define hippocampal sclerosis in human temporal lobe epilepsy. Brain. 2015;138:616–31. doi: 10.1093/brain/awu373. [DOI] [PMC free article] [PubMed] [Google Scholar]
- 19.Zhu Q, Wang L, Zhang Y, Zhao FH, Luo J, Xiao Z, Chen GJ, Wang XF. Increased expression of DNA methyltransferase 1 and 3a in human temporal lobe epilepsy. J Mol Neurosci. 2012;46:420–6. doi: 10.1007/s12031-011-9602-7. [DOI] [PubMed] [Google Scholar]
- 20.Krzywinski M, Schein J, Birol I, Connors J, Gascoyne R, Horsman D, Jones SJ, Marra MA. Circos: an information aesthetic for comparative genomics. Genome Res. 2009;19:1639–45. doi: 10.1101/gr.092759.109. [DOI] [PMC free article] [PubMed] [Google Scholar]
- 21.Bebek N, Özdemir Ö, Sayitoglu M, Hatırnaz O, Baykan B, Gürses C, Sencer A, Karasu A, Tüzün E, Üzün I, Akat S, Cine N, Sargin Kurt G, et al. Expression analysis and clinical correlation of aquaporin 1 and 4 genes in human hippocampal sclerosis. J Clin Neurosci. 2013;20:1564–70. doi: 10.1016/j.jocn.2012.12.023. [DOI] [PubMed] [Google Scholar]
- 22.Louboutin JP, Strayer DS. Relationship between the chemokine receptor CCR5 and microglia in neurological disorders: consequences of targeting CCR5 on neuroinflammation, neuronal death and regeneration in a model of epilepsy. CNS Neurol Disord Drug Targets. 2013;12:815–29. doi: 10.2174/18715273113126660173. [DOI] [PubMed] [Google Scholar]
- 23.Li YQ, Xue T, Wang L, Xu ZC, Xi ZQ, Yuan J, Wang XF, Chen YM, Zhang M, Yao L. Up-regulation of epithelial membrane protein-1 in the temporal neocortex of patients with intractable epilepsy. Neurochem Res. 2009;34:1594–602. doi: 10.1007/s11064-009-9948-1. [DOI] [PubMed] [Google Scholar]
- 24.Sakuma H, Tanuma N, Kuki I, Takahashi Y, Shiomi M, Hayashi M. Intrathecal overproduction of proinflammatory cytokines and chemokines in febrile infection-related refractory status epilepticus. J Neurol Neurosurg Psychiatry. 2015;86:820–2. doi: 10.1136/jnnp-2014-309388. [DOI] [PubMed] [Google Scholar]
- 25.Wu Y, Wang XF, Mo XA, Li JM, Yuan J, Zheng JO, Feng Y, Tang M. Expression of laminin β1 and integrin α2 in the anterior temporal neocortex tissue of patients with intractable epilepsy. Int J Neurosci. 2011;121:323–8. doi: 10.3109/00207454.2011.558224. [DOI] [PubMed] [Google Scholar]
- 26.He X, Li Y, Liu Z, Yue X, Zhao P, Hu J, Wu G, Mao B, Sun D, Zhang H, Song X, Wang Y, Shao J. The association between CCL2 polymorphisms and drug-resistant epilepsy in Chinese children. Epileptic Disord. 2013;15:272–7. doi: 10.1684/epd.2013.0603. [DOI] [PubMed] [Google Scholar]
- 27.Ethell IM, Ethell DW. Matrix metalloproteinases in brain development and remodeling: synaptic functions and targets. J Neurosci Res. 2007;85:2813–23. doi: 10.1002/jnr.21273. [DOI] [PubMed] [Google Scholar]
- 28.Ikonomidou C. Matrix metalloproteinases and epileptogenesis. Mol Cell Pediatr. 2014;1:6. doi: 10.1186/s40348-014-0006-y. [DOI] [PMC free article] [PubMed] [Google Scholar]
- 29.Cabassi A, Tedeschi S. Zinc-α2-glycoprotein as a marker of fat catabolism in humans. Curr Opin Clin Nutr Metab Care. 2013;16:267–71. doi: 10.1097/MCO.0b013e32835f816c. [DOI] [PubMed] [Google Scholar]
- 30.Hassan MI, Waheed A, Yadav S, Singh TP, Ahmad F. Zinc alpha 2-glycoprotein: a multidisciplinary protein. Mol Cancer Res. 2008;6:892–906. doi: 10.1158/1541-7786.MCR-07-2195. [DOI] [PubMed] [Google Scholar]
- 31.Li HJ, Wan RP, Tang LJ, Liu SJ, Zhao QH, Gao MM, Yi YH, Liao WP, Sun XF, Long YS. Alteration of Scn3a expression is mediated via CpG methylation and MBD2 in mouse hippocampus during postnatal development and seizure condition. Biochim Biophys Acta. 2015;1849:1–9. doi: 10.1016/j.bbagrm.2014.11.004. [DOI] [PubMed] [Google Scholar]
- 32.Steinlein OK. Calcium signaling and epilepsy. Cell Tissue Res. 2014;357:385–93. doi: 10.1007/s00441-014-1849-1. [DOI] [PubMed] [Google Scholar]
- 33.Royer-Zemmour B, Ponsole-Lenfant M, Gara H, Roll P, Lévêque C, Massacrier A, Ferracci G, Cillario J, Robaglia-Schlupp A, Vincentelli R, Cau P, Szepetowski P. Epileptic and developmental disorders of the speech cortex: ligand/receptor interaction of wild-type and mutant SRPX2 with the plasminogen activator receptor uPAR. Hum Mol Genet. 2008;17:3617–30. doi: 10.1093/hmg/ddn256. [DOI] [PubMed] [Google Scholar]
- 34.Graebenitz S, Kedo O, Speckmann EJ, Gorji A, Panneck H, Hans V, Palomero-Gallagher N, Schleicher A, Zilles K, Pape HC. Interictal-like network activity and receptor expression in the epileptic human lateral amygdala. Brain. 2011;134:2929–47. doi: 10.1093/brain/awr202. [DOI] [PubMed] [Google Scholar]
- 35.Margolis JM, Chu BC, Wang ZJ, Copher R, Cavazos JE. Effectiveness of antiepileptic drug combination therapy for partial-onset seizures based on mechanisms of action. JAMA Neurol. 2014;71:985–93. doi: 10.1001/jamaneurol.2014.808. [DOI] [PubMed] [Google Scholar]
- 36.Nabbout R. Autoimmune and inflammatory epilepsies. Epilepsia. 2012;53:58–62. doi: 10.1111/j.1528-1167.2012.03614.x. [DOI] [PubMed] [Google Scholar]
- 37.Petit-Pedrol M, Armangue T, Peng X, Bataller L, Cellucci T, Davis R, McCracken L, Martinez-Hernandez E, Mason WP, Kruer MC, Ritacco DG, Grisold W, Meaney BF, et al. Encephalitis with refractory seizures, status epilepticus, and antibodies to the GABAA receptor: a case series, characterisation of the antigen, and analysis of the effects of antibodies. Lancet Neurol. 2014;13:276–86. doi: 10.1016/S1474-4422(13)70299-0. [DOI] [PMC free article] [PubMed] [Google Scholar]
- 38.Lukic A, Uphill J, Brown CA, Beck J, Poulter M, Campbell T, Adamson G, Hummerich H, Whitfield J, Ponto C, Zerr I, Lloyd SE, Collinge J, et al. Rare structural genetic variation in human prion diseases. Neurobiol Aging. 2015;36:e1–8. doi: 10.1016/j.neurobiolaging.2015.01.011. 2004. [DOI] [PubMed] [Google Scholar]
- 39.Kwan P, Arzimanoglou A, Berg AT, Brodie MJ, Allen Hauser W, Mathern G, Moshé SL, Perucca E, Wiebe S, French J. Definition of drug resistant epilepsy: consensus proposal by the ad hoc Task Force of the ILAE Commission on Therapeutic Strategies. Epilepsia. 2010;51:1069–77. doi: 10.1111/j.1528-1167.2009.02397.x. [DOI] [PubMed] [Google Scholar]
- 40.Li R, Yu C, Li Y, Lam TW, Yiu SM, Kristiansen K, Wang J. SOAP2: An improved ultrafast tool for short read alignment. Bioinformatics. 2009;25:1966–7. doi: 10.1093/bioinformatics/btp336. [DOI] [PubMed] [Google Scholar]
- 41.Zhang Y, Liu T, Meyer CA, Eeckhoute J, Johnson DS, Bernstein BE, Nusbaum C, Myers RM, Brown M, Li W, Liu XS. Model-based analysis of ChIP-Seq (MACS) Genome Biol. 2008;9:R137. doi: 10.1186/gb-2008-9-9-r137. [DOI] [PMC free article] [PubMed] [Google Scholar]
- 42.Mortazavi A, Williams BA, McCue K, Schaeffer L, Wold B. Mapping and quantifying mammalian transcriptomes by RNA-Seq. Nat Methods. 2008;5:621–8. doi: 10.1038/nmeth.1226. [DOI] [PubMed] [Google Scholar]
- 43.Abdi H. The Bonferonni and Šidák Corrections forMultiple Comparisons. In: Salkind N.J, editor. Encyclopedia of Measurement and Statistics. Thousand Oaks, CA: Sage; 2007. [Google Scholar]
- 44.Audic S, Claverie JM. The significance of digital gene expression profiles. Genome Res. 1997;7:986–95. doi: 10.1101/gr.7.10.986. [DOI] [PubMed] [Google Scholar]
- 45.Liang D, Zhang Z, Wu H, Huang C, Shuai P, Ye CY, Tang S, Wang Y, Yang L, Wang J, Yin W, Xia X. Single-base-resolution methylomes of Populus trichocarpa reveal the association between DNA methylation and drought stress. BMC Genet. 2014;15:S9. doi: 10.1186/1471-2156-15-S1-S9. [DOI] [PMC free article] [PubMed] [Google Scholar]
- 46.Benjamini Y, Yekutieli D. The control of the false discovery rate in multiple testing under dependency. The Annals of Statistics. 2001;29:1165–88. [Google Scholar]
- 47.Eisen MB, Spellman PT, Brown PO, Botstein D. Cluster analysis and display of genome-wide expression patterns. Proc Natl Acad Sci USA. 1998;95:14863–8. doi: 10.1073/pnas.95.25.14863. [DOI] [PMC free article] [PubMed] [Google Scholar]
- 48.Saldanha AJ. Java Treeview-extensible visualization of microarray data. Bioinformatics. 2004;20:3246–8. doi: 10.1093/bioinformatics/bth349. [DOI] [PubMed] [Google Scholar]
Associated Data
This section collects any data citations, data availability statements, or supplementary materials included in this article.