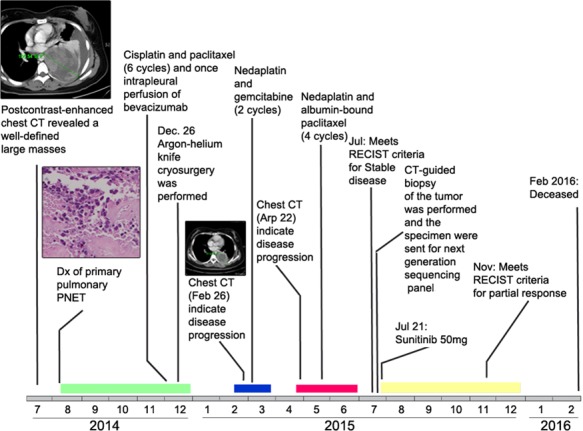
Figure 1. Time line of patient's pulmonary PNET diagnosis, treatment, and response.

Colored rectangles near the time line represent durations of chemotherapy (green, blue, red) and targeted therapy (yellow). Original magnification, ×200. Dx, diagnosis.
