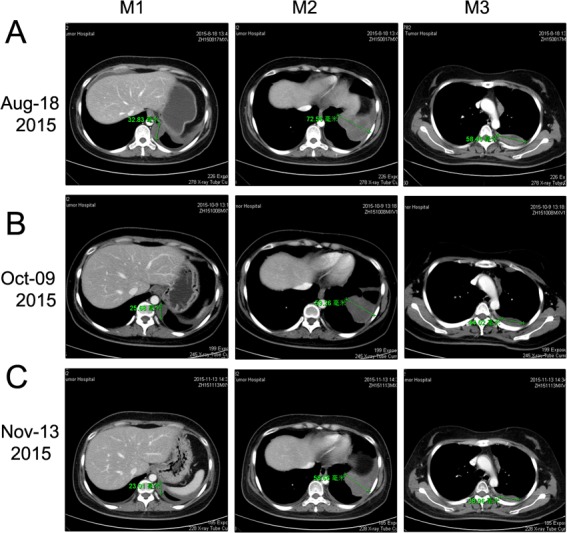
Figure 6. Chest CT scan documenting responses to Sunitinib.

A. After 4 weeks of treatment with Sunitinib (50 mg/day), CT image showing a SD (-14.12%, Aug 18, 2015). B. After about three months of treatment with Sunitinib, CT image showing a PR (-32.41%, Oct 09, 2015). C. After continuous treatment with Sunitinib for about four months, CT image showing a confirmed PR (-36.78%, Nov 13, 2015).
