

Abstract
Key points
Muscle‐derived thermogenesis during acute cold exposure in humans consists of a combination of cold‐induced increases in skeletal muscle proton leak and shivering.
Daily cold exposure results in an increase in brown adipose tissue oxidative capacity coupled with a decrease in the cold‐induced skeletal muscle proton leak and shivering intensity.
Improved coupling between electromyography‐determined muscle activity and whole‐body heat production following cold acclimation suggests a maintenance of ATPase‐dependent thermogenesis and decrease in skeletal muscle ATPase independent thermogenesis.
Although daily cold exposure did not change the fibre composition of the vastus lateralis, the fibre composition was a strong predictor of the shivering pattern evoked during acute cold exposure.
Abstract
We previously showed that 4 weeks of daily cold exposure in humans can increase brown adipose tissue (BAT) volume by 45% and oxidative metabolism by 182%. Surprisingly, we did not find a reciprocal reduction in shivering intensity when exposed to a mild cold (18°C). The present study aimed to determine whether changes in skeletal muscle oxidative metabolism or shivering activity could account for these unexpected findings. Nine men participated in a 4 week cold acclimation intervention (10°C water circulating in liquid‐conditioned suit, 2 h day–1, 5 days week–1). Shivering intensity and pattern were measured continuously during controlled cold exposure (150 min at 4 °C) before and after the acclimation. Muscle biopsies from the m. vastus lateralis were obtained to measure oxygen consumption rate and proton leak of permeabilized muscle fibres. Cold acclimation elicited a modest 21% (P < 0.05) decrease in whole‐body and m. vastus lateralis shivering intensity. Furthermore, cold acclimation abolished the acute cold‐induced increase in proton leak. Although daily cold exposure did not change the fibre composition of the m. vastus lateralis, fibre composition was a strong predictor of the shivering pattern evoked during acute cold. We conclude that muscle‐derived thermogenesis during acute cold exposure in humans is not only limited to shivering, but also includes cold‐induced increases in proton leak. The efficiency of muscle oxidative phosphorylation improves with cold acclimation, suggesting that reduced muscle thermogenesis occurs through decreased proton leak, in addition to decreased shivering intensity as BAT capacity and activity increase. These changes occur with no net difference in whole‐body thermogenesis.
Keywords: cold‐acclimation, energy metabolism, non‐shivering thermogenesis, proton leak, shivering, uncoupling
Key points
Muscle‐derived thermogenesis during acute cold exposure in humans consists of a combination of cold‐induced increases in skeletal muscle proton leak and shivering.
Daily cold exposure results in an increase in brown adipose tissue oxidative capacity coupled with a decrease in the cold‐induced skeletal muscle proton leak and shivering intensity.
Improved coupling between electromyography‐determined muscle activity and whole‐body heat production following cold acclimation suggests a maintenance of ATPase‐dependent thermogenesis and decrease in skeletal muscle ATPase independent thermogenesis.
Although daily cold exposure did not change the fibre composition of the vastus lateralis, the fibre composition was a strong predictor of the shivering pattern evoked during acute cold exposure.
Abbreviations
- BAT
brown adipose tissue
- BB
m. bicep brachii
- BF
m. bicep femoris
- CS
citrate synthase
- DT
m. deltoideus
- EMG
electromyography
- 18FDG
18F‐fluorodeoxyglucose
- LD
m. latissimus dorsi
- NST
non‐shivering thermogenesis
- MVC
maximal voluntary contraction
- OCR
oxygen consumption rate
- PET
positron emission tomography
- PM
m. pectoralis major
- RA
m. rectus abdominis
- RF
m. rectus femoris
- RMS
root‐mean‐square
- SCM
m. sternocleidomastoid
- SUV
standard uptake value
- TB
m. tricep brachii
- TS
m. trapezius superior
- VL
m. vastus lateralis
- VM
m. vastus medialis
Introduction
A hallmark of cold acclimation in rodents and other small mammals is the progressive shift in the source of heat production during acute cold exposure, from predominantly shivering to brown adipose tissue (BAT) (Chaffee et al. 1975; Wiesinger et al. 1990). This is generally accomplished without significant changes in whole‐body heat production. Whether one mechanism of heat production is evoked preferentially or both are recruited concurrently depends on the acclimation status of the animal and the thermal demands of the acute cold exposure (Himms‐Hagen, 2004). In humans, this relationship has remained ambiguous. Although the variability in cold‐acclimation phenotypes has been well described in various comprehensive reviews (Launay & Savourey, 2009; Makinen, 2010; Young, 2011), historically, cold‐induced thermogenesis in humans has typically been attributed exclusively to shivering. To date, only two cold acclimation studies have simultaneously quantified shivering and whole‐body heat production (Davis, 1961; Blondin et al. 2014). However, the role of non‐shivering thermogenesis (NST) in this context has remained unaddressed.
In large mammals or birds in which BAT is either absent or represents a smaller proportion of total body weight, skeletal muscle‐derived thermogenesis is the predominant source of heat production (Schaeffer et al. 2005; Teulier et al. 2010). This skeletal muscle‐derived heat production can come in the form of both shivering and NST. A consequence of this greater reliance on skeletal muscle thermogenesis is that intermittent or chronic cold exposure in these animal models and in humans living or working in a cold environment (i.e. cold acclimatization) results in structural and metabolic alterations in skeletal muscle. These alterations resemble the training effects of endurance exercise, in particular, changes in coupling efficiency of oxidative phosphorylation and interconversion of muscle fibres (Duchamp et al. 1992; Bae et al. 2003; Schaeffer et al. 2003; Louzada et al. 2014). Furthermore, whether repeated cold exposure stimulates changes in BAT, skeletal muscle or both, the physiological capacity of these structural modifications may only be fully manifested under conditions in which it is required, namely at temperatures below the cold‐acclimation temperature (Himms‐Hagen, 2004). The present study was thus designed to address the hypothesis that prolonged daily cold exposure significantly modulates skeletal muscle thermogenesis in cold‐exposed humans, with the thermogenic contribution of NST shifting from skeletal muscle to BAT.
Methods
Ethical approval
Nine healthy, non‐cold acclimatized men, aged 23 ± 1 years with a body mass index of 24.4 ± 0.9 kg m–2, body weight of 80.3 ± 3.2 kg and body surface area of 2.01 ± 0.03 m2 (Table 1), were fully informed of the risks and methodologies applied and subjects provided their written consent to participate in the present study, in accordance with the Declaration of Helsinki. The study received ethics approval from the Office of Research Ethics and Integrity at the University of Ottawa and the Institutional Review Board for research on humans of the Centre hospitalier universitaire de Sherbrooke and Université de Sherbrooke. Individuals taking any medications or with a history or clinical evidence of a medical condition known to affect blood glucose or lipid levels, or insulin sensitivity, or who had known metabolic or cardiovascular disease, were excluded.
Table 1.
Participant characteristics
| Pre‐acclimation | Post‐acclimation | |
|---|---|---|
| N | 9 | |
| Age (years) | 23 ± 1 | |
| Height (cm) | 183.0 ± 2.3 | |
| BSA (m2) | 2.01 ± 0.04 | |
| BMI (kg/m2) | 24.4 ± 0.9 | |
| Weight (kg) | 80.3 ± 3.2 | 80.1 ± 3.6 |
| Fasting glucose (mmol/L)† | 4.9 ± 0.2 | 4.5 ± 0.1 |
| Fasting NEFA (μmol/L)† | 381 ± 54 | 439 ± 96 |
| Fasting insulin (pmol/L)† | 72.7 ± 15.1 | 63.2 ± 16.4 |
| Fasting TG (mmol/L)† | 1.3 ± 0.4 | 1.0 ± 0.4 |
| BAT volume (mL)† | 66 ± 30 | 95 ± 28* |
| Cold‐induced total BAT oxidative metabolism (volume [mL] x 11C‐acetate k [sec−1]) | 0.46 ± 0.21 | 1.30 ± 0.19* |
Data are expressed as mean ± SEM.
* P < 0.05 vs. pre‐acclimation. † n = 6, data from (Blondin et al., 2014).
BSA, body surface area; NEFA, nonesterified fatty acids; TG, triglycerides.
Experimental protocol
Non‐cold acclimatized men participated in a 4 week cold acclimation protocol consisting of daily cold exposure lasting 2 h, repeated five consecutive days per week for four consecutive weeks (Fig. 1). On the cold acclimation days, participants arrived between 7.00 and 9.00 h in the fasted state and were fitted with a liquid conditioned suit (LCS; Three Piece, Allen‐Vanguard, Ottawa, ON, Canada) in which water at 10 °C was circulated for 2 h. Participants were asked to maintain their habitual exercise training volume and intensity and refrain from drinking caffeinated or alcoholic beverages for the duration of the study. Acute cold experimental sessions at 4 °C were performed before and after the 4 week cold acclimation to assess muscle‐specific and whole‐body metabolism (current study). Acute cold experimental sessions at 18 °C were also performed before and after the 4 week cold acclimation to examine changes in the volume of metabolically active BAT and its oxidative capacity. A full description of our findings is provided elsewhere (Blondin et al. 2014).
Figure 1. Overall study design.
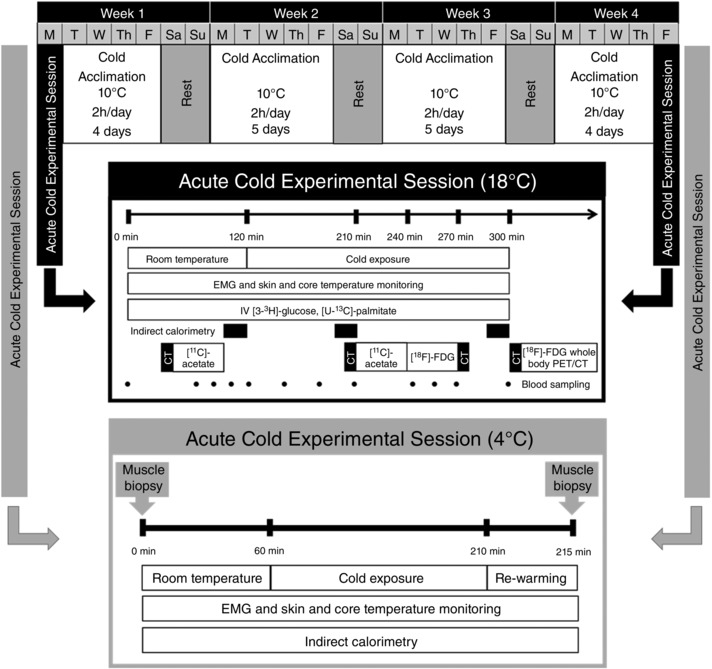
Four week cold acclimation preceded and followed by an acute cold experimental session protocol at 18 °C (Blondin et al., 2014) and at 4 °C (present study).
Each 4 °C acute cold exposure experimental session was conducted between 7.30 h and 16.00 h, following a 48 h period without strenuous physical activity. The evening before testing, a standardized meal (3220 kJ or 770 kcal, 42% CHO, 28% fat and 30% protein) was ingested between 18.00 and 20.00 h and the subjects were asked to report to the laboratory at 7.30h the next morning after a 12–14 h fast. Upon their arrival in the laboratory, subjects wearing only shorts were weighed and instrumented with temperature sensors and surface electromyography (EMG) electrodes. Participants were then fitted with the LCS and were asked to ingest a telemetric thermometry capsule to measure core temperature (Vital Sense monitor and Jonah temperature capsule; Mini Mitter Co., Inc., Bend, OR, USA) and to perform a series of muscle contractions to estimate the maximal voluntary contraction (MVC) of each of the muscles being measured for shivering activity. Subjects were then asked to empty their bladder and remain seated for 60 min at ambient temperature (∼23‐25 °C). Following this baseline period, the LCS was perfused with 4 °C water (Time = 0) for 150 min using a temperature and flow controlled circulation bath (Isotemp 6200R28; Fisher Scientific Co., Pittsburgh, PA, USA). Thermal responses, shivering activity, metabolic rate and substrate utilization were measured continuously during the final 30 min of baseline and the subsequent 150 min of cold exposure. Muscle biopsy samples from m. vastus lateralis were obtained before and within 5 min of terminating the 150 min of cold exposure, pre‐ and post‐acclimation.
BAT volume and oxidative metabolism
Changes in BAT volume and oxidative capacity were determined during the 18 °C acute cold exposure (Blondin et al. 2014). In brief, an i.v. bolus of 18F‐fluorodeoxyglucose (18FDG) (∼185 MBq) was given 120 min into the cold exposure. After cold exposure, a whole‐body computed tomography scan followed by a static whole‐body positron emission tomography (PET) acquisition was performed to determine whole‐body 18FDG organ distribution and tissue standard uptake values (SUV). Total BAT volume of activity on whole‐body scans were quantified in accordance with the criteria: tissue radiodensity between −30 and −150 Hounsfield units and 18FDG uptake during cold exposure of more than 1.5 SUVmean. BAT oxidative metabolism was determined using [11C]acetate PET, performed at room temperature and again 90 min after the start of cold exposure. Cold‐induced total BAT oxidative metabolism was quantified by taking the difference in the rapid fractional tissue clearance of [11C]acetate, (k in s−1), measured at room temperature and during cold exposure, multiplied by the total volume of metabolically active BAT, as determined by 18FDG (described above). This calculation was performed to reflect the total oxidative metabolism of BAT located throughout the body.
Thermal responses
Core temperature (T core) was measured using an ingested telemetric pill which measures the temperature in the intestine (Vital Sense monitor and Jonah temperature capsule, Mini Mitter Co.). Mean skin temperature () was monitored continuously using 12 autonomous wireless temperature sensors (Thermochron iButton® model DS1922H; Maxim Integrated, San Jose, CA, USA) fixed to the skin, calculated using an area‐weighted equation from 12 sites: forehead, chest, biceps, forearm, abdomen, lower and upper back, front and back calf, quadriceps, hamstrings and hand (Hardy and Dubois, 1938).
Whole‐body thermogenesis and fuel selection
Whole‐body metabolic rate and fuel selection were quantified by indirect calorimetry (TurboFox, Sable Systems International, Las Vegas, NV, USA). The rates of oxygen consumption () and carbon dioxide production () were calculated using equations described previously by Brown et al. (1984) adapted for its application with a canopy. This approach allowed for a constant measurement and subsequent correction for the dilution effect of water vapor pressure on and. A background baselining technique was then applied to correct for analyser drift (Melanson et al. 2010). Total protein (RPox), carbohydrate (RCox) and lipid (RFox) oxidation rates (g min–1) were calculated as described previously (Haman et al. 2002; Haman et al. 2004 c):
| (1) |
| (2) |
| (3) |
where urinary urea excretion (UREAurine) was measured in urine collected over the 90 min of the baseline period and 150 min in the cold using a commercial urea assay kit (BioAssay Systems, Hayward, CA, USA) and (l min–1) and (l min–1) were corrected for the volumes of O2 and CO2 corresponding to protein oxidation (1.010 and 0.843 l g–1, respectively). Energy potentials of 16.3 kJ g–1 (CHO), 40.8 kJ g–1 (lipids) and 19.7 kJ g–1 (proteins) were used to calculate the relative contributions of each fuel to total heat production (Elia, 1991; Péronnet & Massicotte, 1991).
Muscle recruitment
Shivering EMG signals were recorded from 12 muscles: m. trapezius superior (TS), m. latissimus dorsi (LD), m. sternocleidomastoid (SCM), m. pectoralis major (PM), m. deltoideus (DT), m. bicep brachii (BB), m. tricep brachii (TB), m. rectus abdominis (RA), m. vastus lateralis (VL), m. rectus femoris (RF), m. vastus medialis (VM) and m. bicep femoris (BF). Surface electrodes (Delsys, Boston, MA, USA) were placed over the bellies of each muscle and their exact position was identified with an indelible skin marker to allow consistent placement between experimental sessions. Raw EMG signals were collected at 1000 Hz, filtered to remove spectral components below 20 Hz and above 500 Hz as well as 60 Hz contamination and related harmonics, and analysed using custom‐designed MATLAB algorithms (Mathworks, Natick, MA, USA). Shivering activity of the 12 individual muscles was monitored 10 min before and continuously throughout cold exposure. Voluntary muscle activity was minimized as much as possible throughout cold exposure by asking participants to avoid voluntary movements during the recording periods.
Shivering intensity of individual muscles was determined from root‐mean‐square (RMS) values calculated from raw EMG signals using a 50 ms overlapping window (50%). In brief, baseline RMS values (RMSbaseline: 15 min RMS average measured prior to cold exposure) were subtracted from shivering RMS (RMSshiv) values and RMS values obtained from the maximal voluntary contractions of individual muscles (RMSmvc). Shivering intensity was normalized to RMSmvc using the equation:
| (4) |
Shivering activities of each muscle were summed, taking into account the relative mass of the body region they represent, to obtain an index of whole‐body shivering activity, as described previously (Bell et al. 1992; Haman et al. 2004 a).
| (5) |
where , , and are upper trunk (UT: average of TR, LD, SCM, PM), lower trunk (LT: RA), upper limb (UL: average of VL, RF, VM, BF) and lower limb (LL: average of DT, BB, TB) shivering intensity. The coefficients f UT (0.34), f LT (0.19), f UL(0.29) and f LL (0.085) correspond to the relative muscle masses of each body region to total muscle mass (Bell et al. 1992). This whole‐body index represents 91% of total muscle mass and excludes deep muscle groups, lower leg muscles and muscles found on the head, hand or feet.
Shivering pattern was determined as described previously (Haman et al. 2004 a), where an example of EMG signal showing the two shivering patterns is illustrated. In brief, a shivering burst was defined as an EMG interval with a duration > 0.2 s, an inter‐burst interval > 0.75 s and an amplitude higher than the intensity threshold at each recording period. Intensity threshold was determined by: (i) averaging shivering intensity (A EMG) over the entire recording period; (ii) averaging the remaining values above A EMG (B EMG); and (iii) setting the intensity threshold at B EMG. Whole‐body burst shivering was calculated as the average of the burst rate of individual muscles. The mean shivering intensity (in %MVC) of both continuous shivering and burst shivering was also determined.
Muscle biopsy sampling and analyses
m. vastus lateralis muscle biopsy samples (50–100 mg) were obtained under local anaesthesia (xylocaine 1% and marcaine 0.5%), using a Bergstrom needle (Keir Surgical, Vancouver, Canada), as described previously (Bergstrom, 1962), prior to cold exposure and again within 5 min of completing cold exposure. For the latter, participants were reheated by circulating warm water (35 °C) for 5 min through the liquid conditioned suit to inhibit shivering (Imbeault et al. 2013). Samples were then partitioned for muscle histology, protein quantification and permeabilized muscle fibre oxygen consumption.
Analysis of myosin heavy chain isoform composition
A small piece from the m. vastus lateralis biopsies performed before the acute cold exposure pre‐ and post‐acclimation was subjected to a sucrose gradient for further myosin heavy chain isoform staining as described by (Gerrits et al. 2010).
Permeabilized muscle fibre oxygen consumption
Oxygen consumption was measured on fresh permeabilized muscle fibres, as described previously (Kuznetsov et al. 2008; Aguer et al. 2010). All measurements were carried out in a single trace. Briefly, after muscle fibre isolation and permeabilization with saponin (50 μg ml–1), oxygen consumption was measured in different states using a specific protocol. First, muscle fibres were added to the chambers and state 1 respiration determined (no substrate added). Second, state 2 was measured by adding complex I substrates: 5 mm malate/10 mm glutamate (no ADP). Then, state 3 was determined using saturating amount of ADP (2 mm). Next, 0.5 μm rotenone and 10 mm succinate were added to inhibit complex I and activate complex II, respectively. Proton leak (state 4) was then tested by oligomycin‐induced ATP synthase inhibition (4 μg ml–1). Finally, non‐mitochondrial respiration was measured after complex III inhibition by 5 μm antimycin. Outer mitochondrial membrane integrity was confirmed with 10 μm cytochrome c. The muscle bundles were dried overnight and weighed the following day using an analytical balance as described previously (Bordenave et al. 2008; Aguer et al. 2010). Oxygen consumption rates (OCR) are shown as mitochondrial OCR [after subtraction of non‐mitochondrial OCR (complex III inhibition by antimycin)] expressed as nmol O2 consumed min–1 (mg dry muscle weight)–1. Non‐mitochondrial OCR was not significantly different between experimental conditions (Fig. 3 A). The percentage of OCR as a result of proton leak was calculated as: (state 4 OCR (proton leak)/state 3 OCR) × 100.
Figure 3. Relationship between EMG‐determined muscle activity and whole‐body heat production.
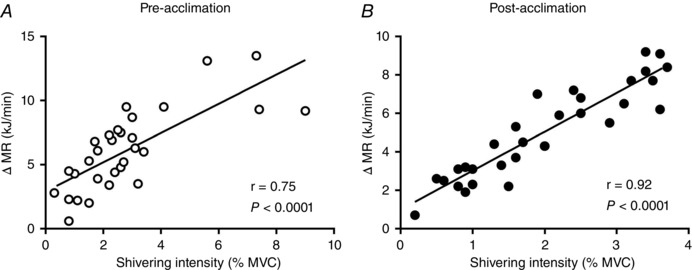
Relationship between cold‐induced changes in metabolic rate (MR) and shivering intensity in men exposed to 4 °C for 150 min (A) prior to and (B) following a 4 week cold acclimation. Values presented are from five sampling intervals during cold exposure (time = 30, 60, 90, 120 and 150 min) from all subjects also having had a muscle biopsy (n = 6).
Muscle homogenates
m. vastus lateralis extracts were homogenized on ice in a lysis buffer containing (in mm): 20 Tris HCl, pH 7.4, 1% Triton X100, 50 NaCl, 250 sucrose, 50 NaF, 5 NaPP, 1 Na3VO4, and protease inhibitors. The homogenate was centrifuged at 14 000 g for 20 min at 4 °C, and the supernatant aliquoted and frozen at −80 °C for subsequent Western blots.
Western blots
Western blots were performed as described previously (Aguer et al. 2010) using 30 μg of protein from homogenized m. vastus lateralis. The primary antibodies used were: polyclonal anti‐UCP3 (Abcam, Cambridge, MA, USA), total OXPHOS human antibody cocktail (Abcam) and monoclonal anti‐α‐tubulin (Sigma‐Aldrich, Oakville, ON, Canada) as a loading control. Every antibody was diluted 1:1000. The secondary antibodies were anti‐mouse (sc‐2005) and anti‐rabbit (sc‐2030) antibodies coupled with horseradish peroxidase (Santa Cruz Biotechnology, Santa Cruz, CA, USA), diluted 1:3000 and 1:2000, respectively. Proteins were visualized using an enhanced luminescence reagent and Chemi Doc Imager (UVP, Upland, CA, USA). Expression of proteins was quantified by densitometry analysis using ImageJ (National Institutes of Health, Bethesda, MD, USA).
Citrate synthase (CS) activity
Aliquots of homogenized m. vastus lateralis were used to measure CS activity after two sets of freeze/thaw cycles. Citrate synthase activity was measured with 0.6 mmol l–1 oxaloacetate, 0.48 mmol l–1 acetyl‐CoA, 0.1 mmol l–1 5, 5′‐dithiobis‐2‐nitro‐benzoic acid, 100 mmol l–1 Tris (pH 8.3) and 0.4% (v/v) Triton 100X. Enzyme activity was monitored by recording the changes in absorbance every 20 s at 412 nm over 5 min at 37 °C and normalized to protein content.
Statistical analysis
Data are expressed as the mean ± SEM. A paired Student's t test was used to compare between acute cold exposure experimental sessions. ANOVA for repeated measures with acclimation status, temperature and their interaction as the independent variables was used to analyse acclimation‐ and temperature‐dependent differences in thermal responses (T core, , temperature gradients), metabolic responses (metabolic heat production and fuel utilization), EMG activity (shivering intensity, burst rate), muscle respiration, protein expression and CS activity throughout the protocols. Bonferonni's multiple comparisons post hoc test was used, where applicable. Spearman correlation coefficients were used to determine correlations between variables. P < 0.05 (two‐tailed) was considered statistically significant. All analyses were performed using SPSS, version 16.0 (SPSS Inc., Chicago, IL, USA) or Prism, version 6.00 (GraphPad, San Diego, CA, USA).
Results
Effects of cold acclimation on thermoregulatory responses
Six of the nine men participated in mild cold exposure experimental sessions (∼18°C water in LCS) before and after the 4 week cold acclimation to investigate the effect of the acclimation protocol on BAT capacity and activity (Blondin et al. 2014). This cold acclimation increased the volume of metabolically active BAT by 45% (P < 0.05) and the cold‐induced total BAT oxidative metabolism, under mild cold exposure (∼18°C), by 182% (P = 0.02) (Table 1). During the 150 min 4°C cold exposure, fell significantly both before and after the 4 week acclimation (P < 0.0001), whereas T core only decreased post‐acclimation (from 37.0 ± 0.1°C to 36.5 ± 0.1°C, P = 0.02) (Fig. 2 A and B). This cold stimulus resulted in similar total heat production before compared to after the 4 week cold acclimation (1623 ± 42 kJ pre‐acclimation vs. 1590 ± 69 kJ post‐acclimation, P = 0.67) (Fig. 2 C). This uncompensated fall in core temperature is typical of a ‘hypothermic’ cold acclimation phenotype (i.e. blunted thermogenic response to cold stimulus) (Young, 2011). Total shivering intensity decreased by 21 ± 9 % following the cold acclimation (P = 0.04) (Fig. 2 D), whereas the burst shivering rate did not change (P = 0.82) (Fig. 2 E). Rather, there was a decrease in total burst shivering intensity (P = 0.03) (Fig. 2 F). Similarly, the shivering intensity of the m. vastus lateralis was only 21 ± 10 % lower post‐acclimation (P = 0.05) (Fig. 2 G), whereas burst shivering rate was unchanged (Fig. 2 H). There was a decrease in both continuous and burst shivering intensity (Fig. 2 I). There was a strong correlation observed between cold‐induced thermogenesis and shivering intensity pre‐acclimation, which increased even further following cold acclimation (r = 0.75 pre‐acclimation vs. r = 0.92 post‐acclimation, P < 0.0001) (Fig. 3 A and B). The slope of the regression line is significantly greater post‐acclimation (2.0 ± 0.2 kJ min−1 %MVC−1) compared to pre‐acclimation (1.1 ± 0.2 kJ min−1 %MVC−1) (P = 0.006).
Figure 2. Thermal responses.
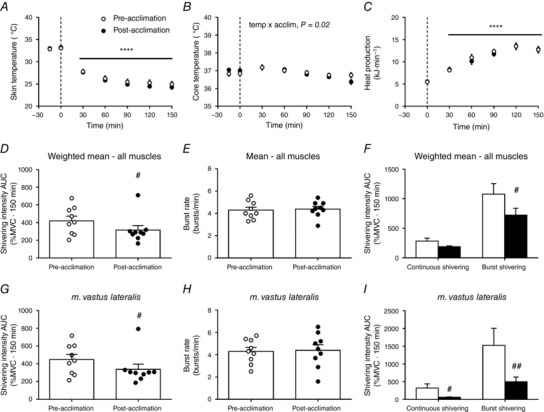
Mean skin (A) and core temperature (B) during room temperature and cold exposure, pre‐ and post‐acclimation. C, total energy expenditure during cold exposure, pre‐ and post‐acclimation. Weighted mean of total muscle shivering activity (D), burst shivering rate (E), and continuous and burst shivering intensity (F) pre‐ and post‐acclimation. Mean shivering activity (G), burst shivering rate (H), and continuous and burst shivering intensity (I) of m. vastus lateralis, pre‐ and post‐acclimation. **** P < 0.0001 vs. room temperature (ANOVA with Bonferonni post hoc test). # P < 0.05, ## P < 0.01 vs. pre‐acclimation (Student's t test).
Effects of cold acclimation on permeabilized muscle fibre respiration
The effect of acute cold exposure and cold acclimation on skeletal muscle mitochondrial energetics was determined by measuring the OCR of permeabilized m. vastus lateralis (Fig. 4 A). Oxygen consumption in the presence of substrates only (glutamate/malate, state 2 respiration) showed a trend for an increase after the cold acclimation protocol (P = 0.07) (Fig. 4 A). ADP‐stimulated respiration (state 3 respiration) with complex I substrates (glutamate/malate) or complex II substrate (succinate in presence of rotenone to inhibit complex I) was not affected significantly by acute cold exposure or cold acclimation. Non‐phosphorylating (state 4) respiration increased by a remarkable 4.4‐fold when exposed to an acute cold in unacclimated individuals (from 0.9 ± 0.2 nmol min−1 mg dry muscle−1 to 3.9 ± 1.1 nmol min−1 mg dry muscle−1), indicating an increase in proton leak, although this acute cold exposure‐induced increase was completely abolished once participants were acclimated (temperature by acclimation interaction, P = 0.04). Indeed, percentage OCR as a result of proton leak doubled when acutely exposed to the cold in unacclimated individuals (from 18 ± 5 % OCR at room temperature to 41 ± 4 % OCR in acute cold, P < 0.04), although it was not changed once acclimated (from 18 ± 3 % OCR at room temperature to 20 ± 3 % OCR in acute cold, P = 0.9) (Fig 4 D). To determine whether cold acclimation had an effect on muscle mitochondrial content, we measured the protein levels of mitochondrial complexes, as well as CS activity (Larsen et al. 2012). Cold acclimation had no significant effect on complex II, complex III or complex V (ATP synthase) protein levels (Fig. 4 B and C), nor on CS activity (Fig. 4 E). Acute cold exposure tended to increase complex II (P = 0.06) (Fig. 4 B and C) and UCP3 content (P = 0.07) (Fig. 4 F) and significantly increased complex V content (P = 0.05) (Fig. 4 B and C). There was a strong association between percentage OCR as a result of proton leak and m. vastus lateralis shivering intensity pre‐acclimation (r = 0.90, P = 0.01) (Fig. 4 G), which was lost post‐acclimation (r = −0.31, P = 0.55).
Figure 4. Oxygen consumption in permeabilized muscle fibres.
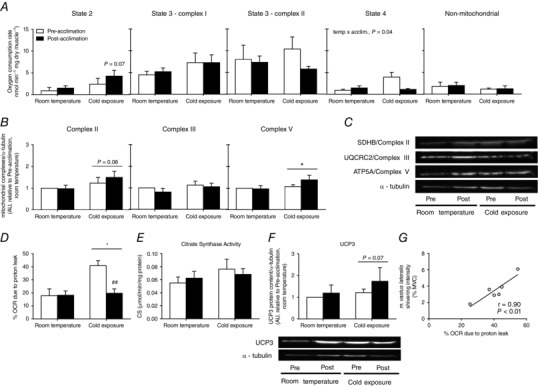
A, state 2, state 3 (complex I), state 3 (complex II) and state 4 (measured after ATP synthase inhibition by oligomycin treatment) and non‐mitochondrial (measured after complex III inhibition by antimycin A treatment) OCR at room temperature and immediately following cold exposure prior to and following a 4 week cold acclimation (n = 6). B, quantification of mitochondrial respiratory chain complexes (Complex II, III and V (ATP synthase) presented relative to pre‐acclimation room temperature conditions (n = 8). C, representative Western blots in m. vastus lateralis., with α‐tubulin used as a loading control (bottom). D, percentage of OCR as a result of proton leak at room temperature and immediately following cold exposure prior to and following a 4 week cold acclimation (n = 6). E, citrate synthase activity measured in m. vastus lateralis at room temperature and immediately following cold exposure prior to and following a 4 week cold acclimation (n = 8). F, quantification of UCP3 expression (top) presented relative to pre‐acclimation room temperature conditions (n = 8) and representative Western blots of UCP3 expression in m. vastus lateralis (bottom). α‐tubulin was used as a loading control. G, relationship between percentage of OCR as a result of proton leak and m. vastus lateralis shivering intensity pre‐acclimation (n = 6). * P < 0.05 vs. room temperature, ## P < 0.01 vs. pre‐acclimation (ANOVA with Bonferonni post hoc test).
Effects of cold acclimation on fibre composition, shivering pattern and substrate utilization
We then investigated whether 4 week cold acclimation could modify the fibre composition of the m. vastus lateralis. We found no changes in fibre composition in the m. vastus lateralis as a result of the cold acclimation (Fig. 5 A). There was, however, a strong association between the relative fibre composition of the m. vastus lateralis and shivering intensity (Fig. 5 B and C). Unacclimated individuals with a greater proportion of type I fibres elicited lower shivering intensities (r = −0.77, P = 0.04) (Fig. 5B), whereas those with a greater proportion of type IIa fibres elicited higher shivering intensities (r = 0.79, P = 0.03) (Fig. 5 C).
Figure 5. Quantification of fibre typing of m. vastus lateralis by immunohistochemical detection.
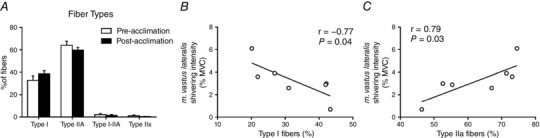
Fibre‐type proportions in the m. vastus lateralis prior to and following a 4 week cold acclimation (n = 7). A, muscle sections were stained based on myosin heavy chain expression for type I, type IIa, type I‐IIa hybrid and type IIx (unstained fibres). Relationship between m. vastus lateralis shivering intensity and proportion of type I fibres (B) or type IIa fibres (C).
Carbohydrate and lipid oxidation rates and their contributions to thermogenesis both increased during an acute cold exposure (Fig. 6 A and B), athough there was no change following cold acclimation. Protein utilization and its contribution to thermogenesis increased during the acute cold exposure in unacclimated individuals but not following the cold acclimation (time by acclimation interaction, P = 0.02).
Figure 6. Whole‐body substrate utilization.
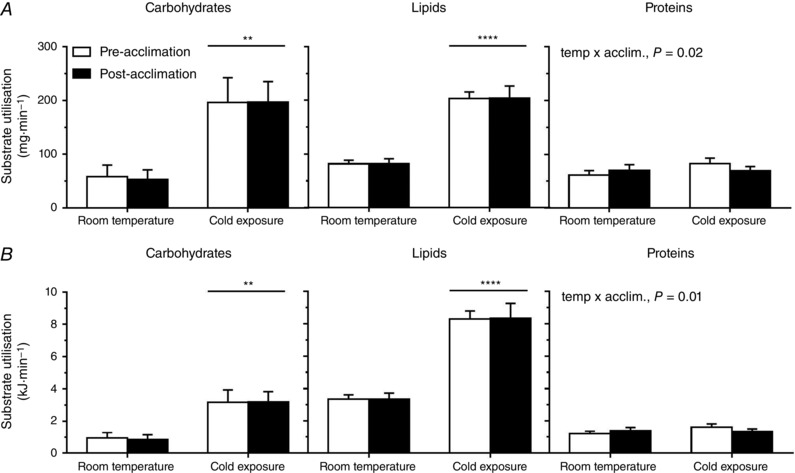
Absolute (A) and relative (B) substrate utilization at room temperature and during cold exposure prior to and following a 4 week cold acclimation. Values are the mean ± SE (n = 9). ** P < 0.01, **** P < 0.0001 vs. room temperature (ANOVA with Bonferonni post hoc test).
Discussion
Recently, there has been considerable interest regarding the efficacy of cold‐acclimation in recruiting BAT and the metabolic consequences of these changes (van der Lans et al. 2013; Yoneshiro et al. 2013; Blondin et al. 2014; Lee et al. 2014; Hanssen et al. 2015 a, b ). However, much less is known regarding the changes to skeletal muscle following such cold acclimations. Our results show that a 4 week cold acclimation not only increases BAT oxidative capacity, but also concomitantly decreases proton leak and shivering intensity in skeletal muscle when exposed to a 4 °C acute cold stimulus, resulting in no net difference in whole‐body thermogenesis. Improved coupling between EMG‐determined muscle activity and whole‐body heat production resulting from daily cold exposure suggests that the contribution of ATPase‐dependent muscle thermogenesis increases, whereas that of ATPase independent muscle thermogenesis (i.e. muscle NST) decreases. Furthermore, in contrast to previous cold acclimatization studies (Bae et al. 2003), experimentally‐induced cold acclimation did not alter the fibre composition of the m. vastus lateralis, although we observed that shivering intensity was partly associated with differences in muscle fibre composition.
The sources of heat production in rodents acutely or chronically exposed to a cold stimulus have been well characterized but have remained unaddressed in humans. Using 18FDG PET, some studies have shown that daily cold exposure for as little as 10 days to as long as 1 month can increase the volume of BAT taking up glucose (assumed to represent BAT mass) by 40–45% (van der Lans et al. 2013; Blondin et al. 2014; Lee et al. 2014). Only one study to date has directly measured changes in BAT oxidative capacity and thus the true thermogenic change of the tissue, following cold‐acclimation, simultaneously with shivering intensity (Blondin et al. 2014). Despite observing a 182% increase in cold‐induced BAT oxidative metabolism with the present cold acclimation, there was no difference in EMG‐determined shivering intensity when exposed to a mild cold stimulus (∼18°C). We hypothesized that perhaps a colder stimulus is required to observe the expected decrease in shivering activity that is typically seen in rodents (Himms‐Hagen, 2004). Using the colder stimulus (4 °C), the present study still only shows a modest 21 ± 9 % decrease in total shivering intensity following the cold acclimation. Interestingly, this was the result not of a decrease in burst shivering rate, which is associated with the frequency in recruitment of high‐threshold motor units (type II, fast‐glycolytic, fatigable) (Petajan & Williams, 1972; Israel & Pozos, 1989; Meigal, 2002), but rather a decrease in burst shivering intensity and therefore the number of high‐threshold motor units recruited. Similarly, the shivering intensity of the m. vastus lateralis was only 21 ± 10 % lower post‐acclimation as a result of a decrease in both continuous and burst shivering intensity, suggesting a decrease in the recruitment of both low‐ (type I, slow‐oxidative, fatigue resistant) and high‐threshold motor units, respectively.
Shivering activity, as determined using surface EMG, reflects the sum of the motor unit action potentials for a given muscle whereby the amplitude of the EMG electrode signal increases as a function of the number of motor units involved (Fuglevand et al. 1992; Heckman & Enoka, 2012). Because these action potentials necessarily lead to the utilization of ATP to elicit a muscle contraction, metabolically, EMG activity reflects ATPase‐dependent muscle thermogenesis. Consequently, our previous and present findings suggest that both ATPase‐dependent and independent muscle thermogenesis may be decreasing following cold acclimation. Indeed, the tighter correlation observed between cold‐induced thermogenesis and shivering intensity following cold acclimation (r = 0.75 pre‐acclimation vs. r = 0.92 post‐acclimation, P < 0.0001) (Fig. 3 A and B) suggested that there might be an increased contribution of ATPase‐dependent thermogenesis to total skeletal muscle thermogenesis. The increased slope in this regression line post‐acclimation indicates that more heat is produced per increase in shivering intensity (%MVC) following cold acclimation compared to pre‐acclimation, thereby suggesting a possible increase in the contribution of ATPase‐dependent thermogenesis to total skeletal muscle thermogenesis. To examine this relationship further, we investigated the effect of cold acclimation on the efficiency of skeletal muscle mitochondrial oxidative phosphorylation in the m. vastus lateralis.
The effect of acute cold exposure and cold acclimation on skeletal muscle mitochondrial energetics was determined by measuring the oxygen consumption of permeabilized m. vastus lateralis fibres. Much to our surprise, non‐phosphorylating (state 4) respiration increased by 4.4‐fold when unacclimated individuals were exposed to an acute cold, indicating a substantial increase in proton leak. This response was completely abolished following the cold acclimation. Indeed, percentage OCR as a result of proton leak doubled when acutely exposed to the cold in unacclimated individuals, although it was not changed once acclimated. Only one other study has ever quantified state 4 respiration in skeletal muscle of cold‐exposed individuals, demonstrating a marginal albeit statistically non‐significant cold‐induced increase in unacclimated men (Wijers et al. 2008). However, the cold stimulus in this previous study was significantly milder (16°C room temperature) but substantially longer (82 h), rendering it difficult to compare. Similarly, the effects of acute exercise and training status on state 4 respiration remain inconclusive (Madsen et al. 1996; Fernstrom et al. 2004), thereby limiting its comparison. Future studies are required to confirm the magnitude of the cold‐induced increase in state 4 respiration and attempt to explain the mechanisms contributing to this change. In skeletal muscle, proton leak is considered to be driven by UCP3 and possibly adenine nucleotide translocase. Although the increase in UCP3 protein levels observed after the 2.5 h cold exposure was unexpected, UCP3 activity has been shown to be regulated through reversible glutathionylation, with ROS‐induced deglutathionylation activating UCP3 (Mailloux et al. 2011). It is thus possible that acute cold exposure increased UCP3 deglutathionylation pre‐acclimation but not post‐acclimation. Further research is needed to confirm this hypothesis. Another possibility is that cold‐exposure altered mitochondrial dynamics. Indeed, it has been recently shown that a 9 day cold exposure increases mitochondrial fusion in skeletal muscle of BAT‐deficient mice (Bal et al. 2016), a process that has been linked to increased mitochondrial coupling (Liesa & Shirihai, 2013). It is thus possible that increased mitochondrial fusion may explain improved mitochondrial coupling and decreased proton leak in skeletal muscle of humans chronically exposed to cold. Further studies will be designed to answer this important question.
Other studies have demonstrated a trend towards a cold‐induced increase in skeletal muscle mitochondrial uncoupling (Wijers et al. 2008), although this increase was smaller than in the present study. Given the strong association between shivering intensity and mitochondrial uncoupling seen in the present study (Fig. 4 G), it is possible that the colder stimulus and therefore greater shivering activity accounts for this greater mitochondrial uncoupling compared to Wijers et al. (2008). The novelty of the present study is that muscle biopsies were collected before and immediately upon terminating the acute cold exposure, pre‐ and post‐acclimation. It is therefore difficult to compare with previous cold‐acclimation studies that have examined acclimation‐induced changes in skeletal muscle bioenergetics (van der Lans et al. 2013; Hanssen et al. 2015 a, b ) because muscle biopsies had only previously been performed at room temperature before the cold exposure. Indeed, examining skeletal muscle mitochondrial respiration from biopsies taken at room temperature conditions in the present study would lead us to the conclusion reached by previous investigations that cold acclimation has no effect on mitochondrial uncoupling. Shivering intensity and proton leak were greater pre‐acclimation, which suggests that the thermogenic contribution of skeletal muscle, through both ATPase‐dependent (‘coupled’) and ATPase independent (‘uncoupled’) mechanisms, was significantly greater pre‐acclimation. In these same participants, BAT thermogenesis increased following cold acclimation, probably compensating at least in part for this decrease in muscle thermogenesis. Indeed, if we assume that total skeletal muscle thermogenesis represents ∼40% of whole‐body heat production during a mild cold exposure (Din et al. 2016) and, according to the muscle respiration reported in the present study, proton leak accounts for ∼40% of muscle respiration, we estimated that proton leak in skeletal muscle pre‐acclimation could account for ∼16% of whole‐body heat production compared to ∼24% from ATPase‐dependent (‘coupled’) thermogenesis. The EMG data suggest that ATPase‐dependent (‘coupled’) thermogenesis does not change following cold‐acclimation, whereas proton leak decreases to ∼20% of muscle respiration. With no change in whole‐body heat production post‐acclimation, this would suggest that ATPase‐dependent (‘coupled’) thermogenesis would still represent 24% of whole‐body heat production post‐acclimation, whereas we calculate that proton leak could account for only ∼2% of whole‐body heat production. Whether the decreased thermogenic contribution from skeletal muscle proton leak is entirely replaced by BAT thermogenesis alone or in combination with other thermogenic mechanisms is unclear.
The heterogeneity of fibre types between muscles and between individuals as well as their plasticity under various stimuli is well documented (Blaauw et al. 2013). Cold‐induced thermogenesis in humans can be maintained despite differences in the muscle fibre recruitment (Haman et al. 2004 b) or in the recruitment of different metabolic pathways within the same muscle fibres (Haman et al. 2004 a; Blondin et al. 2011). However, it was unclear whether muscle fibre composition could be a predictor of a given recruitment pattern and whether this could be modulated through prolonged daily cold exposure. In the present study, we showed a strong association between the relative fibre composition of the m. vastus lateralis and its shivering intensity. Unacclimated individuals with a greater proportion of type I fibres elicited lower shivering intensities (r = −0.77, P = 0.04), reflecting a greater number of low‐threshold motor units recruited, whereas those with a greater proportion of type IIa fibres elicited higher shivering intensities (r = 0.79, P = 0.03), reflecting a greater number of high‐threshold motor units recruited.
A study examining the morphological characteristics of the m. vastus lateralis in cold‐acclimatized Korean women breath‐hold divers compared to non‐acclimatized non‐divers has demonstrated a greater proportion of type IIx muscle fibres and lower proportion of type IIa muscle fibres in the cold‐acclimatized divers (Bae et al. 2003). We investigated whether 4 week cold acclimation could modify the fibre composition of the m. vastus lateralis. The results obtained showed no interconversion of muscle fibres in either direction and, consequently, no difference in substrate utilization in response to cold acclimation. One possible explanation for an absence of such a shift may be that 4 weeks of daily cold exposure was insufficient to effect changes in muscle composition. Alternatively, the rapid cold habituation that occurred using this particular cold acclimation protocol, which lead to a lower skin temperature threshold to solicit shivering after 2 weeks of acclimation (27.8 ± 0.6°C pre‐acclimation vs. 26.1 ± 0.3°C after 2 weeks, P = 0.007), may have limited the potential for muscle fibre interconversion. Consequently, overt shivering was only present for ∼30 min of the 120 min cold acclimation session after 2 weeks compared to ∼110 min pre‐acclimation. Future cold acclimation studies should focus on rapidly cooling the skin to a fixed temperature and clamping this temperature to ensure sustained shivering throughout the 2 h cold acclimation sessions.
Finally, despite differences in shivering activity and muscle bioenergetics, there were no differences in whole‐body heat production, carbohydrate utilization and fatty acid oxidation. With skeletal muscle proton leak decreasing in parallel with an increase in BAT oxidative capacity, following cold acclimation, this would suggest a shift in ATPase independent (‘uncoupled’ or NST) mechanisms of heat production between these two organs, without having an observable impact on whole‐body heat production. Given this apparent shift in NST from skeletal muscle to BAT combined with the significant reliance on intracellular triglycerides to fuel BAT thermogenesis (Ouellet et al. 2012; Blondin et al. 2014, 2015 a, 2015 b), it is not surprising to see fatty acids remaining the predominant substrate fueling whole‐body thermogenesis during a mild acute cold exposure. The acclimation‐induced decrease in protein utilization may also be a reflection of the shift from muscle to BAT thermogenesis.
In summary, we have demonstrated that 4 week cold acclimation suppressed the cold‐induced increase in proton leak and decreased shivering intensity in skeletal muscles at the same time as increasing BAT oxidative capacity. At the whole‐body level, we observed a tightening of the association between cold‐induced increase in heat production and shivering intensity after 4 week cold acclimation (pre‐acclimation r = 0.75, P < 0.0001; post‐acclimation r = 0.92, P < 0.0001). This finding suggests improved coupling between EMG‐determined muscle activity and heat production post‐acclimation, which is suggestive of an increased contribution of ATPase‐dependent thermogenesis to total muscle thermogenesis after cold acclimation. Thus, the results of the present study clearly demonstrate that a colder environmental stimulus is needed to elicit a reduction in the contribution of muscles to cold‐induced thermogenesis both from shivering and non‐shivering muscle thermogenesis. Combined with our previous study showing enhanced cold‐induced BAT thermogenesis after cold acclimation, the present study supports the reciprocal contribution of muscles and BAT to cold‐induced thermogenesis in humans.
Additional information
Conflict of interest
The authors declare that they have no competing interests.
Author contributions
DPB, M‐EH, CA and FH conceived or designed the study. DPB, HT, AD, CA, VB, TT and AWT acquired, analysed or interpreted data. DPB, AD, TT, HCT, VB, DR, ACC, AWT, M‐EH, CA and FH drafted and critically revised the work. All authors approved the final version of the manuscript, agree to be accountable for all aspects of the work in ensuring that questions related to the accuracy or integrity of any part of the work are appropriately investigated and resolved. All authors qualify for authorship and all those who qualify for authorship are listed.
Funding
This work was supported by a grant from the Natural Sciences and Engineering Research Council of Canada (NSERC Canada) to FH (RGPIN/ 326967‐2011), from l'Institut de recherche de l'Hôpital Montfort to CA, from the Canadian Institutes of Health Research (CIHR) to M‐EH (FDN143278) and Canadian Diabetes Association to ACC, DR, EET and FH (OG‐3‐10‐2970‐AC). PET imaging was performed at the at the Centre de recherche du Centre hospitalier universitaire de Sherbrooke, a research centre funded by the Fonds de la recherche du Québec ‐ Santé (FRQS). DPB is a recipient of a CIHR Postdoctoral fellowship. ACC holds the GSK Chair in Diabetes of the Université de Sherbrooke. DR is the recipient of the CIHR/Merck Frosst Research Chair on Obesity.
Acknowledgements
We thank Linda Jui for muscle fibre typing and Ghadi Antoun and Julie Martin for their assistance. We also thank the subjects of this study for their collaboration, and Allen‐Vanguard Inc. (Kevin Semeniuk) for providing the liquid‐conditioned suits.
Contributor Information
Céline Aguer, Email: celineaguer@montfort.on.ca.
François Haman, Email: fhaman@uottawa.ca.
References
- Aguer C, Mercier J, Man CY, Metz L, Bordenave S, Lambert K, Jean E, Lantier L, Bounoua L, Brun JF, Raynaud de Mauverger E, Andreelli F, Foretz M & Kitzmann M (2010). Intramyocellular lipid accumulation is associated with permanent relocation ex vivo and in vitro of fatty acid translocase (FAT)/CD36 in obese patients. Diabetologia 53, 1151–1163. [DOI] [PubMed] [Google Scholar]
- Bae KA, An NY, Kwon YW, Kim C, Yoon CS, Park SC & Kim CK (2003). Muscle fibre size and capillarity in Korean diving women. Acta Physiol Scand 179, 167–172. [DOI] [PubMed] [Google Scholar]
- Bal NC, Maurya SK, Singh S, Wehrens XH & Periasamy M (2016). Increased reliance on muscle‐based thermogenesis upon acute minimization of brown adipose tissue function. J Biol Chem 291, 17247–17257. [DOI] [PMC free article] [PubMed] [Google Scholar]
- Bell DG, Tikuisis P & Jacobs I (1992). Relative intensity of muscular contraction during shivering. J Appl Physiol 72, 2336–2342. [DOI] [PubMed] [Google Scholar]
- Bergstrom J (1962). Muscle electrolytes in man. Scand J Clin Lab Invest Suppl 68, 7–110. [Google Scholar]
- Blaauw B, Schiaffino S & Reggiani C (2013). Mechanisms modulating skeletal muscle phenotype. Compr Physiol 3, 1645–1687. [DOI] [PubMed] [Google Scholar]
- Blondin DP, Labbe SM, Noll C, Kunach M, Phoenix S, Guerin B, Turcotte EE, Haman F, Richard D & Carpentier AC (2015. a). Selective impairment of glucose but not fatty acid or oxidative metabolism in brown adipose tissue of subjects with type 2 diabetes. Diabetes 64, 2388–2397. [DOI] [PubMed] [Google Scholar]
- Blondin DP, Labbe SM, Phoenix S, Guerin B, Turcotte EE, Richard D, Carpentier AC & Haman F (2015. b). Contributions of white and brown adipose tissues and skeletal muscles to acute cold‐induced metabolic responses in healthy men. J Physiol 593, 701–714. [DOI] [PMC free article] [PubMed] [Google Scholar]
- Blondin DP, Labbé SM, Tingelstad HC, Noll C, Kunach M, Phoenix S, Guérin B, Turcotte ÉE, Carpentier AC, Richard D & Haman F (2014). Increased brown adipose tissue oxidative capacity in cold‐acclimated humans. J Clin Endocrinol Metab 99, E438–E446. [DOI] [PMC free article] [PubMed] [Google Scholar]
- Blondin DP, Maneshi A, Imbeault MA & Haman F (2011). Effects of the menstrual cycle on muscle recruitment and oxidative fuel selection during cold exposure. J Appl Physiol 111, 1014–1020. [DOI] [PubMed] [Google Scholar]
- Bordenave S, Brandou F, Manetta J, Fedou C, Mercier J & Brun JF (2008). Effects of acute exercise on insulin sensitivity, glucose effectiveness and disposition index in type 2 diabetic patients. Diabetes Metab 34, 250–257. [DOI] [PubMed] [Google Scholar]
- Brown D, Cole TJ, Dauncey MJ, Marrs RW & Murgatroyd PR (1984). Analysis of gaseous exchange in open‐circuit indirect calorimetry. Med Biol Eng Comput 22, 333–338. [DOI] [PubMed] [Google Scholar]
- Chaffee RR, Allen JR, Arine RM, Fineg AJ, Rochelle RH & Rosander J (1975). Studies on thermogenesis in brown adipose tissue in temperature‐acclimated Macaca mulatta. Comp Biochem Physiol A Comp Physiol 50, 303–306. [DOI] [PubMed] [Google Scholar]
- Davis TRA (1961). Chamber cold acclimatization in man. J Appl Physiol 16, 1011–1015. [DOI] [PubMed] [Google Scholar]
- Din Mu, Raiko J, Saari T, Kudomi N, Tolvanen T, Oikonen V, Teuho J, Sipila HT, Savisto N, Parkkola R, Nuutila P & Virtanen KA (2016). Human brown adipose tissue [O]O PET imaging in the presence and absence of cold stimulus. Eur J Nucl Med Mol Imaging 43, 1878–1886. [DOI] [PMC free article] [PubMed] [Google Scholar]
- Duchamp C, Cohen‐Adad F, Rouanet JL & Barre H (1992). Histochemical arguments for muscular non‐shivering thermogenesis in muscovy ducklings. J Physiol 457, 27–45. [DOI] [PMC free article] [PubMed] [Google Scholar]
- Elia M (1991). Energy equivalents of CO2 and their importance in assessing energy expenditure when using tracer techniques. Am J Physiol Endocrinol Metab 260, E75–E88. [DOI] [PubMed] [Google Scholar]
- Fernstrom M, Tonkonogi M & Sahlin K (2004). Effects of acute and chronic endurance exercise on mitochondrial uncoupling in human skeletal muscle. J Physiol 554, 755–763. [DOI] [PMC free article] [PubMed] [Google Scholar]
- Fuglevand AJ, Winter DA, Patla AE & Stashuk D (1992). Detection of motor unit action potentials with surface electrodes: influence of electrode size and spacing. Biological cybernetics 67, 143–153. [DOI] [PubMed] [Google Scholar]
- Gerrits MF, Ghosh S, Kavaslar N, Hill B, Tour A, Seifert EL, Beauchamp B, Gorman S, Stuart J, Dent R, McPherson R & Harper ME (2010). Distinct skeletal muscle fiber characteristics and gene expression in diet‐sensitive versus diet‐resistant obesity. J Lipid Res 51, 2394–2404. [DOI] [PMC free article] [PubMed] [Google Scholar]
- Haman F, Legault SR, Rakobowchuk M, Ducharme MB & Weber J‐M (2004. a). Effects of carbohydrate availability on sustained shivering II: relating muscle recruitment to fuel selection. J Appl Physiol 96, 41–49. [DOI] [PubMed] [Google Scholar]
- Haman F, Legault SR & Weber J‐M (2004. b). Fuel selection during intense shivering in humans: EMG pattern reflects carbohydrate oxidation. J Physiol 556, 305–313. [DOI] [PMC free article] [PubMed] [Google Scholar]
- Haman F, Péronnet F, Kenny GP, Doucet E, Massicotte D, Lavoie C & Weber J‐M (2004. c). Effects of carbohydrate availability on sustained shivering I: oxidation of plasma glucose, muscle glycogen and proteins. J Appl Physiol 96, 32–40. [DOI] [PubMed] [Google Scholar]
- Haman F, Péronnet F, Kenny GP, Massicotte D, Lavoie C, Scott C & Weber J‐M (2002). Effect of cold exposure on fuel utilization in humans: plasma glucose, muscle glycogen, and lipids. J Appl Physiol 93, 77–84. [DOI] [PubMed] [Google Scholar]
- Hanssen MJ, Hoeks J, Brans B, van der Lans AA, Schaart G, van den Driessche JJ, Jorgensen JA, Boekschoten MV, Hesselink MK, Havekes B, Kersten S, Mottaghy FM, van Marken Lichtenbelt WD & Schrauwen P (2015. a). Short‐term cold acclimation improves insulin sensitivity in patients with type 2 diabetes mellitus. Nat Med 21, 863–865. [DOI] [PubMed] [Google Scholar]
- Hanssen MJ, van der Lans AA, Brans B, Hoeks J, Jardon KM, Schaart G, Mottaghy FM, Schrauwen P & van Marken Lichtenbelt WD (2015. b). Short‐term cold acclimation recruits brown adipose tissue in obese humans. Diabetes. [DOI] [PubMed] [Google Scholar]
- Hardy JD & Dubois EF (1938). The technic of measuring radiation and convection. J Nutr 15, 461–475. [Google Scholar]
- Heckman CJ & Enoka RM (2012). Motor unit. Compr Physiol 2, 2629–2682. [DOI] [PubMed] [Google Scholar]
- Himms‐Hagen J (2004). Exercise in a pill: feasibility of energy expenditure targets. Curr Drug Targes CNS Neurol Disord 3, 389–409. [DOI] [PubMed] [Google Scholar]
- Imbeault M‐A, Mantha OL & Haman F (2013). Shivering modulation in humans: Effects of rapid changes in environmental temperature. J Therm Biol 38, 582–587. [Google Scholar]
- Israel DJ & Pozos RS (1989). Synchronized slow‐amplitude modulations in the electromyograms of shivering muscles. J Appl Physiol 66, 2358–2363. [DOI] [PubMed] [Google Scholar]
- Kuznetsov AV, Veksler V, Gellerich FN, Saks V, Margreiter R & Kunz WS (2008). Analysis of mitochondrial function in situ in permeabilized muscle fibers, tissues and cells. Nat Protoc 3, 965–976. [DOI] [PubMed] [Google Scholar]
- Larsen S, Nielsen J, Hansen CN, Nielsen LB, Wibrand F, Stride N, Schroder HD, Boushel R, Helge JW, Dela F & Hey‐Mogensen M (2012). Biomarkers of mitochondrial content in skeletal muscle of healthy young human subjects. J Physiol 590, 3349–3360. [DOI] [PMC free article] [PubMed] [Google Scholar]
- Launay JC & Savourey G (2009). Cold adaptations. Ind Health 47, 221–227. [DOI] [PubMed] [Google Scholar]
- Lee P, Smith S, Linderman J, Courville AB, Brychta RJ, Dieckmann W, Werner CD, Chen KY & Celi FS (2014). Temperature‐acclimated brown adipose tissue modulates insulin sensitivity in humans. Diabetes 63, 3686–3698. [DOI] [PMC free article] [PubMed] [Google Scholar]
- Liesa M & Shirihai OS (2013). Mitochondrial dynamics in the regulation of nutrient utilization and energy expenditure. Cell Metab 17, 491–506. [DOI] [PMC free article] [PubMed] [Google Scholar]
- Louzada RA, Santos MC, Cavalcanti‐de‐Albuquerque JP, Rangel IF, Ferreira AC, Galina A, Werneck‐de‐Castro JP & Carvalho DP (2014). Type 2 iodothyronine deiodinase is upregulated in rat slow‐ and fast‐twitch skeletal muscle during cold exposure. Am J Physiol Endocrinol Metab 307, E1020–E1029. [DOI] [PubMed] [Google Scholar]
- Madsen K, Ertbjerg P, Djurhuus MS & Pedersen PK (1996). Calcium content and respiratory control index of skeletal muscle mitochondria during exercise and recovery. Am J Physiol Endocrinol Metab 271, E1044–E1050. [DOI] [PubMed] [Google Scholar]
- Mailloux RJ, Seifert EL, Bouillaud F, Aguer C, Collins S & Harper ME (2011). Glutathionylation acts as a control switch for uncoupling proteins UCP2 and UCP3. J Biol Chem 286, 21865–21875. [DOI] [PMC free article] [PubMed] [Google Scholar]
- Makinen TM (2010). Different types of cold adaptation in humans. Front Biosci (Schol Ed) 2, 1047–1067. [DOI] [PubMed] [Google Scholar]
- Meigal A (2002). Gross and fine neuromuscular performance at cold shivering. Int J Circumpolar Health 61, 163–172. [DOI] [PubMed] [Google Scholar]
- Melanson EL, Ingebrigtsen JP, Bergouignan A, Ohkawara K, Kohrt WM & Lighton JR (2010). A new approach for flow‐through respirometry measurements in humans. Am J Physiol Regul Integr Comp Physiol 298, R1571–R1579. [DOI] [PMC free article] [PubMed] [Google Scholar]
- Ouellet V, Labbe SM, Blondin DP, Phoenix S, Guerin B, Haman F, Turcotte EE, Richard D & Carpentier AC (2012). Brown adipose tissue oxidative metabolism contributes to energy expenditure during acute cold exposure in humans. J Clin Invest 122, 545–552. [DOI] [PMC free article] [PubMed] [Google Scholar]
- Péronnet F & Massicotte D (1991). Table of nonprotein respiratory quotient: an update. Can J Sport Sci 16, 23–29. [PubMed] [Google Scholar]
- Petajan JH & Williams DD (1972). Behavior of single motor units during pre‐shivering tone and shivering tremor. Am J Phys Med 51, 16–22. [PubMed] [Google Scholar]
- Schaeffer PJ, Villarin JJ & Lindstedt SL (2003). Chronic cold exposure increases skeletal muscle oxidative structure and function in Monodelphis domestica, a marsupial lacking brown adipose tissue. Physiol Biochem Zool 76, 877–887. [DOI] [PubMed] [Google Scholar]
- Schaeffer PJ, Villarin JJ, Pierotti DJ, Kelly DP & Lindstedt SL (2005). Cost of transport is increased after cold exposure in Monodelphis domestica: training for inefficiency. J Exp Biol 208, 3159–3167. [DOI] [PubMed] [Google Scholar]
- Teulier L, Rouanet JL, Letexier D, Romestaing C, Belouze M, Rey B, Duchamp C & Roussel D (2010). Cold‐acclimation‐induced non‐shivering thermogenesis in birds is associated with upregulation of avian UCP but not with innate uncoupling or altered ATP efficiency. J Exp Biol 213, 2476–2482. [DOI] [PubMed] [Google Scholar]
- van der Lans AA, Hoeks J, Brans B, Vijgen GH, Visser MG, Vosselman MJ, Hansen J, Jorgensen JA, Wu J, Mottaghy FM, Schrauwen P & van Marken Lichtenbelt WD (2013). Cold acclimation recruits human brown fat and increases nonshivering thermogenesis. J Clin Invest 123, 3395–3403. [DOI] [PMC free article] [PubMed] [Google Scholar]
- Wiesinger H, Klaus S, Heldmaier G, Champigny O & Ricquier D (1990). Increased nonshivering thermogenesis, brown fat cytochrome‐c oxidase activity, GDP binding, and uncoupling protein mRNA levels after short daily cold exposure of Phodopus sungorus . Can J Physiol Pharmacol 68, 195–200. [DOI] [PubMed] [Google Scholar]
- Wijers SL, Schrauwen P, Saris WH & van Marken Lichtenbelt WD (2008). Human skeletal muscle mitochondrial uncoupling is associated with cold induced adaptive thermogenesis. PLoS ONE 3, e1777. [DOI] [PMC free article] [PubMed] [Google Scholar]
- Yoneshiro T, Aita S, Matsushita M, Kayahara T, Kameya T, Kawai Y, Iwanaga T & Saito M (2013). Recruited brown adipose tissue as an antiobesity agent in humans. J Clin Invest 123, 3404–3408. [DOI] [PMC free article] [PubMed] [Google Scholar]
- Young AJ (2011). Homeostatic responses to prolonged cold exposure: human cold acclimatization. Compr Physiol Suppl 14, 419–438. [Google Scholar]