Abstract
Obesity is a principal causative factor in the development of metabolic syndrome. Here we report that increased oxidative stress in accumulated fat is an important pathogenic mechanism of obesity-associated metabolic syndrome. Fat accumulation correlated with systemic oxidative stress in humans and mice. Production of ROS increased selectively in adipose tissue of obese mice, accompanied by augmented expression of NADPH oxidase and decreased expression of antioxidative enzymes. In cultured adipocytes, elevated levels of fatty acids increased oxidative stress via NADPH oxidase activation, and oxidative stress caused dysregulated production of adipocytokines (fat-derived hormones), including adiponectin, plasminogen activator inhibitor–1, IL-6, and monocyte chemotactic protein–1. Finally, in obese mice, treatment with NADPH oxidase inhibitor reduced ROS production in adipose tissue, attenuated the dysregulation of adipocytokines, and improved diabetes, hyperlipidemia, and hepatic steatosis. Collectively, our results suggest that increased oxidative stress in accumulated fat is an early instigator of metabolic syndrome and that the redox state in adipose tissue is a potentially useful therapeutic target for obesity-associated metabolic syndrome.
Introduction
Multiple risk factor syndrome or metabolic syndrome (i.e., the coexistence of several risk factors for atherosclerosis, including hyperglycemia, dyslipidemia, and hypertension in the same individual) is a growing medical problem in industrialized countries (1–3). Obesity is the central and causal component in this syndrome (4–7), but the mechanistic role of obesity has not been fully elucidated.
Adipocytes produce a variety of biologically active molecules (4–9), collectively known as adipocytokines or adipokines, including plasminogen activator inhibitor–1 (PAI-1) (10), TNF-α (11, 12), resistin (13, 14), leptin (15–17), and adiponectin (18–21). Dysregulated production of these adipocytokines participates in the pathogenesis of obesity-associated metabolic syndrome. Increased production of PAI-1 and TNF-α from accumulated fat contribute to the development of thrombosis (10) and insulin resistance (11, 12), respectively, in obesity. In contrast, adiponectin exerts insulin-sensitizing (22–25) and anti-atherogenic effects (26–28), and hence a decrease in plasma adiponectin is causative for insulin resistance and atherosclerosis in obesity. However, the mechanisms by which fat accumulation leads to such dysregulation of adipocytokines have not been elucidated.
Oxidative stress plays critical roles in the pathogenesis of various diseases (29). In the diabetic condition, oxidative stress impairs glucose uptake in muscle and fat (30, 31) and decreases insulin secretion from pancreatic β cells (32). Increased oxidative stress also underlies the pathophysiology of hypertension (33) and atherosclerosis (34) by directly affecting vascular wall cells.
In the present study, we suggest that obesity per se may induce systemic oxidative stress and that increased oxidative stress in accumulated fat is, at least in part, the underlying cause of dysregulation of adipocytokines and development of metabolic syndrome. As an early instigator of obesity-associated metabolic syndrome, increased oxidative stress in accumulated fat should be an important target for the development of new therapies.
Results
Oxidative stress and plasma adiponectin levels in human obese subjects.
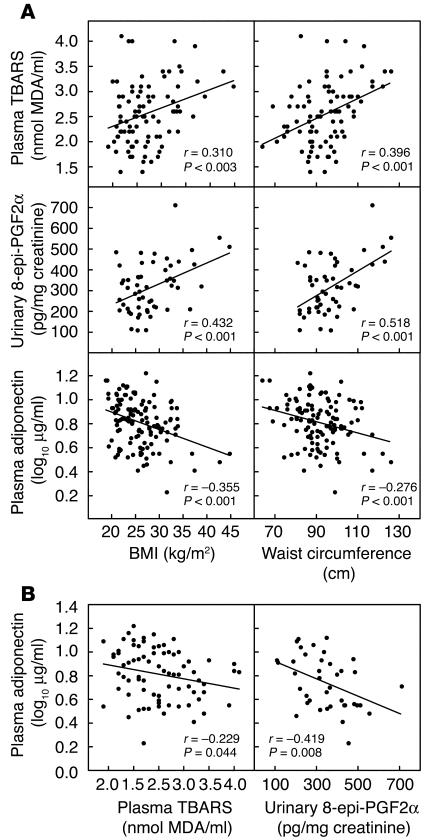
To investigate whether oxidative stress is increased in obese subjects, we measured lipid peroxidation, a marker of oxidative injury, in nondiabetic human subjects. Lipid peroxidation, represented by plasma thiobarbituric acid reactive substance (TBARS) and urinary 8-epi-prostaglandin-F2α (8-epi-PGF2α), significantly correlated with BMI and waist circumference (Figure 1A). Plasma adiponectin levels correlated inversely with BMI and waist circumference (Figure 1A), as we reported previously (21). We also found significant inverse correlations between plasma adiponectin and plasma TBARS and between plasma adiponectin and urinary 8-epi-PGF2α (Figure 1B). These results of human studies allowed us to hypothesize that fat accumulation itself could increase systemic oxidative stress independent of hyperglycemia, and that increased oxidative stress in obesity might relate to the dysregulated production of adipocytokines.
Figure 1.
Levels of lipid peroxidation and plasma adiponectin in nondiabetic subjects. (A) Correlation of plasma TBARS, urinary 8-epi-PGF2α, and plasma adiponectin with BMI and waist circumference. (B) Correlation of plasma adiponectin with plasma TBARS and urinary 8-epi-PGF2α. Pearson’s correlation coefficient (r) is shown for each relationship. MDA, malondialdehyde.
Increased oxidative stress in plasma and white adipose tissue of KKAy mice.
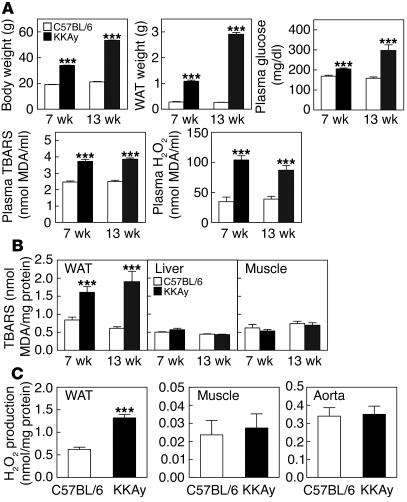
To determine whether fat accumulation is primarily involved in increased oxidative stress, we analyzed 7-week-old KKAy mice as a model of nondiabetic obesity, and 13-week-old KKAy mice as a model of diabetic obesity. KKAy mice exhibit severe obesity, hyperlipidemia, and insulin resistance. Compared with age-matched control C57BL/6 mice, KKAy mice at 7 and 13 weeks of age were significantly heavier (Figure 2A) and had a heavier parametrial fat pad (Figure 2A). The increase in plasma glucose was marginal in 7-week-old KKAy mice, but 13-week-old KKAy mice showed significant hyperglycemia relative to C57BL/6 mice (Figure 2A). Surprisingly, plasma lipid peroxidation in nondiabetic 7-week-old KKAy mice was significantly higher than in control mice, and was similar to that in diabetic 13-week-old KKAy mice (Figure 2A). Moreover, plasma levels of H2O2, a hazardous ROS against tissues and cells, were also elevated in nondiabetic and diabetic KKAy mice compared with C57BL/6 mice (Figure 2A). These results demonstrated that oxidative stress in blood was augmented in obesity, that is, fat accumulation, independent of hyperglycemia.
Figure 2.
Increased oxidative stress in plasma and WAT of obese KKAy mice. (A) Body weight, parametrial WAT weight, plasma levels of glucose, lipid peroxidation (TBARS), and H2O2 in C57BL/6 and KKAy mice at 7 and 13 weeks of age. Values are expressed as mean ± SEM (n = 6–8). (B) Tissue levels of lipid peroxidation in WAT, liver, and skeletal muscle of C57BL/6 and KKAy mice. Values are expressed as mean ± SEM (n = 6–8). (C) The release of H2O2 from WAT, skeletal muscle, and aorta of C57BL/6 and KKAy mice at 7 weeks of age. Values are expressed as mean ± SEM (n = 5). ***P < 0.001 compared with C57BL/6 mice.
Next, we determined the tissue type that could be responsible for the increased oxidative stress in plasma of obese mice. Lipid peroxidation was markedly elevated in white adipose tissue (WAT) of 7- and 13-week-old KKAy mice compared with C57BL/6 mice (Figure 2B). In contrast, the levels of lipid peroxidation in the liver and skeletal muscle were similar between KKAy and C57BL/6 mice at both 7 and 13 weeks of age (Figure 2B). Furthermore, H2O2 production from WAT was significantly higher in 7-week-old KKAy mice than in the control mice (Figure 2C). In contrast, H2O2 production from skeletal muscle and aorta was not altered in KKAy mice (Figure 2C).
Similarly, plasma levels of lipid peroxidation were elevated in other mouse models of obesity, including the diet-induced obesity (DIO) model and another genetic model of obesity (db/db mice) (Supplemental Figure 1, A–D; supplemental material available at http://www.jci.org/cgi/content/full/114/12/1752/DC1). Similar increases in lipid peroxidation were observed in WAT, but not in the liver or skeletal muscle, of these obese mice (Supplemental Figure 1E). These results suggest that, in obesity, increased oxidative stress in plasma is due to increased ROS production from accumulated fat.
Dysregulated mRNA expressions of adipocytokines and PPARγin WAT of KKAy mice.
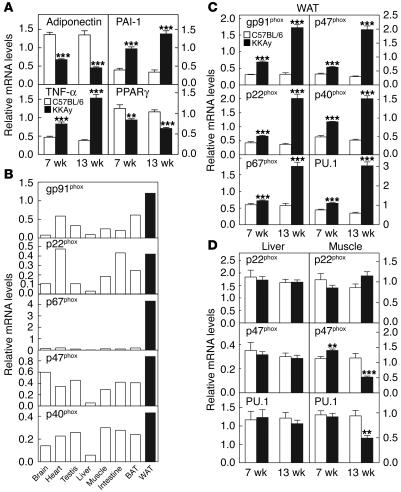
The mRNA expressions of adiponectin and PPARγ were lower in WAT of 7- and 13-week-old KKAy mice compared with C57BL/6 mice (Figure 3A). In contrast, the mRNA expressions of PAI-1 and TNF-α were high relative to the corresponding levels in the control mice (Figure 3A). We also found that plasma adiponectin levels were lower in KKAy mice than in C57BL/6 mice at both 7 and 13 weeks of age (19.7 ± 0.8 μg/ml vs. 26.2 ± 1.0 μg/ml, P < 0.001 at 7 weeks of age, 16.0 ± 0.9 μg/ml vs. 25.5 ± 1.8 μg/ml, P < 0.001 at 13 weeks of age). Thus, dysregulated expressions of adipocytokines already existed in the nondiabetic obese stage.
Figure 3.
Dysregulated expressions of adipose genes and increased expressions of NADPH oxidase subunits in WAT of obese KKAy mice. (A) The mRNA expressions of adiponectin, TNF-α, PAI-1, and PPARγ in WAT of C57BL/6 (white bars) and KKAy (black bars) mice. The mRNA amounts were quantified by real-time PCR. Values are normalized to the level of cyclophilin mRNA, and expressed as mean ± SEM (n = 6–8). (B) The mRNA expressions of NADPH oxidase subunits in various mouse tissues. The mRNA amounts were quantified by real-time PCR, using total RNA extracted from 8 tissues of C57BL/6 mice at 12 weeks of age. Values are normalized to the level of 18S ribosomal RNA. (C and D) The mRNA expressions of NADPH oxidase subunits and PU.1 in WAT (C), liver (D, left) and skeletal muscle (D, right) of C57BL/6 (white bars) and KKAy (black bars) mice at 7 and 13 weeks of age. Values are normalized to the level of cyclophilin mRNA, and expressed as mean ± SEM (n = 6–8). **P < 0.01 and ***P < 0.001 compared with C57BL/6 mice. BAT, brown adipose tissue.
Increased mRNA expression of NADPH oxidase in WAT of KKAy mice.
NADPH oxidase complex is a major source of ROS in various cells (35, 36). Increased NADPH oxidase activity in vascular cells has been reported to be important in the pathogenesis of hypertension and atherosclerosis by increasing oxidative stress (36). In order to investigate the possible role of augmented NADPH oxidase in increased ROS production, we determined the mRNA expression of NADPH oxidase in WAT of KKAy mice.
The NADPH oxidase complex consists of membrane-associated flavocytochrome b588 protein, which is composed of gp91phox and p22phox, and cytosolic components p47phox, p67phox, and p40phox. In C57BL/6 mice, the mRNA expression of each oxidase subunit was detected in WAT, and the expression levels of most subunits were quite high in WAT compared with other tissues tested (Figure 3B). The mRNA expression levels of these NADPH oxidase subunits were significantly augmented in WAT of nondiabetic 7-week-old KKAy mice, and they were even higher in WAT of diabetic 13-week-old KKAy mice compared with the control mice (Figure 3C). In contrast, the mRNA expression levels of these subunits in the liver and skeletal muscle of 7- and 13-week-old KKAy mice were similar to those of control mice (Figure 3D). We also found that the mRNA expression level of transcription factor PU.1, which is known to upregulate the transcription of NADPH oxidase subunits in myeloid cells (37), was also elevated in WAT (Figure 3C), but not in the liver or in skeletal muscle (Figure 3D) of KKAy mice compared with C57BL/6 mice. Similar mRNA changes of NADPH oxidase subunits were observed in WAT, but not in liver or skeletal muscle, of both DIO and db/db mice (Supplemental Figure 1, F and G). These results indicate that the NADPH oxidase pathway is specifically induced in WAT of obese mice.
Decreased mRNA expressions and activities of antioxidant enzymes in WAT of KKAy mice.
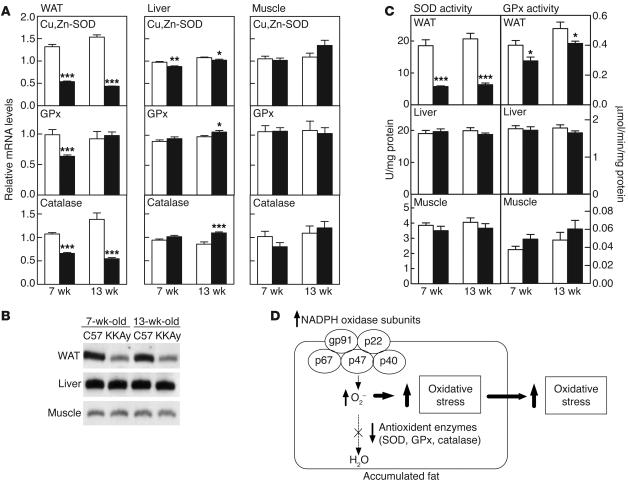
In the next step, we measured the expressions of antioxidant enzymes including superoxide dismutase (SOD), glutathione peroxidase (GPx), and catalase. At 7 weeks of age, the mRNA expression levels of cytoplasmic Cu,Zn-SOD, GPx, and catalase were significantly lower in WAT of KKAy mice, compared with C57BL/6 mice (Figure 4A). The expressions of Cu,Zn-SOD and catalase were also lower in WAT of 13-week-old KKAy mice, compared with C57BL/6 mice (Figure 4A). In contrast, the mRNA expression levels of these antioxidant enzymes in the liver and skeletal muscle of KKAy mice were similar to those of C57BL/6 mice (Figure 4A). The amount of Cu,Zn-SOD protein was also lower in WAT, but not in the liver and skeletal muscle, of KKAy mice compared with C57BL/6 mice (Figure 4B). Furthermore, total SOD activities (Figure 4C, left) and GPx activities (Figure 4C, right) were also significantly and specifically lower in WAT of KKAy mice than in the control mice. Similar mRNA decreases of Cu,Zn-SOD and GPx were observed in WAT, but not in liver or skeletal muscle, of DIO and db/db mice (Supplemental Figure 1, F and G). Taken together, these results indicate that increased ROS production in accumulated fat is due to the activated NADPH oxidase pathway and impaired antioxidant defense system (Figure 4D).
Figure 4.
Decreased mRNA expressions and activities of antioxidant enzymes in WAT of obese KKAy mice. (A) The mRNA expressions of Cu,Zn-SOD, Gpx, and catalase in WAT, liver, and skeletal muscle of C57BL/6 (white bars) and KKAy (black and gray bars) mice at 7 and 13 weeks of age. Values are normalized to the level of cyclophilin mRNA, and expressed as mean ± SEM (n = 6–8). (B) Immunoblot analysis of the amount of Cu,Zn-SOD protein in WAT, liver, and skeletal muscle of C57BL/6 and KKAy mice at 7 and 13 weeks of age. (C) Total SOD activities (left) and GPx activities (right) in WAT, liver, and skeletal muscle of C57BL/6 (white bars) and KKAy (black and gray bars) mice at 7 and 13 weeks of age. Values are expressed as mean ± SEM (n = 6–8). (D) Model illustrating increased production of oxidative stress in accumulated fat. *P < 0.05, **P < 0.01, and ***P < 0.001 compared with C57BL/6 mice.
ROS production in adipocytes.
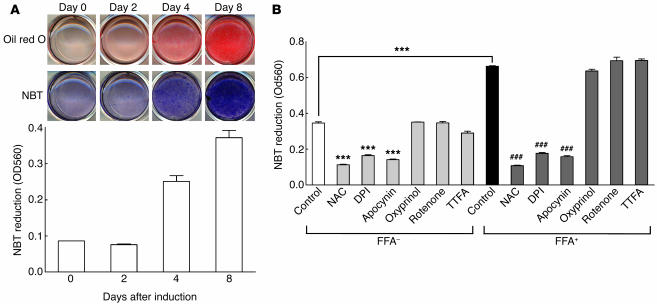
We next examined the significance of ROS in cultured adipocytes. ROS production was markedly increased during differentiation of 3T3-L1 cells into adipocytes (Figure 5A), suggesting that ROS production increases in parallel with fat accumulation in adipocytes. We then determined the cellular pathway involved in increased ROS production in mature adipocytes, including NADPH oxidase, xanthine oxidase (34), and mitochondria-mediated (38) pathways. ROS production in fully differentiated 3T3-L1 adipocytes was markedly suppressed by 2 structurally unrelated inhibitors of NADPH oxidase, diphenyleneiodonium (DPI) and apocynin, as well as the general antioxidant N-acetyl-cysteine (NAC) (Figure 5B). In contrast, ROS production in 3T3-L1 adipocytes was not suppressed by oxypurinol, an inhibitor of xanthine oxidase, rotenone, an inhibitor of mitochondrial electron transport chain complex I, or thenoyltrifluoroacetone, an inhibitor of complex II (Figure 5B). These results suggest that NADPH oxidase is the major source of ROS in adipocytes, and that augmented NADPH oxidase seems to contribute to increased ROS production in adipose tissue in obesity.
Figure 5.
Production of ROS in 3T3-L1 adipocytes. (A) ROS production during differentiation of 3T3-L1 cells into adipocytes. ROS production was measured by NBT reduction. Oil red O staining (top) and NBT treatment (middle) of the cells. Dark-blue formazan was dissolved and the absorbance was determined at 560 nm (bottom). (B) Effect of linoleate and inhibitors of ROS production in fully differentiated 3T3-L1 adipocytes. 3T3-L1 adipocytes were incubated with (FFA+) or without (FFA–) 200 μM linoleate for 24 hours. In the final hour of incubation, 10 mM NAC, 10 μM DPI, 200 μM apocynin, 100 μM oxypurinol, 100 μM rotenone, or 100 μM thenoyltrifluoroacetone (TTFA) was added, and ROS production was measured by NBT reduction. Values are expressed as mean ± SEM (n = 3). ***P < 0.001 compared with cells without linoleate or inhibitors. ###P < 0.001 compared with cells treated with 200 μM linoleate.
It has been reported that in cultured vascular cells, free fatty acids increase NADPH oxidase activity (39). In the next experiment, we investigated whether free fatty acids could induce ROS production in 3T3-L1 adipocytes. ROS production was significantly increased by incubation with linoleic acid (Figure 5B), as well as with other types of fatty acids such as oleic acid and arachidonic acid (data not shown). The effect of linoleic acid was abolished by NADPH oxidase inhibitors, but not by other types of inhibitors (Figure 5B). These results suggest that increased levels of fatty acid in accumulated fat seem to stimulate ROS production in adipose cells through the activation of NADPH oxidase.
Effect of ROS on the expression levels of various genes in adipocytes.
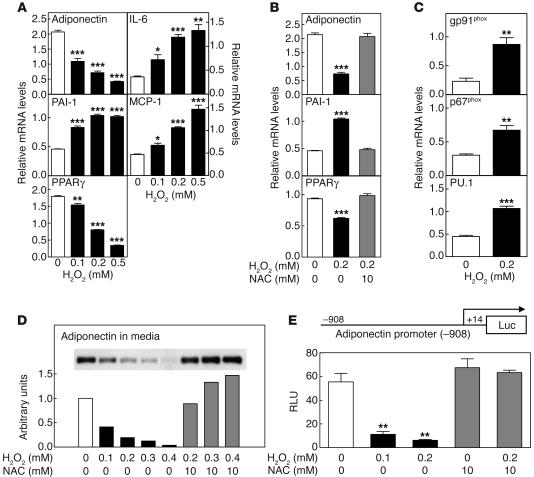
Next, we examined the effect of ROS in 3T3-L1 adipocytes. Fully differentiated 3T3-L1 adipocytes were exposed to ROS either by treating the cells with H2O2 directly, or by an enzymatic method using xanthine oxidase to generate superoxide. The mRNA expression levels of adiponectin and PPARγ were diminished by incubation with H2O2 (Figure 6A) in a dose-dependent manner. In contrast, ROS increased the mRNA expression levels of PAI-1, IL-6, and monocyte chemotactic protein–1 (MCP-1) in 3T3-L1 adipocytes (Figure 6A). These changes were also observed by incubation with xanthine oxidase and hypoxanthine (data not shown). Antioxidant NAC reversed the effects of H2O2 on the expression levels of these genes to normal levels (Figure 6B). We also found that H2O2 increased the mRNA expression levels of NADPH oxidase subunits and PU.1 (Figure 6C), suggesting that ROS itself might augment the NADPH oxidase pathway. Adiponectin secretion by 3T3-L1 adipocytes was also decreased following incubation with H2O2, and NAC abrogated the effect of H2O2 (Figure 6D). Using a reporter construct containing adiponectin promoter (40), ROS reduced the transcriptional activity of the adiponectin gene in 3T3-L1 adipocytes, and NAC reversed these effects (Figure 6E). These results indicate that ROS downregulated adiponectin expression at the transcriptional level, suggesting that treatment with antioxidants or inhibitors of ROS production might restore the dysregulation of adipocytokines.
Figure 6.
Effects of ROS on gene expressions in 3T3-L1 adipocytes. (A and B) The mRNA expression levels of adiponectin, PAI-1, PPARγ, IL-6, and MCP-1 in 3T3-L1 adipocytes exposed to ROS, with or without antioxidant NAC. Fully differentiated 3T3-L1 adipocytes were exposed to ROS by incubation with H2O2. Values are normalized to the level of cyclophilin mRNA and expressed as mean ± SEM (n = 3). (C) The mRNA expression levels of NADPH oxidase subunits and PU.1 in 3T3-L1 adipocytes exposed to ROS. Values are normalized to the level of cyclophilin mRNA. (D) Effects of H2O2 and NAC on adiponectin secretion from 3T3-L1 adipocytes. Adiponectin levels in the media were determined by Western blotting (inset) and the values were quantified using a densitometer. (E) Effects of ROS and NAC on the transcriptional activity of adiponectin promoter in 3T3-L1 adipocytes. RLU, relative luciferase units. Values are expressed as mean ± SEM (n = 3). *P < 0.05, **P < 0.01, and ***P < 0.001 compared with control.
Effect of NADPH oxidase inhibitor on adipocytokine expression and glucose and lipid metabolism in KKAy mice.
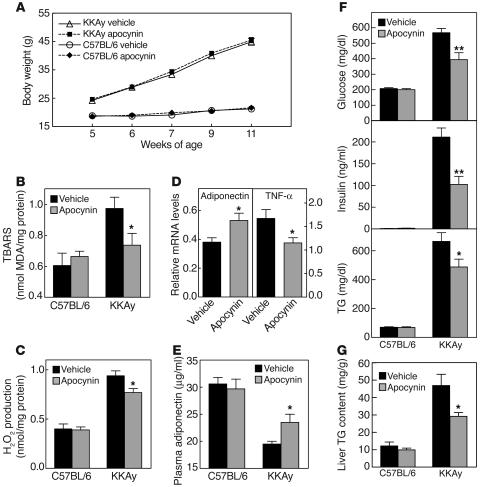
To test the therapeutic effects of the above experimental observations, we treated KKAy mice with the NADPH oxidase inhibitor apocynin (41), and then we examined the effects on adipocytokine expression and obesity-associated metabolic disorders. Apocynin is a well-characterized inhibitor of NADPH oxidase activity and is known to impede the assembly of the p47phox subunit with the membrane complex (42). Apocynin is also effective at inhibiting ROS production in various cells in vivo (43, 44). Six-week treatment with apocynin did not affect body weight (Figure 7A) or food intake (data not shown) in control or KKAy mice. Lipid peroxidation and H2O2 production in WAT were significantly lower in apocynin-treated KKAy mice than controls (Figure 7, B and C), indicating that NADPH oxidase inhibition reduced oxidative stress in WAT. Similar to the results shown in Figure 2, lipid peroxidation was not altered in the liver and skeletal muscle of KKAy mice, compared to control mice, and it was not affected by apocynin treatment (Supplemental Figure 2). Apocynin treatment increased the mRNA expression of adiponectin in WAT of KKAy mice (Figure 7D), and such an increase was associated with a rise in plasma adiponectin concentration (Figure 7E). Apocynin also decreased the mRNA expression of TNF-α in WAT of KKAy mice (Figure 7D). Apocynin treatment significantly reduced plasma glucose and insulin in KKAy mice but not in C57BL/6 mice (Figure 7F). Plasma triglyceride (TG) levels were also lower in apocynin-treated KKAy mice (Figure 7F). Furthermore, apocynin treatment significantly reduced hepatic TG content in KKAy mice (Figure 7G), suggesting that apocynin could ameliorate hepatic steatosis in KKAy mice. These results showed that inhibition of NADPH oxidase in KKAy mice significantly decreased ROS production by WAT, attenuated the dysregulated production of adipocytokines, and improved the obesity-associated disorders in glucose and lipid metabolism.
Figure 7.
In vivo effects of an NADPH oxidase inhibitor, apocynin, on adipocytokine expression, and glucose and lipid metabolism in KKAy mice. (A) Body weight of C57BL/6 and KKAy mice, treated with or without apocynin for 6 weeks. (B) Lipid peroxidation in WAT, and (C) release of H2O2 from WAT of C57BL/6 and KKAy mice, treated with or without apocynin for 6 weeks. (D) The mRNA expression levels of adiponectin and TNF-α in WAT of KKAy mice. Values are normalized to the level of cyclophilin mRNA. (E) Plasma adiponectin concentrations in C57BL/6 and KKAy mice. (F) Plasma glucose, insulin, and TG concentrations in C57BL/6 and KKAy mice. (G) Liver TG content in C57BL/6 and KKAy mice. Values are expressed as mean ± SEM (n = 8). *P < 0.05 and **P < 0.01 compared with vehicle-treated group.
Discussion
Obesity is closely associated with metabolic syndrome (1–3). Recent studies have shown that the dysregulated production of “offensive” adipocytokines, such as PAI-1 (10), TNF-α (11, 12), IL-6 (45), MCP-1 (46), and angiotensinogen (47), and of “defensive” adipocytokines, such as adiponectin (18–20) and leptin (15–17), is critically involved in the pathogenesis of metabolic syndrome. However, the mechanisms by which fat accumulation leads to abnormal expression of adipocytokines and development of metabolic syndrome have not been fully elucidated.
In the present study, we have demonstrated that, in nondiabetic human subjects, fat accumulation closely correlated with the markers of systemic oxidative stress. These data are in good agreement with recent studies suggesting that systemic oxidative stress correlates with BMI (48, 49). In addition, we demonstrated that plasma adiponectin levels correlated inversely with systemic oxidative stress. We then reproduced the results of our human studies in several mouse models of obesity, including KKAy, db/db, and DIO mice. The main finding of the present study is that oxidative stress in accumulated fat mediates the obesity-associated development of metabolic syndrome by the following potential mechanisms: (a) increased oxidative stress in accumulated fat leads to dysregulated production of adipocytokines, and (b) the selective increase in ROS production in accumulated fat leads to elevation of systemic oxidative stress.
Plasma adiponectin levels correlated inversely with the markers of systemic oxidative stress in nondiabetic human subjects. In cultured adipocytes, addition of oxidative stress suppressed mRNA expression and secretion of adiponectin, and it also increased PAI-1, IL-6, and MCP-1 mRNA expression. Furthermore, treatment with the NADPH oxidase inhibitor apocynin reduced oxidative stress in WAT and increased plasma adiponectin levels in KKAy mice. These results indicate that a local increase in oxidative stress in accumulated fat causes dysregulated production of adipocytokines. Recently, we reported that PPARγ positively regulates the transcription of the adiponectin gene via PPARγ-responsive element in the promoter (40). We showed that oxidative stress suppressed PPARγ mRNA expression in 3T3-L1 adipocytes. It was also shown that nuclear translocation of PPARγ was inhibited by nitration associated with oxidative stress (50). Therefore, downregulation of adiponectin expression may be partially attributed to the decreased gene expression and smaller amount of nuclear PPARγ under conditions of oxidative stress.
In the present study, H2O2 production was increased only in adipose tissue of obese mice, but not in other tissues examined, including the liver, skeletal muscle, and aorta. These results suggest that adipose tissue is the major source of the elevated plasma ROS. Oxidative stress is known to impair both insulin secretion by pancreatic β cells (32) and glucose transport in muscle (30) and adipose tissue (31). Increased oxidative stress in vascular walls is involved in the pathogenesis of hypertension (33) and atherosclerosis (34). Oxidative stress also underlies the pathophysiology of hepatic steatosis (51). Thus, oxidative stress locally produced in each of the above tissues seems to be involved in the pathogenesis of these diseases. Our results suggest that increased ROS secretion into peripheral blood from accumulated fat in obesity is also involved in induction of insulin resistance in skeletal muscle and adipose tissue, impaired insulin secretion by β cells, and pathogenesis of various vascular diseases such as atherosclerosis and hypertension.
Why is oxidative stress increased only in accumulated fat? We found that in WAT but not other tissues of obese mice, the mRNA expression levels of NADPH oxidase subunits increased, and mRNA expression levels and activities of antioxidant enzymes decreased. We also found a high level of mRNA expression of the transcription factor PU.1, which upregulates the transcription of the NADPH oxidase gene (37) in adipose tissue of obese mice. Recently, Weisberg et al. (52) and Xu et al. (53) reported that macrophages infiltrated the obese adipose tissues and were an important source of inflammatory cytokines. Since macrophages are also known to produce ROS, it is possible that infiltrated macrophages are involved in augmented NADPH oxidase and elevated ROS production in the obese adipose tissue. In this regard, a family of gp91phox homologs, termed NOX (NADPH oxidase) proteins, has been reported to be expressed in nonphagocytic cells, not in macrophages (54, 55). Recent studies of adipocytes found that NOX4, a member of the NOX family, plays a role in the generation of H2O2 (56). The expression of NOX4 was not detected in macrophages (57, 58). In contrast, we found high expression levels of NOX4 in WAT, as well as gp91phox, and mRNA expression of NOX4 was significantly increased in WAT of obese mice (Supplemental Figure 3, A and B). These results suggest that adipose NADPH oxidase is elevated and contributes to ROS production in accumulated fat.
We demonstrated that ROS production was increased in 3T3-L1 adipocytes, in parallel with fat accumulation and by incubation with linoleic acid, in a NADPH oxidase–dependent manner. These results suggest that in accumulated fat, elevated levels of fatty acids activate NADPH oxidase and induce ROS production. We also demonstrated that ROS itself augmented mRNA expressions of NADPH oxidase subunits, including NOX4 (Supplemental Figure 3C) and PU.1 in adipocytes. Therefore, in accumulated fat of obesity, elevated ROS appear to upregulate mRNA expression of NADPH oxidase, establishing a vicious cycle that augments oxidative stress in WAT and blood. We found that ROS increased the expression of MCP-1, a chemoattractant for monocytes and macrophages, in adipocytes. Byproducts of lipid peroxidation by ROS, such as trans-4-hydroxy-2-nonenal and malondialdehyde, are themselves potent chemoattractants (59). Hence, it is possible that increased ROS production and MCP-1 secretion from accumulated fat should cause infiltration of macrophages and inflammation in adipose tissue of obesity.
Importantly, our in vivo study revealed that treatment with the NADPH oxidase inhibitor apocynin reduced ROS production in adipose tissue of KKAy mice. It also improved hyperinsulinemia, hyperglycemia, hypertriglyceridemia, and hepatic steatosis. Increased expression of adiponectin and decreased expression of TNF-α were observed in WAT of apocynin-treated KKAy mice, demonstrating that reduction of oxidative stress in accumulated fat could improve the dysregulation of adipocytokines in vivo. Our results demonstrate that treatment with NADPH oxidase inhibitor is effective in ameliorating the development of obesity-associated metabolic syndrome.
It has been reported that prolonged exposure of 3T3-L1 adipocytes to ROS results in impairments of insulin-induced activation of PI3-kinase and Akt, insulin-stimulated lipogenesis, glucose uptake, and GLUT4 translocation to the plasma membrane (31, 60). Thus, NADPH oxidase inhibitors might improve insulin sensitivity via suppression of these effects induced by chronic exposure to ROS. Our current results are consistent with several previous studies demonstrating that antioxidant treatment improves insulin function in diabetic subjects (61, 62).
Recent studies, on the other hand, have proposed that ROS such as H2O2 are produced transiently in response to insulin stimulation and also act as a second messenger for insulin signaling in adipocytes (63, 64). NADPH oxidase is thought to be involved in insulin-induced ROS generation (63, 64). We assume that a transient increase of intracellular ROS is important for the insulin signaling pathway, while excessive and long-term exposure to ROS reduces insulin sensitivity and impairs glucose and lipid metabolism.
In the present study, we observed stimulation of ROS production by fatty acids via NADPH oxidase activation. In addition, we also found that ROS suppressed the mRNA expressions of lipogenic genes, such as fatty acid synthase and sterol regulatory element binding protein-1c, in 3T3-L1 adipocytes (data not shown). These results suggest that increased ROS production caused by fat accumulation may prevent further lipid storage, but may simultaneously cause dysregulated expression of adipocytokines and insulin resistance. Conceivably, inhibition of NADPH oxidase should improve the dysregulation of adipocytokines and insulin sensitivity via restoration of normal ROS production in obese adipocytes.
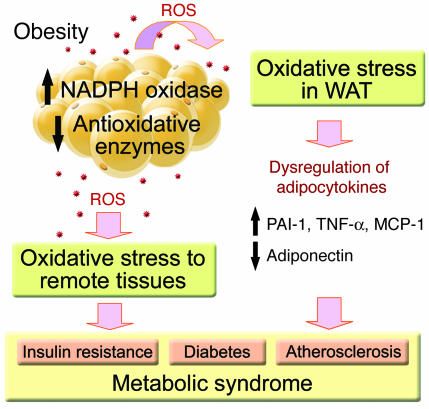
Figure 8 illustrates our working hypothesis regarding the role of ROS in metabolic syndrome. Increased oxidative stress in accumulated fat, via increased NADPH oxidase and decreased antioxidant enzymes, causes dysregulated production of adipocytokines, locally. Increased ROS production from accumulated fat also leads to increased oxidative stress in blood, hazardously affecting other organs including the liver, skeletal muscle, and aorta. We propose that increased oxidative stress in accumulated fat is an early instigator and one of the important underlying causes of obesity-associated metabolic syndrome, hence, the redox state in adipose tissue is a potentially useful target in new therapies against obesity-associated metabolic syndrome, as we demonstrated in the mouse in vivo study.
Figure 8.
A working model illustrating how increased ROS production in accumulated fat contributes to metabolic syndrome.
Methods
Subjects.
Plasma and urinary samples were obtained after overnight fasting from 140 subjects (69 men and 71 women; mean age 56 ± 13 SD) who visited the University hospital for a healthy checkup. Patients with a history of diabetes, cardiovascular or cerebrovascular disease, hepatic or renal disease, tobacco abuse, or those on hormone replacement therapy were excluded. The study protocols complied with the Guidelines of the Ethical Committees of Osaka University and University of the Ryukyus. Informed consent was obtained from all subjects. Samples were stored at –80°C until use.
Animals.
All animals were purchased from Clea Japan and housed in a room under controlled temperature (23 ± 1°C) and humidity (45–65%) and had free access to water and chow (Oriental Yeast Co.). All animal experiments were conducted in accordance with the aforementioned institutional guidelines for the care and use of laboratory animals. Female C57BL/6J and KKAy mice at 7 or 13 weeks of age were anesthetized using pentobarbital sodium, blood was collected, and parametrial WAT, liver tissue, and gastrocnemius muscle were dissected out and frozen in liquid nitrogen. Samples were stored at –80°C until use. For DIO studies, male C57BL/6J mice were divided at random into 2 groups at 10 weeks of age. The first group was fed a high-fat diet containing 30% fat by weight (AIN93G) while the second group was fed normal chow containing 5.9% fat by weight (CRF-1; Oriental Yeast Co.) for 9 weeks. After an overnight fast, mice were anesthetized, and blood and tissue samples were obtained as described above.
Biochemical measurements.
Urinary 8-epi-PGF2α was determined using an enzyme immunoassay kit (Assay Designs Inc.). Plasma levels of glucose and TG were measured using the Glucose-test and TG E-test, respectively, from Wako Pure Chemical Industries. Plasma adiponectin levels were determined using the Adiponectin ELISA kit (Otsuka). Plasma insulin levels were assessed using an insulin ELISA kit (Shibayagi).
Lipid peroxidation and hydrogen peroxide concentration.
Tissue samples were homogenized in a buffer solution containing 50 mM Tris-HCl (pH 7.4) and 1.15% KCl, and then centrifuged. The supernatant was used for the assay. The levels of lipid peroxidation in plasma and tissue homogenate were measured as TBARS using the LPO-test (Wako Pure Chemical Industries). Hydrogen peroxide concentration in plasma was measured using an Amplex Red hydrogen peroxide assay kit (Invitrogen Corp.).
H2O2 production.
Female C57BL/6J and KKAy mice at 7 weeks of age were anesthetized. Parametrial WAT and gastrocnemius muscle were dissected out and placed in Krebs-Ringer phosphate buffer containing (in mM) 145 NaCl, 5.7 sodium phosphate, 4.86 KCl, 0.54 CaCl2, 1.22 MgSO4, and 5.5 glucose (pH 7.4). The aorta was carefully removed, cleaned of excess fat and adventitia, and placed in Krebs-Ringer phosphate buffer. WAT, muscle, and aorta were cut into 2-mm square pieces and incubated at 37°C for 90 minutes. H2O2 released from the tissue was detected using the Amplex Red hydrogen peroxide assay kit (Invitrogen Corp.).
Quantitative RT-PCR.
Total RNA from WAT, liver, and skeletal muscle were prepared with an RNA STAT-60 kit (Tel-Test “B” Inc.). The cDNA was synthesized using the ThermoScript RT-PCR System (Invitrogen Corp.). Real-time PCR was performed on a LightCycler using the FastStart DNA Master SYBR Green I (Roche Diagnostics) according to the protocol provided by the manufacturer. Sequences of primers used for real-time PCR were as follows: Adiponectin, 5′-GATGGCAGAGATGGCACTCC-3′ and 5′-CTTGCCAGTGCTGCCGTCAT-3′; TNF-α, 5′-GCCACCACGCTCTTCTG-3′ and 5′-GGTGTGGGTGAGGAGCA-3′; PAI-1, 5′-TCAGCCCTTGCTTGCCTCAT-3′ and 5′-GCATAGCCAGCACCGAGGA-3′; IL-6, 5′-ACAACCACGGCCTTCCCTACTT-3′ and 5′-CACGATTTCCCAGAGAACATGTG-3′; MCP-1, 5′-CCACTCACCTGCTGCTACTCAT-3′ and 5′-TGGTGATCCTCTTGTAGCTCTCC-3′; PPARγ, 5′-CCAGAGTCTGCTGATCTGCG-3′ and 5′-GCCACCTCTTTGCTCTGCTC-3′; gp91phox, 5′-TTGGGTCAGCACTGGCTCTG-3′ and 5′-TGGCGGTGTGCAGTGCTATC-3′; p22phox, 5′-GTCCACCATGGAGCGATGTG-3′ and 5′-CAATGGCCAAGCAGACGGTC-3′; p67phox, 5′-CTGGCTGAGGCCATCAGACT-3′ and 5′-AGGCCACTGCAGAGTGCTTG-3′; p47phox, 5′-GATGTTCCCCATTGAGGCCG-3′ and 5′-GTTTCAGGTCATCAGGCCGC-3′; p40phox, 5′-GCCGCTATCGCCAGTTCTAC-3′ and 5′-GCAGGCTCAGGAGGTTCTTC-3′; Cu,Zn-SOD, 5′-CAGCATGGGTTCCACGTCCA-3′ and 5′-CACATTGGCCACACCGTCCT-3′; glutathione peroxidase, 5′-GGGCAAGGTGCTGCTCATTG-3′ and 5′-AGAGCGGGTGAGCCTTCTCA-3′; catalase, 5′-CCAGCGACCAGATGAAGCAG-3′ and 5′-CCACTCTCTCAGGAATCCGC-3′; cyclophilin, 5′-CAGACGCCACTGTCGCTTT-3′ and 5′-TGTCTTTGGAACTTTGTCTGCAA-3′; 18S ribosomal RNA, 5′-CGGCTACCACATCCAAGGAA-3′ and 5′-GCTGGAATTACCGCGGCT-3′.
Antioxidant enzyme activity.
Tissue homogenates were prepared as above. SOD activity was measured using the BIOXYTECH SOD-525 kit (Oxis International). GPx activity was measured using the method described previously (65).
Western blot analysis.
Tissue homogenates (20 μg protein) were subjected to SDS-PAGE, and immunoblotting was performed with anti–Cu,Zn-SOD polyclonal antibody (Upstate Biotechnology).
ROS production in 3T3-L1 adipocytes.
3T3-L1 preadipocytes were grown to confluence and induced to differentiate into adipocytes, as described (40). ROS production was detected by nitroblue tetrazolium (NBT) assay (35). NBT is reduced by ROS to a dark-blue, insoluble form of NBT called formazan. At days 0, 2, 4, and 8 after induction, 3T3-L1 cells were incubated for 90 minutes in PBS containing 0.2% NBT. Formazan was dissolved in 50% acetic acid, and the absorbance was determined at 560 nm. Fully differentiated 3T3-L1 adipocytes were incubated with or without 200-μM linoleic acid for 24 hours. Various inhibitors were added in the last hour of incubation, and the cells were incubated for 90 minutes in PBS containing 0.2% NBT with or without inhibitors. NBT, DPI, NAC, oxypurinol, rotenone, and thenoyltrifluoroacetone were purchased from Sigma-Aldrich. Apocynin was purchased from Calbiochem.
Effect of ROS on expression of genes in 3T3-L1 adipocytes.
At day 8 after induction, fully differentiated 3T3-L1 adipocytes were exposed to ROS by incubation with fresh medium containing xanthine oxidase plus hypoxanthine or H2O2 for 24 hours, with or without 10-mM NAC. Cells were harvested, total RNAs were extracted, and the mRNA amounts were quantified by real-time PCR, as described above. The levels of adiponectin in media were determined by Western blotting (40). Transfection experiments were performed as described previously (40). At day 4 after induction, 3T3-L1 cells in 12-well plates were transfected with 1 μg of the reporter construct containing the fragment corresponding to base pairs –908 to +14 of the human adiponectin promoter linked to a luciferase reporter gene, along with 0.5 μg of pCMX-β-gal (internal standard). Four hours later, cells were exposed to ROS for 20 hours, with or without 10 mM NAC. Luciferase activities were assayed using Luciferase Assay System (Promega Corp.). Values were normalized by an internal β-galactosidase control and expressed as the relative luciferase activity.
NADPH oxidase inhibitor treatment.
At 5 weeks of age, female C57BL/6J and KKAy mice were treated for 6 weeks with 5 mM apocynin added to the drinking water. At 11 weeks of age, the mice, fed ad libitum, were anesthetized using pentobarbital sodium, blood was collected, and parametrial WAT, liver, and skeletal muscle were dissected out for physiologic analyses. The liver TG contents were measured as described previously (66).
Statistical analysis.
In the human study, linear regression analysis was used to evaluate the relationship between 2 variables. All data are presented as mean ± SEM and were analyzed using unpaired Student’s t tests. P values less than 0.05 were considered statistically significant.
Supplementary Material
Acknowledgments
We are grateful to Hitoshi Nishizawa and Atsunori Fukuhara for the critical reading of the manuscript, Yoshihiro Tochino for excellent technical assistance, and Sumio Kiyoto for the helpful comments. We thank all members of the Shimomura laboratory for the helpful discussion and comments. This study was supported in part by Suzuken Memorial Foundation, the Tokyo Biochemical Research Foundation, Takeda Medical Research Foundation, Uehara Memorial Foundation, Takeda Science Foundation, Novartis Foundation of Japan for the Promotion of Science, the Cell Science Research Foundation, the Mochida Memorial Foundation for Medical and Pharmaceutical Research, a grant-in-aid from the Japan Medical Association, the Naito Foundation, a grant from the Japan Heart Foundation Research, Kato Memorial Bioscience Foundation, Japan Research Foundation for Clinical Pharmacology, the 21st century COE program, the Japan Society for the Promotion of Science, grants from the Ministry of Health, Labor and Welfare of Japan, and grants from the Ministry of Education, Culture, Sports, Science and Technology of Japan.
Footnotes
Makoto Makishima’s present address is: Department of Biochemistry, Nihon University School of Medicine, Tokyo, Japan.
Nonstandard abbreviations used: DIO, diet-induced obesity; DPI, diphenyleneiodonium; 8-epi-PGF2α, 8-epi-prostaglandin-F2α; GPx, glutathione peroxidase; MCP–1, monocyte chemotactic protein–1; NAC, N-acetyl cysteine; NBT, nitroblue tetrazolium; NOX, NADPH oxidase; PAI-1, plasminogen activator inhibitor–1; SOD, superoxide dismutase; TBARS, thiobarbituric acid reactive substance; TG, triglyceride; WAT, white adipose tissue.
Conflict of interest: The authors have declared that no conflict of interest exists.
References
- 1.Isomaa B, et al. Cardiovascular morbidity and mortality associated with the metabolic syndrome. Diabetes Care. 2001;24:683–689. doi: 10.2337/diacare.24.4.683. [DOI] [PubMed] [Google Scholar]
- 2.Ford ES, Giles WH, Dietz WH. Prevalence of the metabolic syndrome among US adults: findings from the Third National Health and Nutrition Examination Survey. JAMA. 2002;287:356–359. doi: 10.1001/jama.287.3.356. [DOI] [PubMed] [Google Scholar]
- 3.Grundy SM, et al. Definition of metabolic syndrome: Report of the National Heart, Lung, and Blood Institute/American Heart Association conference on scientific issues related to definition. Circulation. 2004;109:433–438. doi: 10.1161/01.CIR.0000111245.75752.C6. [DOI] [PubMed] [Google Scholar]
- 4.Montague CT, O’Rahilly S. The perils of portliness: causes and consequences of visceral adiposity. Diabetes. 2000;49:883–888. doi: 10.2337/diabetes.49.6.883. [DOI] [PubMed] [Google Scholar]
- 5.Matsuzawa Y, Funahashi T, Nakamura T. Molecular mechanism of metabolic syndrome X: Contribution of adipocytokines adipocyte-derived bioactive substances. Ann. N. Y. Acad. Sci. 1999;892:146–154. doi: 10.1111/j.1749-6632.1999.tb07793.x. [DOI] [PubMed] [Google Scholar]
- 6.Spiegelman BM, Flier JS. Obesity and the regulation of energy balance. Cell. 2001;104:531–543. doi: 10.1016/s0092-8674(01)00240-9. [DOI] [PubMed] [Google Scholar]
- 7.Kahn BB, Flier JS. Obesity and insulin resistance. J. Clin. Invest. 2000;106:473–481. doi: 10.1172/JCI10842. [DOI] [PMC free article] [PubMed] [Google Scholar]
- 8.Friedman JM. Obesity in the new millennium. Nature. 2000;404:632–634. doi: 10.1038/35007504. [DOI] [PubMed] [Google Scholar]
- 9.Saltiel AR, Kahn CR. Insulin signaling and the regulation of glucose and lipid metabolism. Nature. 2001;414:799–806. doi: 10.1038/414799a. [DOI] [PubMed] [Google Scholar]
- 10.Shimomura I, et al. Enhanced expression of PAI-1 in visceral fat: possible contributor to vascular disease in obesity. Nat. Med. 1996;2:800–803. doi: 10.1038/nm0796-800. [DOI] [PubMed] [Google Scholar]
- 11.Hotamisligil GS, Shargill NS, Spiegelman BM. Adipose expression of tumor necrosis factor-α: direct role in obesity-linked insulin resistance. Science. 1993;259:87–91. doi: 10.1126/science.7678183. [DOI] [PubMed] [Google Scholar]
- 12.Uysal KT, Wiesbrock SM, Marino MW, Hotamisligil GS. Protection from obesity-induced insulin resistance in mice lacking TNF-alpha function. Nature. 1997;389:610–614. doi: 10.1038/39335. [DOI] [PubMed] [Google Scholar]
- 13.Steppan CM, et al. The hormone resistin links obesity to diabetes. Nature. 2001;409:307–312. doi: 10.1038/35053000. [DOI] [PubMed] [Google Scholar]
- 14.Banerjee RR, et al. Regulation of fasted blood glucose by resistin. Science. 2004;303:1195–1198. doi: 10.1126/science.1092341. [DOI] [PubMed] [Google Scholar]
- 15.Friedman JM, Halaas JL. Leptin and the regulation of body weight in mammals. Nature. 1998;395:763–770. doi: 10.1038/27376. [DOI] [PubMed] [Google Scholar]
- 16.Farooqi IS, et al. Partial leptin deficiency and human adiposity. Nature. 2001;414:34–35. doi: 10.1038/35102112. [DOI] [PubMed] [Google Scholar]
- 17.Unger RH. The physiology of cellular liporegulation. Annu. Rev. Physiol. 2003;65:333–347. doi: 10.1146/annurev.physiol.65.092101.142622. [DOI] [PubMed] [Google Scholar]
- 18.Berg AH, Combs TP, Scherer PE. ACRP30/adiponectin: An adipokine regulating glucose and lipid metabolism. Trends Endocrinol. Metab. 2002;13:84–89. doi: 10.1016/s1043-2760(01)00524-0. [DOI] [PubMed] [Google Scholar]
- 19.Tsao TS, Lodish HF, Fruebis J. ACRP30, a new hormone controlling fat and glucose metabolism. Eur. J. Pharmacol. 2002;440:213–221. doi: 10.1016/s0014-2999(02)01430-9. [DOI] [PubMed] [Google Scholar]
- 20.Matsuzawa Y, Funahashi T, Kihara S, Shimomura I. Adiponectin and metabolic syndrome. Arterioscler. Thromb. Vasc. Biol. 2004;24:29–33. doi: 10.1161/01.ATV.0000099786.99623.EF. [DOI] [PubMed] [Google Scholar]
- 21.Arita Y, et al. Paradoxical decrease of an adipose-specific protein, adiponectin, in obesity. Biochem. Biophys. Res. Commun. 1999;257:79–83. doi: 10.1006/bbrc.1999.0255. [DOI] [PubMed] [Google Scholar]
- 22.Fruebis J, et al. Proteolytic cleavage product of 30-kDa adipocyte complement-related protein increases fatty acid oxidation in muscle and causes weight loss in mice. Proc. Natl. Acad. Sci. U. S. A. 2001;98:2005–2010. doi: 10.1073/pnas.041591798. [DOI] [PMC free article] [PubMed] [Google Scholar]
- 23.Yamauchi T, et al. The fat-derived hormone adiponectin reverses insulin resistance associated with both lipoatrophy and obesity. Nat. Med. 2001;7:941–946. doi: 10.1038/90984. [DOI] [PubMed] [Google Scholar]
- 24.Berg AH, Combs TP, Du X, Brownlee M, Scherer PE. The adipocyte-secreted protein Acrp30 enhances hepatic insulin action. Nat. Med. 2001;7:947–953. doi: 10.1038/90992. [DOI] [PubMed] [Google Scholar]
- 25.Maeda N, et al. Diet-induced insulin resistance in mice lacking adiponectin/ACRP30. Nat. Med. 2002;8:731–737. doi: 10.1038/nm724. [DOI] [PubMed] [Google Scholar]
- 26.Okamoto Y, et al. Adiponectin reduces atherosclerosis in apolipoprotein E-deficient mice. Circulation. 2002;106:2767–2770. doi: 10.1161/01.cir.0000042707.50032.19. [DOI] [PubMed] [Google Scholar]
- 27.Matsuda M, et al. Role of adiponectin in preventing vascular stenosis. The missing link of adipo-vascular axis. J. Biol. Chem. 2002;277:37487–37491. doi: 10.1074/jbc.M206083200. [DOI] [PubMed] [Google Scholar]
- 28.Yamauchi T, et al. Globular adiponectin protected ob/ob mice from diabetes and apoE-deficient mice from atherosclerosis. J. Biol. Chem. 2003;278:2461–2468. doi: 10.1074/jbc.M209033200. [DOI] [PubMed] [Google Scholar]
- 29.Brownlee M. Biochemistry and molecular cell biology of diabetic complications. Nature. 2001;414:813–820. doi: 10.1038/414813a. [DOI] [PubMed] [Google Scholar]
- 30.Maddux BA, et al. Protection against oxidative stress-induced insulin resistance in rat L6 muscle cells by micromolar concentrations of α-lipoic acid. Diabetes. 2001;50:404–410. doi: 10.2337/diabetes.50.2.404. [DOI] [PubMed] [Google Scholar]
- 31.Rudich A, et al. Prolonged oxidative stress impairs insulin-induced GLUT4 translocation in 3T3-L1 adipocytes. Diabetes. 1998;47:1562–1569. doi: 10.2337/diabetes.47.10.1562. [DOI] [PubMed] [Google Scholar]
- 32.Matsuoka T, et al. Glycation-dependent, reactive oxygen species-mediated suppression of the insulin gene promoter activity in HIT cells. J. Clin. Invest. 1997;99:144–150. doi: 10.1172/JCI119126. [DOI] [PMC free article] [PubMed] [Google Scholar]
- 33.Nakazono K, et al. Does superoxide underlie the pathogenesis of hypertension? Proc. Natl. Acad. Sci. U. S. A. 1991;88:10045–10048. doi: 10.1073/pnas.88.22.10045. [DOI] [PMC free article] [PubMed] [Google Scholar]
- 34.Ohara Y, Peterson TE, Harrison DG. Hypercholesterolemia increases endothelial superoxide anion production. J. Clin. Invest. 1993;91:2546–2551. doi: 10.1172/JCI116491. [DOI] [PMC free article] [PubMed] [Google Scholar]
- 35.Oliveira HR, et al. Pancreatic β-cells express phagocyte-like NAD(P)H oxidase. Diabetes. 2003;52:1457–1463. doi: 10.2337/diabetes.52.6.1457. [DOI] [PubMed] [Google Scholar]
- 36.Griendling KK, Sorescu D, Ushio-Fukai M. NAD(P)H oxidase: role in cardiovascular biology and disease. Circ. Res. 2000;86:494–501. doi: 10.1161/01.res.86.5.494. [DOI] [PubMed] [Google Scholar]
- 37.Li S, Valente AJ, Zhao S, Clark RA. PU.1 is essential for p47phox promoter activity in myeloid cells. J. Biol. Chem. 1997;272:17802–17809. doi: 10.1074/jbc.272.28.17802. [DOI] [PubMed] [Google Scholar]
- 38.Nishikawa T, et al. Normalizing mitochondrial superoxide production blocks three pathways of hyperglycaemic damage. Nature. 2000;404:787–790. doi: 10.1038/35008121. [DOI] [PubMed] [Google Scholar]
- 39.Inoguchi T, et al. High glucose level and free fatty acid stimulate reactive oxygen species production through protein kinase C-dependent activation of NAD(P)H oxidase in cultured vascular cells. Diabetes. 2000;49:1939–1945. doi: 10.2337/diabetes.49.11.1939. [DOI] [PubMed] [Google Scholar]
- 40.Iwaki M, et al. Induction of adiponectin, a fat-derived antidiabetic and antiatherogenic factor, by nuclear receptors. Diabetes. 2003;52:1655–1663. doi: 10.2337/diabetes.52.7.1655. [DOI] [PubMed] [Google Scholar]
- 41.Simons JM, Hart BA, Ip Vai Ching TR, Van Dijk H, Labadie RP. Metabolic activation of natural phenols into selective oxidative burst agonists by activated human neutrophils. Free Radic. Biol. Med. 1990;8:251–258. doi: 10.1016/0891-5849(90)90070-y. [DOI] [PubMed] [Google Scholar]
- 42.Meyer JW, et al. Identification of a function leukocyte-type NADPH oxidase in human endothelial cells: a potential atherogenic source of reactive oxygen species. Endothelium. 1990;7:11–22. doi: 10.3109/10623329909165308. [DOI] [PubMed] [Google Scholar]
- 43.Beswick RA, Dorrance AM, Leite R, Webb RC. NADH/NADPH oxidase and enhanced superoxide production in the mineralocorticoid hypertensive rat. Hypertension. 2001;38:1107–1111. doi: 10.1161/hy1101.093423. [DOI] [PubMed] [Google Scholar]
- 44.Cotter MA, Cameron NE. Effect of the NAD(P)H oxidase inhibitor, apocynin, on peripheral nerve perfusion and function in diabetic rats. Life Sci. 2003;73:1813–1824. doi: 10.1016/s0024-3205(03)00508-3. [DOI] [PubMed] [Google Scholar]
- 45.Fried SK, Bunkin DA, Greenberg AS. Omental and subcutaneous adipose tissues of obese subjects release interleukin-6: depot difference and regulation by glucocorticoid. J. Clin. Endocrinol. Metab. 1998;83:847–850. doi: 10.1210/jcem.83.3.4660. [DOI] [PubMed] [Google Scholar]
- 46.Sartipy P, Loskutoff DJ. Monocyte chemoattractant protein 1 in obesity and insulin resistance. Proc. Natl. Acad. Sci. U. S. A. 2003;100:7265–7270. doi: 10.1073/pnas.1133870100. [DOI] [PMC free article] [PubMed] [Google Scholar]
- 47.Hainault I, et al. Adipose tissue-specific increase in angiotensinogen expression and secretion in the obese (fa/fa) zucker rat. Am. J. Physiol. Endocrinol. Metab. 2002;282:E59–E66. doi: 10.1152/ajpendo.2002.282.1.E59. [DOI] [PubMed] [Google Scholar]
- 48.Keaney JF, Jr, et al. Obesity and systemic oxidative stress: clinical correlates of oxidative stress in the Framingham Study. Arterioscler. Thromb. Vasc. Biol. 2003;23:434–439. doi: 10.1161/01.ATV.0000058402.34138.11. [DOI] [PubMed] [Google Scholar]
- 49.Olusi SO. Obesity is an independent risk factor for plasma lipid peroxidation and depletion of erythrocyte cytoprotective enzymes in humans. Int. J. Obes. Relat. Metab. Disord. 2002;26:1159–1164. doi: 10.1038/sj.ijo.0802066. [DOI] [PubMed] [Google Scholar]
- 50.Shibuya A, et al. Nitration of PPARγ inhibits ligand-dependent translocation into the nucleus in a macrophage-like cell line, RAW 264. FEBS Lett. 2002;525:43–47. doi: 10.1016/s0014-5793(02)03059-4. [DOI] [PubMed] [Google Scholar]
- 51.Roskams T, et al. Oxidative stress and oval cell accumulation in mice and humans with alcoholic and nonalcoholic fatty liver disease. Am. J. Pathol. 2003;163:1301–1311. doi: 10.1016/S0002-9440(10)63489-X. [DOI] [PMC free article] [PubMed] [Google Scholar]
- 52.Weisberg SP, et al. Obesity is associated with macrophage accumulation in adipose tissue. J. Clin. Invest. 2003;112:1796–1808. doi:10.1172/JCI200319246. doi: 10.1172/JCI19246. [DOI] [PMC free article] [PubMed] [Google Scholar]
- 53.Xu H, et al. Chronic inflammation in fat plays a crucial role in the development of obesity-related insulin resistance. J. Clin. Invest. 2003;112:1821–1830. doi:10.1172/JCI200319451. doi: 10.1172/JCI19451. [DOI] [PMC free article] [PubMed] [Google Scholar]
- 54.Shiose A, et al. A novel superoxide-producing NAD(P)H oxidase in kidney. J. Biol. Chem. 2001;276:1417–1423. doi: 10.1074/jbc.M007597200. [DOI] [PubMed] [Google Scholar]
- 55.Suh YA, et al. Cell transformation by the superoxide-generating oxidase Mox1. Nature. 1999;401:79–82. doi: 10.1038/43459. [DOI] [PubMed] [Google Scholar]
- 56.Mahadev K, et al. The NAD(P)H oxidase homolog Nox4 modulates insulin-stimulated generation of H2O2 and plays an integral role in insulin signal transduction. Mol. Cell. Biol. 2004;24:1844–1854. doi: 10.1128/MCB.24.5.1844-1854.2004. [DOI] [PMC free article] [PubMed] [Google Scholar]
- 57.Yang S, Zhang Y, Ries W, Key L. Expression of Nox4 in osteoclasts. J. Cell. Biochem. 2004;92:238–248. doi: 10.1002/jcb.20048. [DOI] [PubMed] [Google Scholar]
- 58.Sorescu D, et al. Superoxide production and expression of Nox family proteins in human atherosclerosis. Circulation. 2002;105:1429–1435. doi: 10.1161/01.cir.0000012917.74432.66. [DOI] [PubMed] [Google Scholar]
- 59.Curzio M, et al. Possible role of aldehydic lipid peroxidation products as chemoattractants. Int. J. Tissue React. 1987;9:295–306. [PubMed] [Google Scholar]
- 60.Tirosh A, Potashnik R, Bashan N, Rudich A. Oxidative stress disrupts insulin-induced cellular redistribution of insulin receptor substrate-1 and phosphatidylinositol 3-kinase in 3T3-L1 adipocytes. J. Biol. Chem. 1999;274:10595–10602. doi: 10.1074/jbc.274.15.10595. [DOI] [PubMed] [Google Scholar]
- 61.Jacob S, et al. Oral administration of RAC-alpha-lipoic acid modulates insulin sensitivity in patients with type-2 diabetes mellitus: a placebo-controlled pilot trial. Free Radic. Biol. Med. 1999;27:309–314. doi: 10.1016/s0891-5849(99)00089-1. [DOI] [PubMed] [Google Scholar]
- 62.Evans JL, Goldfine ID, Maddux BA, Grodsky GM. Oxidative stress and stress-activated signaling pathways: A unifying hypothesis of type 2 diabetes. Endocrine Rev. 2002;23:599–622. doi: 10.1210/er.2001-0039. [DOI] [PubMed] [Google Scholar]
- 63.Krieger-Brauer HI, Kather H. Human fat cells possess a plasma membrane-bound H2O2-generating system that is activated by insulin via a mechanism bypassing the receptor kinase. J. Clin. Invest. 1992;89:1006–1013. doi: 10.1172/JCI115641. [DOI] [PMC free article] [PubMed] [Google Scholar]
- 64.Krieger-Brauer HI, Kather H. Antagonistic effects of different members of the fibroblast and platelet-derived growth factor families on adipose conversion and NADPH-dependent H2O2 generation in 3T3-L1 cells. Biochem. J. 1995;307:549–556. doi: 10.1042/bj3070549. [DOI] [PMC free article] [PubMed] [Google Scholar]
- 65.Takahashi, K. 2000. Glutathione peroxidase: coupled enzyme assay. In Experimental protocols for reactive oxygen and nitrogen species. N. Taniguchi and J.M.C. Gutteridge, editors. Oxford University Press. Oxford, United Kingdom. 79–80.
- 66.Yokode M, Hammer RE, Ishibashi S, Brown MS, Goldstein JL. Diet-induced hypercholesterolemia in mice: prevention of overexpression of LDL receptors. Science. 1990;250:1273–1275. doi: 10.1126/science.2244210. [DOI] [PubMed] [Google Scholar]
Associated Data
This section collects any data citations, data availability statements, or supplementary materials included in this article.


