

ABSTRACT
Background
Inverse association between lower level of 25‐hydroxyvitamin D [25(OH)D] and higher prevalence of peripheral arterial disease (PAD) among individuals with cardiovascular diseases (CVD) is known. Less is known about the relationship between 25(OH)D and ankle‐brachial blood pressure index (ABPI) in asymptomatic adults. We hypothesized a nonlinear relationship between 25(OH)D and ABPI in asymptomatic adults without PAD.
Methods
Data from the continuous NHANES (2001–2004) was used. Minimum of the two reported ABPI value was chosen for each individual (>18 years). Linear regression models with spline adjusted for demographic and traditional risk factors for CVD were used to examine nonlinear relationship between 25(OH)D and ABPI. Mean changes in ABPI per 10 ng/mL change in 25(OH)D were reported.
Results
Mean (SD) age and 25(OH)D levels of 4979 participants (48% females) were 60.4 (13.22) years and 22.1 (8.68) ng/mL, respectively, while mean (SD) ABPI was 1.07 (0.15). We observed positive association between 25(OH)D and ABPI both in the univariable and multivariable regression models (all p < 0.05). In univariable regression with spline, a significant increase in ABPI (ß = 0.03, 95% CI: 0.02–0.04) was observed until 25(OH)D reached but not above 27 ng/mL. Similarly, in multivariable spline models, 25(OH)D was positively associated with ABPI (ß = 0.02, 95% CI: 0.01–0.03) only up to 27 ng/mL.
Conclusions
In asymptomatic adults without PAD, rising serum 25(OH)D concentration but not above 27 ng/mL was associated with statistically significant increase in ABPI.
Keywords: peripheral artery disease, 25(OH)D, NHANES, ankle‐brachial blood pressure index
Background
Peripheral arterial disease (PAD) includes a diverse group of disorders that leads to progressive stenosis or occlusion of the noncoronary branches of aorta, including carotid and mesenteric arteries, as well as the arteries of upper and lower limbs. PAD affects approximately 10 million Americans,1, 2, 3 including 12–20% of elderly (≥65 years), and is independently associated with increased morbidity and mortality.4, 5, 6 The ankle‐brachial blood pressure index (ABPI) that reflects perfusion changes in lower relative to the upper extremity is widely used to diagnose and assess severity of PAD.7 A resting ABPI, in the range of 0.9 to 1.3, is considered normal, while a low index is a strong and independent predictor of all‐cause and cardiovascular (CV) mortality.5, 8, 9 A number of risk factors such as older age, males gender, body mass index, hypertension, cigarette smoking, diabetes, and dyslipidemia that lead to progression of atherosclerosis, also contribute to the pathogenesis and progression of PAD5, 10, 11, 12, 13, 14
Lower level of serum 25‐hydroxyvitamin D [25(OH)D] has been identified as an independent risk factor for higher prevalence of various cardiovascular disease (CVD) phenotypes including PAD.15, 16, 17, 18, 19 25(OH)D, by binding to the vitamin D receptors (VDR) expressed on monocytes and endothelial cells,20 play critical role in the transcription cascades and probably increase synthesis and release of proangiogenic molecules, such as vascular endothelial growth factor (VEGF).21 VEGF and related factors modulate vascular endothelial cells to promote angiogenesis.22 In vitro studies have shown that low 25(OH)D levels may promote inflammation in the artery wall by influencing expression of macrophages and lymphocytes in atherosclerotic plaques.23
Observational studies have estimated wide range of serum 25(OH)D level (28–40 ng/mL) for its role in CVD reduction including PAD.15, 16, 19, 24, 25 Epidemiological studies have shown nonlinear trends between 25(OH)D and surrogate markers of CV health as well as with all‐cause and CV mortality in asymptomatic adults.20, 26, 27 However, less is known about the relationship between 25(OH)D and ABPI in asymptomatic adults without established PAD.
We have examined data from the continuous National Health and Nutritional Examination Survey (NHANES) to study the relationship between 25(OH)D status and ABPI in adults without established diagnosis of PAD. We hypothesized that, the rising serum concentration of 25(OH)D may increase ABPI (reflecting positive impact on PAD), however, once 25(OH)D rise above a certain threshold, it may not significantly change ABPI, hence may not help in reducing the risk of PAD.
Methods
We used publicly available data from the continuous NHANES 2001–2004. NHANES is an ongoing, multistage, probability sample survey of the civilian, noninstitutionalized, population, designed to assess the health and nutritional status of adults and children in the United States. Detailed interviews, physical examinations, and serum samples were obtained from subjects who participated in the survey. Details of sampling procedures and data collection techniques have been described previously and are available online (available at: http://www.cdc.gov/nchs/nhanes/about_nhanes.htm, accessed January 5, 2014).
In continuous NHANES, primary sampling units represent variance (sampling units used to estimate sampling error) units. These sampling weights were assigned to each subject, reflecting adjustment for the unequal probability of selection, nonresponse, and adjustments for independent population controls. The participants were oversampled for certain population subgroups, such as non‐Hispanic blacks and Mexican Americans, to ensure reliability and precision of the health estimates in these subgroups. Masked variance units, used to define the strata, were created for each 2‐year cycle of the continuous NHANES data, allowing any combination of data cycles without recoding by the users.
Demographic information was collected from self‐reported responses to questionnaires administered by the trained interviewers. Body mass index was calculated by dividing body weight in kilograms by the height in meters squared. Obesity was defined as a body mass index of ≥30 kg/m2 and overweight if the body mass index was ≥25 kg/m2 but <30 kg/m2. Blood pressure was reported as an average of up to four measurements using a mercury sphygmomanometer. Hypertension was defined for a mean systolic blood pressure ≥140 mm of Hg and mean diastolic blood pressure ≥90 mm of Hg, a known diagnosis of hypertension, or current use of antihypertensive medications. The participants were categorized as smokers if they were currently smoking or had ever smoked ≥100 cigarettes.
The glomerular filtration rate was calculated using the modification of diet in renal disease formula.28 The serum glucose level was measured using the Beckman Synchron LX20 test (Beckman Coulter, Fullerton, CA, USA) on refrigerated specimens, and the cholesterol level was measured enzymatically in a series of coupled reactions that hydrolyze cholesteryl esters and oxidize the 3‐OH group of cholesterol.
DiaSorin (formerly Incstar) radioimmunoassay (Nutritional Biochemistry Branch, Division of Laboratory Sciences, National Center for Environmental Health, Atlanta, GA, USA), a 2‐step procedure, was used to assay 25(OH)D. The first procedure involved extraction of 25(OH)D and other hydroxylated metabolites from serum with acetonitrile. Next, the treated sample was assayed using an equilibrium radioimmunoassay procedure. Updated and adjusted data files were used for 25(OH)D to address assay drift. C‐reactive protein (CRP) was quantified using latex‐enhanced nephelometry and a Behring Nephelometer II Analyzer (Department of Laboratory Medicine, Immunology Division, University of Washington Medical Center, Seattle, WA, USA).
We used ABPI as a surrogate measure for the diagnosis and degree of severity of PAD. ABPI measurements were obtained by trained technicians on eligible participants over 40 years of age unless they had physical challenges (e.g., bilateral lower extremity amputations) or if there were equipment limitations (e.g., participants weighed over 400 lbs.). Participants while in supine position had their systolic blood pressures measured on both arms (midpoint) for brachial arteries and on both ankles for posterior tibial arteries using sphygmomanometer cuffs with bladder widths of 9–18 cm. The sphygmomanometer cuffs were chosen based on individual's arm circumference while participant in standing position and the same size cuff was used for arms and ankles with rare exceptions. Participants aged 40–59 years had their blood pressures measured twice at each site, whereas participants 60 and older were measured once at each site. For each patient, the ABPI was calculated by dividing the mean systolic blood pressure in each ankle by the mean blood pressure in the respective arm.29 ABPI was treated as a continuous variable and the minimum of the two reported ABI values was chosen for each individual.
Participants with missing values on 25(OH)D or without ABPI performed were excluded from the analysis. To study nonlinear relationship between 25(OH)D and ABPI, we introduced spline in linear regression models; a single knot at 27 ng/mL [75th percentile of serum 25(OH)D in this cohort] approximating the threshold for the nonskeletal benefits of 25(OH)D including PAD prevention.15, 16, 19, 24, 25 In order to create a larger sample, data from two, 2‐year cycles of the continuous NHANES were combined for years 2001–02 and 2003–04. Sample weights were constructed for 4 years of combined survey data, with rescaling of weights such that sum of weights matched with the survey population at the midpoint of each survey period.
Analyses were performed on Stata/IC version 12.1 (Stata Corp LP, College Station, TX, USA) using survey‐specific commands. We used t‐test or chi‐square statistic to examine differences between the two groups [below or above the 75th percentile of 25(OH)] of participants. Selected variables were log‐transformed to meet the assumptions of residual normality. The mean change in ABPI was reported as beta coefficients with 95% confidence intervals (CIs) for every 10 ng/mL change in 25(OH)D concentration. Linear regression models were adjusted for age, sex, race, body mass index, hypertension, smoking, CRP, total cholesterol, serum glucose, and renal function as estimated by glomerular filtration rate. A p value of <0.05 was considered statistically significant.
Results
The mean age (SD) of 4979 study participants was 60.4 (13.22) years. Of these, 2410 (48%) were females and 2891 (58%) whites. The mean (SD) values for serum 25(OH)D was 22.1(8.68) ng/mL, for CRP 0.46 (0.81) mg/dL, and 1.07 (0.15) for ABPI.
Table 1 shows population characteristics of the study participants by the serum 25(OH)D concentration. A total of 3746 (75%) participants had 25(OH)D concentration ≤ 27 ng/mL. There was a significantly higher proportion of non‐Hispanic whites (93%) compared to non‐Hispanic blacks (1.6%) among participants with 25(OH)D levels >27 ng/mL. Mean ABPI was slightly but significantly higher in participants with 25(OH)D concentration >27 ng/mL compared to participants with 25(OH)D concentration ≤27 ng/mL (p < 0.001). A significantly lower proportion of participants with 25(OH)D concentration >27 ng/mL were hypertensive compared to those with 25(OH)D concentration ≤ 27 ng/mL (44% vs. 49%, p value < 0.01). Median ABPI was above 1 in smokers and non‐smokers irrespective of 25(OH)D levels (Figure 1).
Table 1.
Population characteristics
| Covariates | 25 (OH)D (ng/mL) | p Value | |
|---|---|---|---|
| <27 (N = 3746) | >27 (N = 1233) | ||
| Age (years)* | 56.05 (55.44, 56.65) | 55.71 (54.92, 56.48) | 0.37 |
| Females, n (%) | 1831 (51.04) | 579 (49.41) | 0.38 |
| ABPI* | 1.08 (1.08, 1.09) | 1.11 (1.10, 1.12) | <0.001 |
| Race, n (%) | |||
| Non‐Hispanic white | 1881 (72.8) | 1010 (92.82) | <0.0001 |
| Mexican American | 797 (5.55) | 125 (2.02) | <0.0001 |
| Non‐Hispanic black | 797 (11.91) | 57 (1.66) | <0.0001 |
| Other Hispanics | 132 (4.63) | 22 (1.73) | 0.02 |
| Other race | 139 (5.12) | 19 (1.76) | 0.0002 |
| HTN,† n (%) | 2100 (49.42) | 637 (43.61) | 0.01 |
| CRP (mg/dL)* | 0.45 (0.41, 0.49) | 0.34 (0.31, 0.37) | <0.001 |
| Serum glucose (mg/dL) | 100.02 (98.64, 101.39) | 93.64 (92.71, 94.58) | <0.001 |
| Body mass index (kg/m2)* | 28.96 (28.58, 29.34) | 27.08 (26.67, 27.50) | <0.001 |
| Smoker, n (%) (current and ever) | 641 (18.54) | 189 (17.31) | 0.43 |
| GFR (mL/min/m2)* | 89.32 (88.23, 90.41) | 84.89 (83.47,86.31) | <0.001 |
| Total cholesterol (mg/dL)* | 209.83 (207.63,212.04) | 208.52 (205.07,211.97) | 0.48 |
*Variable reported as mean values with 95% CIs. ABPI = ankle‐brachial blood pressure index.
†Hypertension; defined as average systolic BP > 140 or average diastolic BP > 90 mm of Hg or individuals ever told to have HTN, or if participants were taking an antihypertensive.
GFR = glomerular filtration rate measured using modification of diet in renal disease (MDRD) equation.
Because of rounding not all percentages total 100.
Figure 1.
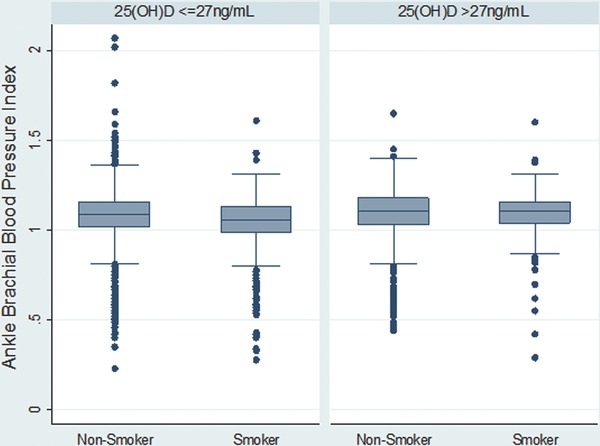
Distribution of ABPI by smoking status stratified by serum 25(OH)D levels below and above its 75th percentile i.e., 27 ng/mL.
In both univariable and multivariable linear regression models without spline, we found that for each 10 ng/mL increase in its serum concentration, 25(OH)D was associated with a statistically significant increase in ABPI (beta‐coefficient 0.018, 95% CI: 0.013 to 0.023) and (beta‐coefficient 0.013, 95% CI: 0.008 to 0.018), respectively (Table 2 ).
Table 2.
Mean Change (beta‐coefficient and 95% CI) in ankle‐brachial blood pressure index per 10 ng/mL change in 25(OH)D
| Linear regression without spline | Linear regression with spline 25(OH)D Ä 27 (ng/mL) | Linear regression with spline 25(OH)D > 27 (ng/mL) | |
|---|---|---|---|
| Univariable | 0.018 (0.013, 0.023) | 0.03 (0.02, 0.04) | −0.001 (−0.01, 0.01) |
| Multivariable | 0.013 (0.008, 0.018) | 0.02 (0.01, 0.03) | 0.004 (−0.004, 0.01) |
In the univariable linear regression model using a single spline (Figure 2), for each 10 ng/mL increase in its serum concentration, 25(OH)D was associated with a significant increase in ABPI (beta‐coefficient 0.03, 95% CI: 0.02 to 0.04), but only up to 27 ng/mL (75th percentile). Any change in 25(OH)D above its 75th percentile was associated with a statistically insignificant change in ABPI (beta‐coefficient 0.001, 95% CI: 0.01 to 0.01).
Figure 2.
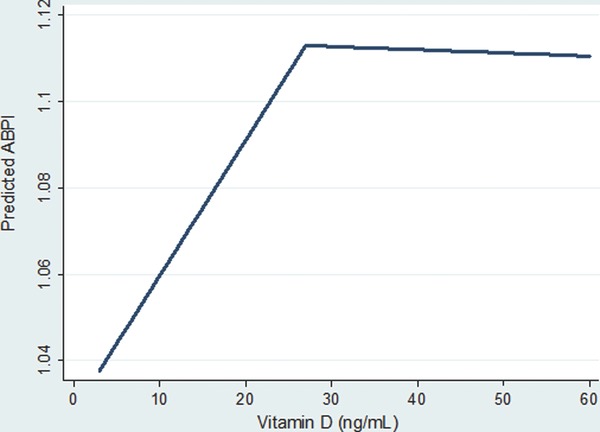
Relationship between predicted ankle‐brachial blood pressure index (ABPI) and rising serum 25(OH) D concentration from the univariate spline [single knot at 27 ng/mL; 75th percentile of 25(OH)D] regression.
In the multivariable linear regression models with spline, the association between 25(OH)D and ABPI remain significant for each 10 ng/mL increase in 25(OH)D up to (beta‐coefficient 0.02, 95% CI: 0.01 to 0.03), but not after (beta‐coefficient 0.004, 95% CI: – 0.004 to 0.01) its 75th percentile (i.e., 27 ng/mL) (Table 2 ).
Discussion
In this study of a large national cohort of asymptomatic adults, independent of traditional CVD risk factors, we found an increase in ABPI with rising serum 25(OH)D concentration, reflecting a positive relationship between higher 25(OH)D concentration and PAD. However, in multivariable linear spline analysis, once serum 25(OH)D levels rose above its 75th percentile (i.e., 27 ng/mL), there was no statistically significant change observed in ABPI in asymptomatic adults without established diagnosis of PAD. These findings support our hypothesis of a nonlinear relationship between serum 25(OH)D and ABPI in asymptotic adults.
Previous studies support our finding of nonlinear behavior of serum 25(OH)D with PAD. Melamed et al. have shown a significant increase in the adjusted prevalence ratio of PAD (PR 1.80; 95% CI: 1.19–2.74) among individuals in the first [25(OH)D < 17.8 ng/mL, median:12.9 ng/mL], but not in the second [25(OH)D 17.8–23.4 ng/mL, median: 20.4 ng/mL] and third quartiles [25(OH)D 23.5–29.1 ng/mL, median: 26 ng/mL], when compared to participants in the fourth quartile [25(OH)D ≥ 29.2 ng/mL, median: 33.8 ng/mL].30 Similarly, Reis et al. have discovered a nonlinear trend in the lower odds of PAD with increasing quartiles of 25(OH)D, particularly in blacks.31 In addition, Zittermann et al. have reported angiotoxic effects of vitamin D due to increased calcification and arterial stiffness both at its excess as well as at lower levels.32 Recent epidemiological evidence of nonlinear relationship of 25(OH)D with surrogate markers of CV health as well as with all‐cause and CV mortality, hint for its plateau effect beyond a certain threshold especially among asymptomatic adults.20, 26, 27
25(OH)D is believed to exert its cellular effects on vasculature by binding to VDR on monocytes and endothelial cells.20 This binding of 25(OH)D with VDR starts a cascade of conformational changes that ultimately modulate gene expression leading to increased synthesis and release of proangiogenic molecules—VEGF, for example.21 25(OH)D deficiency is inversely correlated with the proliferation and morphological changes in vascular smooth muscle cells, dysfunctional vascular endothelium, and increased blood pressure,33, 34 which can indirectly impact the prevalence of PAD.
Among the proposed mechanisms for the “saturation effect” of 25(OH)D on CVD phenotypes including PAD is the probable development of resistance or altered sensitivity to its effect especially in chronically deficient individuals, such as non‐Hispanic blacks.31 Altered sensitivity to 25(OH)D or related factors—especially after a period of deficiency—may impact actions of 25(OH)D on different organs, including bone and the vasculature. This phenomenon would also occur if serum levels of other co‐factors were not increased concomitantly with 25(OH)D, such as zinc and vitamins A and K, which act synergistically on skeletal and CV systems with 25(OH)D.35, 36
The saturation effect on ABPI with increasing 25(OH)D concentration could also involve tissue response to hypoxemia. In order to create collateral circulation for an ischemic limb, the transcription factor such as hypoxia‐inducible factor 1‐alpha (HIF‐1α) activates cells to produce VEGF and other proangiogenic factors.22, 37 Studies have shown that the active metabolite of vitamin D may inhibit VEGF induced angiogenesis especially in tumor cells in a dose dependent manner.38, 39, 40 It is possible that after an initial increase in ABPI with rising vitamin D concentration especially among individuals with subnormal levels at baseline, but once vitamin D and its active metabolite reaches a certain threshold, the beneficial effect may be offset by the decreased hypoxia‐driven angiogenesis once the HIF‐1 alpha pathway is inhibited.
Current guidelines by the Institute of Medicine on 25(OH)D supplementation designate serum 25(OH)D levels less than 20 ng/mL as “deficient,” although levels less than 30 ng/mL may still be considered insufficient in adults.41 However, it is to be noted that these guidelines are primarily used in clinical practice for musculoskeletal health. Our study, suggests that 25(OH)D levels above 27 ng/mL may not confer statistically significant benefits for the primary prevention of PAD in otherwise healthy adults. This information is useful for clinical practice especially when evaluating the need and scope of possible supplementation for individuals with true 25(OH)D deficiency and those with CVD risk factors for PAD.
The strengths of our study include its large sample size and a wide age range. NHANES sampling method allowed for better estimates and adjustments for various ethnic backgrounds, rendering dataset more nationally representative. The 25(OH)D levels were measured using a reliable 2‐part assay. Using an objective tool such as ABPI provided robust information on PAD among asymptomatic healthy adults. These measurements were executed by technician staff who were expressly trained to perform them, minimizing errors of technique and using a standardized method.
Our study has potential limitations. Due to the cross‐sectional design, a temporal relation between 25(OH)D and PAD may not be established. In addition, we did not adjust for geographic location of the study participants nor factors such as weather, latitude, or time of the year when the serum markers were measured. These factors may have influenced the observed relation between 25(OH)D and PAD. Finally, the study participants were noninstitutionalized and mobile enough to attend their physician and laboratory visits, so it may have excluded certain subsegments of the population and those with severe PAD that they were rendered immobile.30
In conclusion, we report that independent of traditional CV risk factors, ABPI increases as serum 25(OH)D concentration increase in asymptomatic adults without PAD. Serum 25(OH)D levels above 27 ng/mL are associated with statistically insignificant increase in ABPI once models were adjusted for demographic and traditional CVD risk factors. It is likely that the benefit of 25(OH)D supplementation for the primary prevention of PAD may only be seen among participants with serum 25(OH)D levels ≤27 ng/mL, at base line. Given the beneficial role of 25(OH)D in limiting PAD progression, long‐term interventional trials on larger scale are needed among 25(OH)D deficient individuals.
Relationship with Industry
None reported by any authors.
Grants or Other Forms of Financial Support
Rehan Qayyum was supported by National Institute of Health grant No. 5K23HL105897–01.
Conflict of Interest Disclosure
None reported by any author.
Data Access
Muhammad Amer and Rehan Qayyum have complete access to data and all authors contributed in writing the original manuscript.
References
- 1. Hirsch AT, Criqui MH, Treat‐Jacobson D, Regensteiner JG, Creager MA, Olin JW, Krook SH, Hunninghake DB, Comerota AJ, Walsh ME, et al. Peripheral arterial disease detection, awareness, and treatment in primary care. JAMA. 2001; 286(11): 1317–1324. [DOI] [PubMed] [Google Scholar]
- 2. Schanzer A, Conte MS. Critical limb ischemia. Curr Treat Options Cardiovasc Med. 2010; 12(3): 214–229. [DOI] [PMC free article] [PubMed] [Google Scholar]
- 3. Hirsch AT, Hartman L, Town RJ, Virnig BA. National health care costs of peripheral arterial disease in the Medicare population. Vasc Med. 2008; 13(3): 209–215. [DOI] [PubMed] [Google Scholar]
- 4. Ostchega Y, Paulose‐Ram R, Dillon CF, Gu Q, Hughes JP. Prevalence of peripheral arterial disease and risk factors in persons aged 60 and older: data from the National Health and Nutrition Examination Survey 1999–2004. J Am Geriatr Soc. 2007; 55(4): 583–589. [DOI] [PubMed] [Google Scholar]
- 5. Norgren L, Hiatt WR, Dormandy JA, Nehler MR, Harris KA, Fowkes FG. Inter‐society consensus for the management of peripheral arterial disease (TASC II). J Vasc Surg. 2007; 45(Suppl S): S5–S67. [DOI] [PubMed] [Google Scholar]
- 6. Feinglass J, Pearce WH, Martin GJ, Gibbs J, Cowper D, Sorensen M, Henderson WG, Daley J, Khuri S. Postoperative and late survival outcomes after major amputation: findings from the Department of Veterans Affairs National Surgical Quality Improvement Program. Surgery. 2001; 130(1): 21–29. [DOI] [PubMed] [Google Scholar]
- 7. McDermott MM, Guralnik JM, Ferrucci L, Tian L, Liu K, Liao Y, Green D, Sufit R, Hoff F, Nishida T, et al. Asymptomatic peripheral arterial disease is associated with more adverse lower extremity characteristics than intermittent claudication. Circulation. 2008; 117(19): 2484–2491. [DOI] [PMC free article] [PubMed] [Google Scholar]
- 8. Murabito JM, Evans JC, Larson MG, Nieto K, Levy D, Wilson PW. The Ankle‐brachial index in the elderly and risk of stroke, coronary disease, and death: the Framingham Study. Intern Med. 2003; 163(16): 1939–1942. [DOI] [PubMed] [Google Scholar]
- 9. Ankle Brachial Index Collaboration ; Fowkes FG, Murray GD, Butcher I, Heald CL, Lee RJ, Chambless LE, Folsom AR, Hirsch AT, Dramaix M, deBacker G, et al. Ankle brachial index combined with Framingham Risk Score to predict cardiovascular events and mortality: a meta‐analysis. JAMA. 2008; 300(2): 197–208. [DOI] [PMC free article] [PubMed] [Google Scholar]
- 10. Gornik HL, Beckman JA. Cardiology patient page. Peripheral arterial disease. Circulation. 2005; 111(13): e169–e172. [DOI] [PubMed] [Google Scholar]
- 11. Ridker PM, Stampfer MJ, Rifai N. Novel Risk Factors for Systemic Atherosclerosis: a comparison of C‐reactive Protein, fibrinogen, homocysteine, lipoprotein(a), and standard cholesterol screening as predictors of peripheral arterial disease. JAMA. 2001; 285(19): 2481–2485. [DOI] [PubMed] [Google Scholar]
- 12. Hirsch AT, Haskal ZJ, Hertzer NR, Bakal CW, Creager MA, Halperin JL, Hiratzka LF, Murphy WR, Olin JW, Puschett JB, et al. ACC/AHA 2005 guidelines for the management of participants with peripheral arterial disease (lower extremity, renal, mesenteric, and abdominal aortic): executive summary Circulation. 2006; 113(11): e463–e654. [DOI] [PubMed] [Google Scholar]
- 13. Roger VL, Go AS, Lloyd‐Jones DM, Benjamin EJ, Berry JD, Borden WB, Bravata DM, Dai S, Ford ES, Fox CS, et al. Heart disease and stroke statistics—2012 update: a report from the American Heart Association. American Heart Association Statistics Committee and Stroke Statistics Subcommittee. Circulation. 2012; 125(1): e2–e220. [DOI] [PMC free article] [PubMed] [Google Scholar]
- 14. Adam DJ, Beard JD, Cleveland T, Bell J, Bradbury AW, Forbes JF, Fowkes FG, Gillepsie I, Ruckley CV, Raab G, et al. Bypass versus angioplasty in severe ischemia of the leg (BASIL): multicentre, randomised controlled trial. Lancet. 2005; 366(9501): 1925–1934. [DOI] [PubMed] [Google Scholar]
- 15. Hossein‐nezhad A, Holick MF. Vitamin D for health: a global perspective. Mayo Clin Proc. 2013; 88(7): 720–755. [DOI] [PMC free article] [PubMed] [Google Scholar]
- 16. Anderson JL, May HT, Horne BD, Bair TL, Hall NL, Carlquist JF, Lappé DL, Muhlestein JB. Intermountain Heart Collaborative (IHC) Study Group. relation of vitamin D deficiency to cardiovascular risk factors, disease status, and incident events in a general healthcare population. Am J Cardiol. 2010; 106(7): 963–968. [DOI] [PubMed] [Google Scholar]
- 17. Lee JH, O'Keefe JH, Bell D, Hensrud DD, Holick MF. Vitamin D deficiency: an important, common, and easily treatable cardiovascular risk factor? J Am Coll Cardiol. 2008; 52(24): 1949–1956. [DOI] [PubMed] [Google Scholar]
- 18. Wallis DE, Penckofer S, Sizemore GW. The “sunshine deficit” and cardiovascular disease. Circulation. 2008; 118(14): 1476–1485. [DOI] [PubMed] [Google Scholar]
- 19. Holick MF. Vitamin D deficiency. N Engl J Med. 2007; 357(3): 266–281. [DOI] [PubMed] [Google Scholar]
- 20. Amer M, Qayyum R. Relation between serum 25‐hydroxyvitamin D and C‐reactive protein in asymptomatic adults (from the continuous National Health and Nutrition Examination Survey 2001 to 2006). Am J Cardiol. 2012; 109(2): 226–230. [DOI] [PubMed] [Google Scholar]
- 21. Cardus A, Panizo S, Encinas M, Dolcet X, Gallego C, Aldea M, Fernandez E, Valdivielso JM. 1,25‐dihydroxyvitamin D3 regulates VEGF production through a vitamin D response element in the VEGF promoter. Atherosclerosis. 2009; 204(1): 85–89. [DOI] [PubMed] [Google Scholar]
- 22. Semenza, GL . Oxygen sensing, homeostasis, and disease. N Engl J Med. 2011; 365(6): 537–547. [DOI] [PubMed] [Google Scholar]
- 23. Arnson Y, Itzhaky D, Mosseri M, Barak V, Tzur B, Agmon‐Levin N, Amital H. Vitamin D inflammatory cytokines and coronary events: a comprehensive review. Clin Rev Allergy Immunol. 2013; 45(2): 236–247. [DOI] [PubMed] [Google Scholar]
- 24. Holick MF, Binkley NC, Bischoff‐Ferrari HA, Gordon CM, Hanley DA, Heaney RP, Murad MH, Weaver CM; Endocrine Society. Evaluation, treatment, and prevention of vitamin D deficiency: an Endocrine Society clinical practice guideline. J Clin Endocrinol Metab. 2011; 96(7): 1911–1930. [DOI] [PubMed] [Google Scholar]
- 25. Hossein‐nezhad A, Holick MF. Optimize dietary intake of vitamin D: an epigenetic perspective. Curr Opin Clin Nutr Metab Care. 2012; 15(6): 567–579. [DOI] [PubMed] [Google Scholar]
- 26. Amer M, Qayyum R. The relationship between 25‐hydroxyvitamin D and homocysteine in asymptomatic adults. J Clin Endocrinol Metab. 2014; 99: 633–638. [DOI] [PMC free article] [PubMed] [Google Scholar]
- 27. Amer M, Qayyum R. Relationship between 25‐hydroxyvitamin D and all‐cause and cardiovascular disease mortality. Am J Med. 2013; 126(6): 509–514. [DOI] [PubMed] [Google Scholar]
- 28. National Kidney Foundation . K/DOQI clinical practice guidelines for chronic kidney disease: evaluation, classification, and stratification. National Kidney Foundation. Am J Kidney Dis. 2002; 39(2 Suppl 1): S1–S266. [PubMed] [Google Scholar]
- 29. National Center for Health Statistics. National Health and Nutrition Examination Survey. Available at: http://www.cdc.gov/nchs/nhanes/nhanes2003‐‐2004/LEXAB_C.htm. Accessed January 5th, 2014.
- 30. Melamed ML, Muntner P, Michos ED, Uribarri J, Weber C, Sharma J, Raggi P. Serum 25‐hydroxyvitamin D levels and the prevalence of peripheral arterial disease: results from NHANES 2001 to 2004. Arterioscler Thromb Vasc Biol. 2008; 28(6): 1179–1185. [DOI] [PMC free article] [PubMed] [Google Scholar]
- 31. Reis JP, Michos ED, von Mühlen D, Miller ER 3rd. Differences in vitamin D status as a possible contributor to the racial disparity in peripheral arterial disease. Am J Clin Nutr. 2008; 88(6): 1469–1477. [DOI] [PubMed] [Google Scholar]
- 32. Zittermann A, Schleithoff SS, Koerfer R. Vitamin D and vascular calcification. Curr Opin Lipidol. 2007; 18(1): 41–46. [DOI] [PubMed] [Google Scholar]
- 33. Chua GT, Chan YC, Cheng SW. Vitamin D status and peripheral arterial disease: evidence so far. Health Risk Manag. 2011; 7: 671–675. [DOI] [PMC free article] [PubMed] [Google Scholar]
- 34. Li YC, Kong J, Wei M, Chen ZF, Liu SQ, Cao LP. 1, 25‐Dihydroxyvitamin D (3) is a negative endocrine regulator of the renin‐angiotensin system. J Clin Invest. 2002; 110(2): 229–238. [DOI] [PMC free article] [PubMed] [Google Scholar]
- 35. Kidd PM. Vitamins D and K as pleiotropic nutrients: clinical importance to the skeletal and cardiovascular systems and preliminary evidence for synergy. Altern Med Rev. 2010; 15(3): 199–222. [PubMed] [Google Scholar]
- 36. Beulens JW, Bots ML, Atsma F, Bartelink ML, Prokop M, Geleijnse JM, Witteman JC, Grobbee DE, van der Schouw YT. High dietary menaquinone intake is associated with reduced coronary calcification. Atherosclerosis. 2009; 203(2): 489–493. [DOI] [PubMed] [Google Scholar]
- 37. Semenza GL. Hypoxia‐inducible factors in physiology and medicine. Cell. 2012; 148(3): 399–408. [DOI] [PMC free article] [PubMed] [Google Scholar]
- 38. Ben‐Shoshan M, Amir S, Dang DT, Dang LH, Weisman Y, Mabjeesh NJ. 1 alpha, 25‐dihydroxyvitamin D3 (Calcitriol) inhibits hypoxia‐inducible factor‐1/vascular endothelial growth factor pathway in human cancer cells. Mol Cancer Ther. 2007; 6(4): 1433–1439. [DOI] [PubMed] [Google Scholar]
- 39. Mantell DJ, Owens PE, Bundred NJ, Mawer EB, Canfield AE. 1 alpha, 25‐dihydroxyvitamin D (3) inhibits angiogenesis in vitro and in vivo. Circ Res. 2000; 87(3): 214–220. [DOI] [PubMed] [Google Scholar]
- 40. Vanoirbeek E, Krishnan A, Eelen G, Verlinden L, Bouillon R, Feldman D, Verstuyf A. The anti‐cancer and anti‐inflammatory actions of 1, 25(OH)2D3 . Best Pract Res Clin Endocrinol Metab. 2011; 25(4): 593–604. [DOI] [PMC free article] [PubMed] [Google Scholar]
- 41. Institute of Medicine. Dietary reference intakes for calcium and vitamin D. Brief report. 2010. Available at: http://www.iom.edu/w/media/Files/Report/20Files/2010/Dietary‐Reference‐Intakes‐for‐Calcium‐and Vitamin/Vitamin/20D/20and/20Calcium/202010/20Report/20Brief.pdf. Accessed January 2014.