

Abstract
Cenicriviroc, a dual CCR2/CCR5 antagonist, is being evaluated for treatment of nonalcoholic steatohepatitis and liver fibrosis (CENTAUR; NCT02217475). As it is metabolized by the liver, cenicriviroc was investigated in hepatic‐impaired participants for pharmacokinetic changes. Participants with mild‐to‐moderate hepatic impairment (HI) (Child–Pugh class A (N = 7) or B (N = 8)) and matched controls (N = 15) received cenicriviroc 150 mg once daily for 14 days. Serial blood samples were obtained on Days 1 and 14. Safety, tolerability, and effects on CCR2/CCR5 ligands, cytokines, and bacterial translocation biomarkers were evaluated. Cenicriviroc exposures were increased by moderate HI (AUC0‐τ 55%, Cmax 29% higher) but were not with mild HI (AUC0‐τ 38%, Cmax 40% lower). Cenicriviroc was well tolerated. Rapid and potent CCR2/CCR5 blockade was observed, not associated with increases in hepatic inflammation or bacterial translocation biomarkers. Study findings suggest that cenicriviroc 150 mg can be used in patients with mild‐to‐moderate HI.
Study Highlights
WHAT IS THE CURRENT KNOWLEDGE ON THE TOPIC?
✓ Limited data are available on the effects of HI on CCR2 or CCR5‐antagonists PKs. Maraviroc (CCR5 antagonist) requires no dosing adjustment for HI, but no data are available for investigational CCR2 (CCX140‐b, JNJ‐41443532) or CCR2/5 (BMS‐813160, PF‐04634817) antagonists.
WHAT QUESTION DID THIS STUDY ADDRESS?
✓ This study evaluated the effects of mild‐to‐moderate HI on cenicriviroc's (CCR2/5 antagonist) PKs and safety. Effects on proinflammatory cytokines and biomarkers of bacterial translocation were also explored.
WHAT THIS STUDY ADDS TO OUR KNOWLEDGE?
✓ Study findings suggest that cenicriviroc 150 mg can be dosed in subjects with mild‐to‐moderate HI. The favorable safety profile and CCR2/CCR5 blockade observed here are consistent with previously reported findings.
HOW THIS MIGHT CHANGE CLINICAL PHARMACOLOGY OR TRANSLATIONAL SCIENCE?
✓ Cenicriviroc is currently being evaluated for the treatment of nonalcoholic steatohepatitis and liver fibrosis in the 2‐year phase IIb CENTAUR study. As these participants are at increased risk of progression to cirrhosis and some may eventually suffer from HI, these data provide reassurance on CVC dosing in the setting of worsening disease.
Nonalcoholic fatty liver disease (NAFLD) is associated with increased morbidity and mortality worldwide, mainly attributable to cardiovascular and chronic liver diseases,1, 2, 3 and the prevalence is increasing globally.1, 2, 3 While disease progression for people with liver steatosis is typically slow, those with nonalcoholic steatohepatitis (NASH; steatosis with inflammation) and hepatic fibrosis can progress to cirrhosis and hepatocellular carcinoma.1, 2, 3, 4, 5 NASH is the second indication for liver transplant in the United States and predicted to become the first by 2020.6, 7 There are currently no approved agents to treat NASH; several classes of medication (e.g., insulin sensitizers, fatty acid‐bile acid conjugates, antifibrotic agents, and C‐C chemokine receptor types 2 and 5 (CCR2/CCR5) antagonists) are currently being investigated in clinical trials.8
CCR2/CCR5 antagonists disrupt the interactions between CCR2/CCR5 and their ligands, which mediate the inflammatory immune response that can lead to fibrogenesis.9, 10 Following hepatocyte injury, hepatic macrophages (Kupffer cells) secrete C‐C chemokine ligand type 2 (CCL2, a.k.a. monocyte chemoattractant protein‐1 [MCP‐1]), driving the recruitment and migration of proinflammatory monocytes to the liver.11, 12 Here, they mature into macrophages, secreting proinflammatory cytokines (e.g., transforming growth factor‐β [TGF‐β], platelet‐derived growth factor [a potent myofibroblast growth factor], interleukin(IL)‐1β, and adipose tissue proinflammatory mediators, such as IL‐6 and tumor necrosis factor‐α [TNF‐α]) that activate hepatic stellate cells (HSCs) and further aggravate hepatocyte injury.13, 14, 15, 16 Activated HSCs differentiate into myofibroblast‐like cells that produce collagen, the basis of the extracellular matrix that deposits in the liver, resulting in fibrosis and, eventually, cirrhosis.14, 15, 16, 17 This entire process is further exacerbated by increased bacterial translocation observed in liver disease. Bacterial products such as lipopolysaccharide enhance hepatic inflammation and fibrosis via Toll‐like receptor (TLR)4‐mediated activation of Kupffer cells and HSCs.18 TLR5 activation by flagellin (a marker of bacterial translocation) has also been shown to cause hepatic injury in mice19; flagellin induces CCL4 (a.k.a. macrophage inflammatory protein‐1β) and CCL5 (a.k.a. regulated on activation normal T‐cell expressed and secreted [RANTES]) expression in HIV‐1‐infected lymphoid tissue.20
Cenicriviroc is an oral, potent, dual CCR2/CCR5 antagonist with a plasma half‐life of 30–40 h in humans. It demonstrated potent antiinflammatory and antifibrotic activity in animal models of peritonitis, liver, and kidney diseases.21, 22, 23, 24, 25, 26 Cenicriviroc showed potent CCR2/CCR5 blockade in HIV‐infected participants in a phase IIb study27 and led to decreases in aspartate aminotransferase (AST)‐to‐platelet ratio index (APRI), noninvasive hepatic fibrosis index (FIB‐4), and enhanced liver fibrosis score.27, 28, 29 Decreases in both APRI and FIB‐4 correlated with reductions in soluble CD14 (sCD14, a marker of monocyte activation) levels. Evaluation of cenicriviroc in ∼600 participants to date, including 115 receiving cenicriviroc for 48 weeks,27 supports a favorable safety profile. Taken together, these data paved the way for the ongoing multicenter phase IIb trial, CENTAUR (652‐2‐203; NCT02217475), which will evaluate the efficacy and safety of cenicriviroc 150 mg once daily for the treatment of NASH and liver fibrosis over 2 years, with a primary end point at Year 1, in 289 participants with NASH and liver fibrosis at increased risk of progression to cirrhosis.30
NASH has been shown to be associated with decreased hepatic‐enzyme activity, such as for cytochrome P450 (CYP)3A,31 suggesting that cenicriviroc is likely to be used in people with hepatic impairment (HI). HI is known to potentially alter a drug's pharmacokinetics (PK; i.e., metabolism, distribution, and elimination) based on differences in liver blood‐flow, CYP and transporter changes, and protein binding.32 This may create a need for dose adjustment in patients with HI, so the US Food and Drug Administration (FDA) recommends that drugs substantially metabolized or eliminated by the liver should be evaluated in patients with HI.33
Cenicriviroc is metabolized by the liver (it is a substrate of CYP3A4, CYP2C8, and P‐glycoprotein, and also a weak inhibitor of CYP3A4), and is >98% bound to plasma proteins. Understanding the impact of HI on the PK and safety of cenicriviroc is essential to guide future dosing and use, based on any clinically relevant changes that could alter the benefit/risk profile. Cenicriviroc has a fairly wide therapeutic range, and modest PK variability, and the impact of HI on its PK is expected to be minor, based on characteristics of the molecule, including metabolic profile, and clearance pathways.
This study aimed to compare the PK of cenicriviroc in participants with mild or moderate HI (Child–Pugh A and B) with those in participants with normal hepatic function. The safety and tolerability of cenicriviroc and its effects on CCR2/CCR5 ligands, proinflammatory cytokines, and biomarkers of bacterial translocation were also evaluated.
METHODS
This study (652‐1‐121) was registered under clinical trial number NCT02120547 and conducted in accordance with the current Declaration of Helsinki (2013). Participants were enrolled at Clinical Pharmacology of Miami, FL. Written informed consent was obtained at the screening visit; study protocol and informed consent were reviewed by the Institutional Review Board (IntegReview IRB, Austin, TX). Cenicriviroc (cenicriviroc mesylate) 150 mg tablets were supplied by Tobira Therapeutics, South San Francisco, CA.
Study design
This phase I, open‐label, nonrandomized, single‐center study was conducted in the United States and enrolled participants with mild (Child–Pugh class A) or moderate (Child–Pugh class B) HI; healthy participants with normal hepatic function were matched for age (±5 years), body weight (±15%), and gender. The study was composed of two cohorts: i) participants with mild HI and their matched controls with normal hepatic function (“matched controls (mild)”); ii) participants with moderate HI and their matched controls with normal hepatic function (“matched controls (moderate)”). Both cohorts were conducted in parallel. The study design was based on the FDA guidelines on HI studies.33
In healthy participants, cenicriviroc has been shown to reach steady‐state plasma concentrations within approximately 8–10 days of dosing. A treatment period of 14 days was chosen to allow adequate time to reach steady‐state in the event that changes in cenicriviroc PK were observed in participants with HI. A cenicriviroc 150 mg single‐tablet formulation was used, as per the ongoing CENTAUR study. Administration with food has been shown to increase cenicriviroc bioavailability; therefore, the tablets were scheduled to be taken once daily with breakfast (∼500–700 kcal and 15–20 g of fat) after overnight fast for 14 days; all participants had an identical breakfast on Days 1 and 14.
Study participants
Participants 18–65 years of age were enrolled, with a weight ≥50.0 kg and a body mass index 18.0–40.0 kg/m2. Those with stable liver disease (cryptogenic, posthepatic, hepatitis B or C virus, NAFLD, NASH) also had mild or moderate HI, assessed according to the Child–Pugh classification (Class A (5–6 points) or B (7–9 points), respectively). Cirrhosis diagnosis was confirmed from medical records (documenting a definitive diagnostic procedure, i.e., liver biopsy, ultrasound, computed tomography scan, magnetic resonance imaging) with physical examination upon study entry.
Exclusion criteria for all participants included average alcohol intake of >14 units/week; positive results for drugs of abuse or alcohol‐screening tests; positive for HIV‐1 or HIV‐2 antibody. Those for participants with HI included: progressive liver disease within the last 4 weeks; severe ascites or hepatic encephalopathy; alanine aminotransferase (ALT) >5 × upper limit of normal (ULN) at screening; biliary liver cirrhosis or other causes of HI not related to parenchymal disorder and/or disease of the liver; history of, or candidate for, liver transplantation; hepatocellular carcinoma or acute liver disease. For matched controls, exclusion criteria included: known history of porphyria, active liver disease, or an unexplained elevation of serum transaminases, alkaline phosphatase, albumin, prothrombin time, or total bilirubin; positive for hepatitis B surface antigen or hepatitis C virus (HCV) antibody.
Concomitant medication use was kept to a minimum. Medications necessary for the management of HI or other chronic conditions were permitted if regimens were stable for at least 7 days prior to study drug administration. Use of products altering the activity of CYP450 enzymes (e.g., specific medications, grapefruit‐containing products, or St John's wort), or prolonging the QT/QTc interval were prohibited.
Study objectives
The primary objective was to compare the multiple‐dose PK of cenicriviroc in adults with mild or moderate HI against those in matched controls. The secondary objective was to evaluate the safety and tolerability of cenicriviroc in participants with HI. The tertiary objective was to assess changes from baseline in CCR2/CCR5 ligands, proinflammatory cytokines, and biomarkers of bacterial translocation in participants with normal hepatic function, or mild‐to‐moderate HI.
Outcome measures
Pharmacokinetic assessment
Serial blood samples (5 mL) for plasma cenicriviroc concentrations were obtained on Days 1 and 14 at 0 (predose), 0.5, 1, 2, 3, 4, 6, 8, 12, and 24 h postdose (i.e., predose on Day 2 and in the morning of Day 15). PK blood samples were also obtained predose on Days 3, 5, 7, 10, 13, and 16. After collection, blood samples were placed on ice and centrifuged within 45 min of collection at 2,000g for 15 min at 5°C. Plasma was transferred and divided into two aliquots and kept frozen at –70°C until assayed. Cenicriviroc and the added internal standard were extracted by protein precipitation. The extract was then subjected to reverse‐phase, high‐pressure liquid chromatography (RP‐HPLC) on a C18 analytical column; detection of the analytes was achieved by tandem mass spectrometry (MS/MS) using the Sciex API3000 LC‐MS/MS system. The bioanalytical method was validated over the range 5.00–960 ng/mL.
Minimum and maximum plasma concentrations (Cmin, Cmax), time to reach the maximum concentration (Tmax), area under the concentration–time curve from time zero to infinity (AUC0–∞) and over the dosing interval (AUC0–τ), elimination half‐life (t1/2), accumulation ratio (Day 14 AUC0–τ/Day 1 AUC0–τ), apparent total body clearance (CL/F), and apparent volume of distribution (Vz/F) were determined on Days 1 and 14 using a standard noncompartmental method with WinNonlin v. 6.3 (Pharsight, Cary, NC) based on plasma cenicriviroc concentrations. Assumptions to calculate AUC0–∞ and AUC0–τ included linear PK and reaching steady‐state by Day 14. Time to steady‐state was determined by evaluating Cmin over the 14 days of dosing. Steady‐state was declared once Cmin were within 10% of the Day 14 predose concentration.
Safety assessment
Adverse events (AEs) were monitored continuously and graded by intensity according to the Division of AIDS toxicity scale. Physical examinations were undertaken at screening (Days –28 to –2), baseline (Day –1), and follow‐up visits (Day 28 for all participants, Day 35 only for those with HI). Hematology, clinical chemistry, urinalysis, and 12‐lead electrocardiograms were performed at screening, baseline, and Days 14 and 28; hematology and clinical chemistry were also performed at Day 7.
Biomarkers analysis
CCR2 and CCR5 ligands (CCL2, CCL3, CCL4, CCL5) and proinflammatory cytokines (IL‐6, TNF‐α, IL‐1β, TGF‐β) were measured on the Luminex platform on plasma samples from Day 1 and during cenicriviroc treatment at Days 7 and 14 (HCYTOMAG‐60K MILLIPLEX (Merck Millipore, Darmstadt, Germany) was used for CCL2, CCL3, CCL4, IL‐1β, IL‐6; Human RANTES enzyme‐linked immunosorbent assay (ELISA) kit (PeproTech, London, UK) for CCL5; Human TGF‐β 1 DuoSet ELISA (R&D Systems, Minneapolis, MN) for TGF‐β). Markers of enterocyte death, intestinal fatty acid binding protein (I‐FABP) (R&D Systems), and bacterial translocation, flagellin (MyBioSource, San Diego, CA), lipopolysaccharide binding protein (LBP) (Hycult Biotech, Plymouth Meeting, Philadelphia, PA), and sCD14 (R&D Systems), were measured at the same timepoints by ELISA according to the manufacturers’ instructions. Correlation between flagellin and I‐FABP or ALT levels was evaluated in both cohorts.
Statistical analysis
Plasma concentrations and PK parameters were summarized using descriptive statistics by treatment group. Analysis of variance was performed on log‐normal (ln)‐transformed Cmax, Cmin, and AUC0–τ values. The ratios of the least squares geometric means and 90% confidence intervals (CIs) for these parameters were compared between the cohorts of hepatic‐impaired participants and matched controls. Statistical analyses were performed using SAS v. 9.2 (SAS Institute, Cary, NC).
Clinical safety data were summarized using descriptive statistics for the safety population; no statistical analyses were conducted for the safety end points.
CCR2/CCR5 ligands, cytokines, and biomarkers were summarized using descriptive statistics (e.g., medians, interquartile ranges) by study day, with changes from baseline also computed and reported. Wilcoxon tests and Spearman correlations were used. Statistical analyses were conducted using GraphPad Prism v. 6.0 (GraphPad Software, La Jolla, CA).
RESULTS
Study population
Forty‐six participants were screened and 15 excluded (two did not meet inclusion criteria, six met exclusion criteria, four did not present at the clinic, one withdrew consent, two were reserve participants). In all, 31 participants were enrolled: eight with mild HI and seven matched controls (mild), eight with moderate HI and eight matched controls (moderate). Thirty participants received all doses of study medication (one withdrew from the mild HI group on Day 1 due to a mild AE of vomiting, and was excluded from the PK analysis); 29 participants completed the study (one withdrew consent (due to relocation) after the last cenicriviroc dose was administered on Day 14).
Demographics and baseline characteristics of enrolled participants are captured in Table 1. The majority of participants were male (71.0%), 93.6% of participants were White, and 6.4% were Black/African American. The median age of participants was 59 years (range 43–64) and median body mass index was 27.9 kg/m2 (range 18.8–37.9). The majority of participants with HI tested positive for HCV antibody (75.0% and 62.5% with mild or moderate HI, respectively) and a large proportion displayed past alcohol abuse (62.5% and 87.5% with mild or moderate HI, respectively). All but one participant in the HI groups were diagnosed with cirrhosis (15/16). In the moderate HI group, seven out of eight participants had ascites.
Table 1.
Demographics and baseline characteristics of enrolled participants with mild or moderate hepatic impairment and their matched controls
| Mild hepatic impairment (N = 8) | Matched controls (mild) (N = 7) | Moderate hepatic impairment (N = 8) | Matched controls (moderate) (N = 8) | |
|---|---|---|---|---|
| Demographics | ||||
| Male, N (%) | 4 (50.0) | 4 (57.1) | 7 (87.5) | 7 (87.5) |
| Median age, years (min–max) | 58.0 (49–63) | 59.0 (56–62) | 61.0 (43–64) | 58.0 (53–62) |
| Race, N (%) | ||||
| White | 8 (100) | 7 (100) | 7 (87.5) | 7 (87.5) |
| Black or African American | 0 (0) | 0 (0) | 1 (12.5) | 1 (12.5) |
| Hispanic or Latino ethnicity, N (%) | 5 (62.5) | 7 (100) | 3 (37.5) | 7 (87.5) |
| Median BMI, kg/m2 (min–max) | 26.8 (18.8–33.5) | 28.3 (24.1–30.9) | 28.2 (24.7–37.9) | 27.7 (22.2–32.4) |
| Baseline characteristics | ||||
| Hepatitis B core antibody positive, N (%) | 2 (25.0) | 0 (0) | 5 (62.5) | 0 (0) |
| Hepatitis B surface antigen positive, N (%) | 1 (12.5) | 0 (0) | 1 (12.5) | 0 (0) |
| Hepatitis C virus antibody positive, N (%) | 6 (75.0) | 0 (0) | 5 (62.5) | 0 (0) |
| Alcohol habit, N (%) | 5 (62.5) | 1 (14.3) | 7 (87.5) | 2 (25.0) |
| Cirrhosis present, N (%) | 7 (87.5) | 0 (0) | 8 (100) | 0 (0) |
| Ascites, N (%) | 0 (0) | 0 (0) | 7 (87.5) | 0 (0) |
BMI, body mass index; N, number of participants.
Pharmacokinetic analysis
Day 1 pharmacokinetic results
Following a single dose of cenicriviroc 150 mg on Day 1, participants with mild HI had numerically lower cenicriviroc exposures compared with matched controls (mild), based on Cmin, Cmax, AUC0–∞, and AUC0–τ geometric means (Supplementary Table 1). The opposite trend was observed in the moderate HI cohort, apart from Cmax, which was higher in matched controls (moderate). The geometric mean (coefficient of variation (CV), %) t1/2 was 8.4 h (12.7) and 8.2 h (9.3) in participants with mild HI and matched controls (mild), respectively, and 10.4 h (30.6) and 8.1 h (9.3) in those with moderate HI and matched controls (moderate), respectively.
The apparent CL/F geometric mean (CV%) was 27.1 L/h (32.0) and 22.1 L/h (43.2) in participants with mild HI and matched controls (mild), respectively; and 25.8 L/h (29.1) and 31.7 L/h (79.9) in those with moderate HI and matched controls (moderate), respectively. The apparent Vz/F geometric mean (CV%) was 329 L (27.3) and 262 L (40.3) in participants with mild HI and matched controls (mild), respectively; and 386 L (36.8) and 370 L (76.6) in those with moderate HI and matched controls (moderate), respectively.
Steady‐state pharmacokinetics
Based on predose samples, steady‐state conditions were achieved after 10–13 days of cenicriviroc in participants with mild or moderate HI, and after 7–10 days in matched controls. HI delayed time to steady‐state concentrations.
Day 14 pharmacokinetic results
The geometric mean concentration–time profiles of cenicriviroc on Day 14 are displayed in Figure 1 a (mild HI group and matched controls [mild]) and Figure 1 b (moderate HI group and matched controls [moderate]). Following the last dose of 150 mg on Day 14, participants with mild HI had numerically lower cenicriviroc exposures compared with those of matched controls (mild), based on Cmin, Cmax, AUC0–∞, and AUC0–τ geometric means; those with moderate HI generally had numerically increased cenicriviroc exposures compared with matched controls (moderate) (Table 2).
Figure 1.
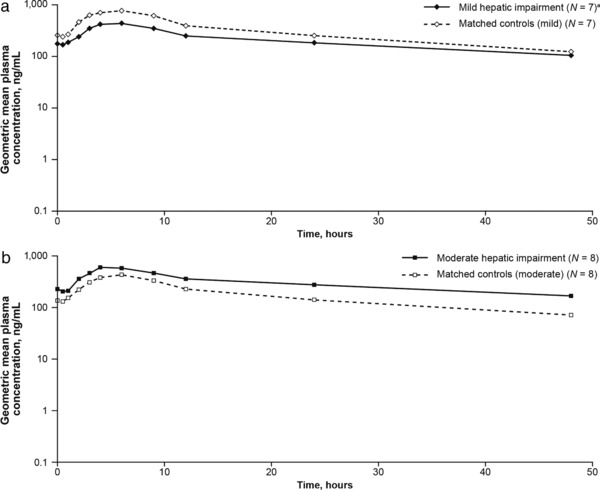
Geometric mean plasma concentration–time profiles of cenicriviroc following the last dose on Day 14 for participants with (a) mild hepatic impairment compared with matched controls (mild); (b) moderate hepatic impairment compared with matched controls (moderate). aOne participant withdrew from the mild hepatic impairment group due to vomiting on Day 1 and was excluded from the PK analysis. N, number of participants; PK, pharmacokinetic.
Table 2.
Summary of PK parameters on Day 14 following administration of cenicriviroc 150 mg once dailya
| Parameters | Mild hepatic impairment (N = 7)a | Matched controls (mild) (N = 7) | Moderate hepatic impairment (N = 8) | Matched controls (moderate) (N = 8) | |
|---|---|---|---|---|---|
| Tmax, h | Geometric mean (SD) | 5.34 (1.2) | 5.66 (1.2) | 4.83 (1.3) | 4.49 (1.3) |
| CV% | 20.0 | 15.4 | 28.0 | 26.3 | |
| Cmax, ng/mL | Geometric mean (SD) | 452 (2.0) | 759 (1.4) | 607 (1.2) | 469 (2.0) |
| CV% | 79.7 | 36.6 | 16.0 | 77.7 | |
| AUC0–∞, h·ng/mL | Geometric mean (SD) | 14,639 (1.6) | 18,890 (1.7) | 26,081 (2.2) | 11,009 (1.9) |
| CV% | 52.7 | 56.4 | 89.4 | 72.3 | |
| AUC0–τ, h·ng/mL | Geometric mean (SD) | 6,467 (1.9) | 10,446 (1.5) | 9,183 (1.3) | 5,941 (2.0) |
| CV% | 71.7 | 45.6 | 27.6 | 81.0 | |
| Cmin, ng/mL | Geometric mean (SD) | 180 (1.7) | 248 (1.8) | 275 (1.6) | 140 (2.0) |
| CV% | 60.2 | 61.8 | 48.7 | 77.6 | |
| Accumulation ratio | Geometric mean (SD) | 1.42 (1.6) | 1.84 (1.4) | 2.08 (1.4) | 1.49 (1.5) |
| CV% | 52.4 | 33.1 | 33.7 | 42.2 | |
| t1/2, h | Geometric mean (SD) | 29.7 (1.4) | 22.0 (1.2) | 37.6 (2.0) | 22.4 (1.3) |
| CV% | 31.9 | 16.5 | 77.7 | 27.3 | |
| Vz/F, L | Geometric mean (SD) | 995 (2.5) | 455 (1.5) | 886 (1.8) | 816 (2.4) |
| CV% | 112.9 | 39.2 | 61.5 | 107.7 | |
| CL/F, L/h | Geometric mean (SD) | 23.2 (1.9) | 14.4 (1.5) | 16.3 (1.3) | 25.3 (2.0) |
| CV% | 71.7 | 45.6 | 27.6 | 81.0 |
One participant withdrew from the mild hepatic‐impairment group due to vomiting on Day 1 and was excluded from the PK analysis. AUC0–∞, area under the concentration‐time curve from time zero to infinity; AUC0–τ, area under the concentration‐time curve over the dosing interval; CL/F, apparent total body clearance; Cmax, plasma cenicriviroc maximum concentration; Cmin, plasma cenicriviroc minimum concentration; CV, coefficient of variation; N, number of participants; PK, pharmacokinetic; SD, standard deviation; t1/2, elimination half‐life; Tmax, time to reach the maximum concentration; Vz/F, apparent volume of distribution.
The geometric mean ratios (GMRs) and 90% CIs were calculated for cenicriviroc AUC0–τ, Cmax, and Cmin (Table 3). Participants with mild HI had cenicriviroc exposures ∼38% (AUC0–τ; GMR: 0.62; 90% CI: 0.38, 1.02), 40% (Cmax; GMR: 0.60; 90% CI: 0.37, 0.96), and 27% (Cmin; GMR: 0.73; 90% CI: 0.43, 1.23) lower than those of matched controls; but exposures varied substantially among them. However, those with moderate HI had cenicriviroc exposures ∼55% (AUC0–τ; GMR: 1.55; 90% CI: 0.97, 2.46), 29% (Cmax; GMR: 1.29; 90% CI: 0.83, 2.03), and 97% (Cmin; GMR: 1.97; 90% CI: 1.21, 3.21) higher than those of matched controls.
Table 3.
Geometric mean exposure ratios of cenicriviroc (150 mg once daily) on Day 14a
| Mild hepatic impairment (N = 7)a | Matched controls (mild) (N = 7) | Geometric mean ratio mild/normal (90% CI) | Moderate hepatic impairment (N = 8) | Matched controls (moderate) (N = 8) | Geometric mean ratio moderate/normal (90% CI) | |
|---|---|---|---|---|---|---|
| AUC0–τ, h·ng/mL | 6,467 | 10,446 | 0.62 (0.38–1.02) | 9,183 | 5,941 | 1.55 (0.97–2.46) |
| Cmax, ng/mL | 452 | 759 | 0.60 (0.37–0.96) | 607 | 469 | 1.29 (0.83–2.03) |
| Cmin, ng/mL | 180 | 248 | 0.73 (0.43–1.23) | 275 | 140 | 1.97 (1.21–3.21) |
One participant withdrew from the mild hepatic impairment group due to vomiting on Day 1 and was excluded from the PK analysis. AUC0–τ, area under the concentration‐time curve over the dosing interval; CI, confidence interval; Cmax, plasma cenicriviroc maximum concentration; Cmin, plasma cenicriviroc minimum concentration; N, number of participants; PK, pharmacokinetic.
Participants with HI had a numerically prolonged t1/2 and higher Vz/F compared with matched controls (Table 2). The geometric mean (CV%) t1/2 was 29.7 h (31.9) and 22.0 h (16.5) in participants with mild HI and matched controls (mild), respectively, and 37.6 h (77.7) and 22.4 h (27.3) in those with moderate HI and matched controls (moderate), respectively. Apparent CL/F was numerically higher in participants with mild HI compared with mild controls (mild), while the opposite trend was observed in the moderate HI cohort.
The geometric mean (CV%) accumulation ratio (Day 14 AUC0–τ/Day 1 AUC0–τ) was less than twofold in participants with mild HI and matched controls (mild) (1.42 (52.4) and 1.84 (33.1), respectively) (Table 2). In those with moderate HI, a geometric mean (CV%) accumulation ratio was observed that was numerically higher than in matched controls (moderate) (2.08 (33.7) and 1.49 (42.2), respectively). Based on these, the effective half‐life (CV%) of cenicriviroc in participants with mild HI is 13.7 h (52.4), matched controls (mild) 21.2 h (33.1), moderate HI 25.4 h (33.7), and matched controls (moderate) 15.0 h (42.2).
Overall, cenicriviroc exposures were not increased in participants with mild HI compared with those in matched controls (mild). In patients with moderate HI, cenicriviroc exposures were increased, based on Cmin, Cmax, AUC0–τ, AUC0–∞, ratio of the geometric means, compared with those in matched controls (moderate).
Safety and tolerability
Cenicriviroc was well tolerated, regardless of HI (Table 4). No safety concerns were identified in participants with HI and no notable differences in AEs were observed either among or between cohorts and matched controls. Headache and gastrointestinal disorders (dry mouth, epigastric discomfort, flatulence) were the only AEs reported in at least two participants and were of mild severity.
Table 4.
Incidence of treatment‐related AEs reported by study participants
| N (%) | Mild hepatic impairment (N = 8) | Matched controls (mild) (N = 7) | Moderate hepatic impairment (N = 8) | Matched controls (moderate) (N = 8) |
|---|---|---|---|---|
| Treatment‐related AEs | ||||
| Participants with any AEs | 6 (75.0) | 3 (42.9) | 4 (50.0) | 4 (50.0) |
| Grade 1 | 6 (75.0) | 3 (42.9) | 4 (50.0) | 4 (50.0) |
| Grade 2 | 0 (0) | 0 (0) | 0 (0) | 0 (0) |
| Grade 3 | 0 (0) | 0 (0) | 1 (12.5) | 0 (0) |
| Grade 4 | 0 (0) | 0 (0) | 0 (0) | 0 (0) |
| Treatment‐related AEs observed in ≥2 participants | ||||
| Headache | 3 (3.75) | 1 (14.3) | 1 (12.5) | 1 (12.5) |
| Dry mouth | 0 (0) | 2 (28.6) | 0 (0) | 0 (0) |
| Epigastric discomfort | 1 (12.5) | 0 (0) | 1 (12.5) | 0 (0) |
| Flatulence | 1 (12.5) | 0 (0) | 0 (0) | 1 (12.5) |
AE, adverse event; N, number of participants.
All AEs were mild (Grade 1) in intensity, except a severe (Grade 3) AE of “abnormal liver function test” in a moderately impaired participant with a history of cirrhosis and HCV infection (≥18 years since diagnosis). ALT and AST increased from Grade 2 at baseline (2.8 and 3.2 x ULN, respectively) to Grade 3 on Day 10 (5.3 and 5.5 x ULN, respectively), and both returned to Grade 2 the next day. The participant completed the study without dosing interruption. One participant in the mild HI group withdrew from the study after the first cenicriviroc dose, due to an AE of mild vomiting.
Another participant with moderate HI and a history of HCV infection and cirrhosis (≥20 years since diagnosis) had Grade 3 or 4 liver enzyme abnormalities, which were not reported as AEs by the investigator (Grade 2 ALT at baseline (2.9 x ULN) elevated to Grade 3 (5.1 x ULN) on Day 14; Grade 3 AST at screening (5.9 x ULN) elevated to Grade 4 (10.2 x ULN) at Day 28; by Day 36, ALT levels returned to Grade 2 and AST to Grade 3). One matched control (moderate) had a treatment‐emergent Grade 1 AST elevation on Day 7 (1.3 x ULN), which resolved upon continued cenicriviroc dosing. No other clinically relevant changes were observed in laboratory tests, vital signs, or electrocardiogram parameters.
Biomarker analysis
Cenicriviroc CCR2/CCR5 antagonist activity
The effects of cenicriviroc treatment on CCR2 ligand (CCL2) and CCR5 ligands (CCL3, CCL4, and CCL5) were assessed to determine its antagonistic activity. CCL2 and CCL4 increased rapidly and significantly by Days 7 and 14 across all groups, suggesting potent CCR2 and CCR5 blockade (all P < 0.05 vs. Day 1 [predose]) (Figure 2). Compared with Day 1 (predose), CCL2 increased by a median fold‐change of 4.4–5.5 across all groups by Day 7 (all P < 0.05) and 4.8–6.0 by Day 14 (all P < 0.05). Similarly, CCL4 increased by a median fold‐change of 1.8–2.3 and 1.6–2.5 after 7 and 14 days of treatment, respectively (all P < 0.05). Higher CCL2 levels correlated with higher cenicriviroc median Cmax (r = 0.39; P < 0.05).
Figure 2.
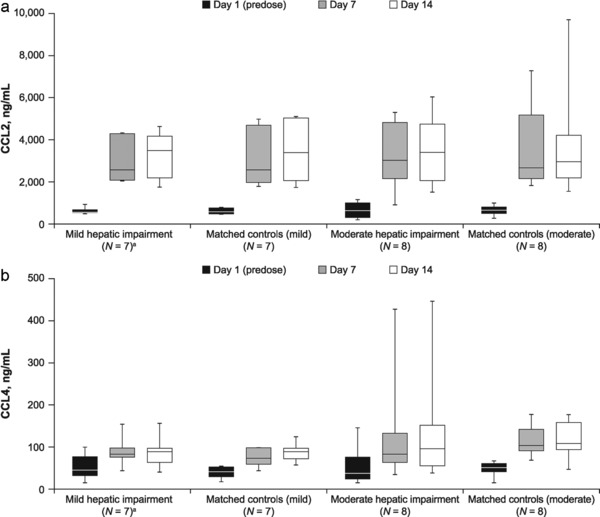
(a) CCL2 levels on Days 1 (predose), 7, and 14 of cenicriviroc treatment; (b) CCL4 levels on Days 1 (predose), 7, and 14 of cenicriviroc treatment. aOne participant withdrew from the mild hepatic impairment group due to vomiting on Day 1 and was excluded from the PK analysis. CCL2, C‐C chemokine ligand type 2; CCL4, C‐C chemokine ligand type 4; IQR, interquartile range; N, number of participants; PK, pharmacokinetic.
CCL5 increased significantly during cenicriviroc treatment in matched controls (moderate) only (P = 0.008; Day 14 vs. Day 1), but CCL3 levels did not change significantly in any group. Thus, cenicriviroc quickly and substantially blocked CCR2 and CCR5.
Effects of cenicriviroc on proinflammatory cytokines
To determine whether the reciprocal increase in CCL2, CCL4, and CCL5 levels associated with the potent CCR2 and CCR5 blockade increased systemic inflammation, levels of proinflammatory cytokines were measured. IL‐6, TNF‐α, and IL‐1β levels did not change significantly in any group during cenicriviroc treatment (Supplementary Figure S1). However, participants with moderate HI had significantly higher levels of IL‐6 on Day 7 (P < 0.05) and Day 14 (P < 0.01), and significantly lower levels of TGF‐β on Day 1 (P < 0.05), Day 7 (P < 0.01), and Day 14 (P < 0.05) compared with those in matched controls (moderate). Although TGF‐β levels increased in the moderate HI group during cenicriviroc treatment (Day 1 vs. Day 14; P < 0.01), levels at Day 14 were not significantly different from those in the mild HI and matched controls (mild) groups. Therefore, it was concluded that cenicriviroc did not increase systemic inflammatory markers.
Effects of cenicriviroc on biomarkers of intestinal permeability and bacterial translocation
As cenicriviroc decreased sCD14 levels in HIV‐positive participants (Study 202),27 markers of intestinal permeability (I‐FABP) and bacterial translocation (flagellin, LBP, sCD14) were measured in this population. None of these markers changed significantly within each group during cenicriviroc treatment (Supplementary Figure S2); however, participants with moderate HI had higher levels of flagellin, LBP, and I‐FABP compared with matched controls (moderate). These differences only reached statistical significance at Day 14 (flagellin: 4.80 vs. 0.40 ng/mL; LBP: 31.1 vs. 23.8 ng/mL; I‐FABP: 2887 vs. 1061 pg/mL; all P < 0.05). Flagellin levels correlated with I‐FABP and ALT at Day 1 (rs = 0.44 and rs = 0.41, respectively; all P < 0.05) and Day 14 (rs = 0.40 and rs = 0.45, respectively; all P < 0.05) (Figure 3). Thus, cenicriviroc did not have an effect on biomarkers reflecting bacterial translocation in this 14‐day study.
Figure 3.
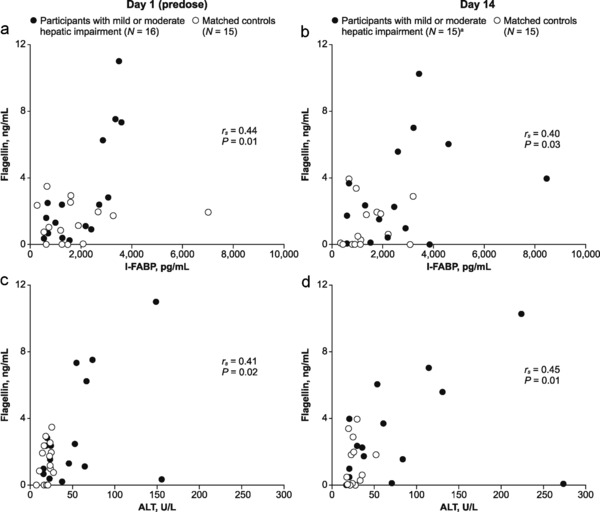
Correlation between flagellin and (a) I‐FABP at Day 1 (predose); (b) I‐FABP at Day 14; (c) ALT at Day 1 (predose); (d) ALT at Day 14, in participants with hepatic impairment and matched controls. aOne participant withdrew from the mild hepatic impairment group due to vomiting on Day 1 and was not included in the Day 14 analysis. ALT, alanine aminotransferase; I‐FABP, intestinal fatty acid binding protein; N, number of participants.
DISCUSSION
This study evaluated the impact of HI on the PK and safety of cenicriviroc. Following once‐daily administration of cenicriviroc 150 mg over 14 days, moderate HI, but not mild HI, increased cenicriviroc's exposures. Time to achieve steady‐state concentration was slightly delayed in participants with HI compared with their matched controls. Over 14 days of dosing in all participants, single‐tablet cenicriviroc 150 mg (current phase II formulation) achieved mean plasma concentrations comparable to or higher than those previously observed at Day 14 in HIV‐positive participants receiving 200 mg (previous formulation; PK substudy of Study 202).34 Exploratory analyses to evaluate pharmacodynamic effects of cenicriviroc on CCR2 and CCR5 ligands, proinflammatory cytokines, and bacterial translocation biomarkers did not reveal any meaningful differences between subjects with normal hepatic function and HI, although effects of cenicriviroc unbound fraction could not be assessed. Furthermore, cenicriviroc was generally well tolerated, with AEs consistent with its known safety profile. Of note, most study participants with HI had a history of viral hepatitis or alcohol abuse. It is unknown whether disease etiology may lead to differences in the effects of HI on a drug's PK; however, this study followed the FDA guidance and used Child–Pugh classification for categorizing the degree of HI in patients.33
Cenicriviroc treatment resulted in rapid and reciprocal increases in the ligands CCL2 and CCL4, suggesting potent and durable CCR2/CCR5 blockade, in participants with HI and normal hepatic function, similar to the findings observed in HIV‐positive participants (Study 202).27 Of note, the dose‐ and concentration‐dependent effects of cenicriviroc on CCL2 levels were sustained throughout the 48‐week duration of Study 202, suggesting that cenicriviroc can provide long‐term blocking of CCR2.27 Despite these increases, no significant effects on markers of hepatic inflammation, proinflammatory cytokines, or biomarkers of bacterial translocation were observed in any cohort. Soluble CD14 levels did not change in participants with HI over 14 days, in contrast to the relative reduction in sCD14 levels observed in HIV‐positive participants treated for 48 weeks.27 The difference in these findings may be due to the longer “on treatment” time or to factors specific to the HIV‐positive participants.35 The correlation of increased circulating flagellin levels, with raised I‐FABP and ALT levels suggests an association of hepatic inflammation with impaired gut integrity and increased bacterial translocation.36
PK and safety data from this study suggest that cenicriviroc 150 mg can be used in patients with mild or moderate HI. Although the prevalence of HI in patients with NASH is unknown, several studies have shown that a substantial proportion of patients with NAFLD or NASH may also be suffering from liver fibrosis or cirrhosis, and likely HI.5, 37, 38 Ongoing studies will evaluate the efficacy, safety, and PK of cenicriviroc in patients with NASH and mild‐to‐severe liver fibrosis.30
Author Contributions
E.L., M.G., W.C., M.W., P.F.S., A.S., and N.S.U. wrote the article; E.L., M.G., W.C., P.F.S., A.S., and N.S.U. designed the research; E.L., M.G., A.S., N.S.U., and K.L. performed the research; E.L., M.G., M.W., P.F.S., A.S., and N.S.U. analyzed the data; A.S. and N.S.U. contributed new reagents/analytical tools.
Conflicts of Interest
E.L., M.G., and W.C. are full‐time employees of Tobira Therapeutics, Inc. K.L., M.W., and P.F.S. were consultants to Tobira Therapeutics, Inc., for this study. A.S. has no conflict of interest to declare. N.S.U. is a scientific consultant for Tobira Therapeutics, Inc., and has received honoraria and in‐kind contributions from Tobira Therapeutics, Inc.
Supporting information
Disclaimer: Supplementary materials have been peer‐reviewed but not copyedited.
Supplementary Table 1 Summary of PK parameters on Day 1 following administration of cenicriviroc 150 mga
Supplementary Figure S1 Median levels of (A) IL‐6; (B) TGF‐β; (C) IL‐1β; (D) TNF‐α, on Days 1 (predose), 7, and 14. aOne participant withdrew from the mild hepatic impairment group due to vomiting on Day 1 and was not included in the analysis; bParticipants with mild hepatic impairment, matched controls (mild) and matched controls (moderate) had the same levels of IL‐1β at Days 1 (predose), 7, and 14.*P < 0.05 (moderate hepatic impairment vs. matched controls (moderate)); **P < 0.01 (moderate hepatic impairment vs. matched controls (moderate)); † P < 0.01 (moderate hepatic impairment group, Day 1 vs. Day 14). IL, interleukin; IQR, interquartile range; TGF, tumor growth factor; TNF, tumor necrosis factor.
Supplementary Figure S2 Median levels of (A) flagellin; (B) LBP; (C) I‐FABP; (D) sCD14, on Days 1 (predose), 7, and 14. aOne participant withdrew from the mild hepatic impairment group due to vomiting on Day 1 and was not included in the analysis. *P < 0.05 (moderate hepatic impairment vs. matched controls (moderate)). I‐FABP, intestinal fatty acid binding protein; IQR, interquartile range; LBP, lipopolysaccharide binding protein; N, number of participants; sCD14, soluble CD14.
Acknowledgments
This work was supported by Tobira Therapeutics, Inc. Medical writing support was provided by Camille Bonomelli of Alpharmaxim Healthcare Communications and was funded by Tobira Therapeutics, Inc. The authors thank Maitreyee Nigalye, who assisted with intestinal permeability and bacterial translocation assays, and Minh Afaga, who monitored the study. We thank the study volunteers for their participation.
References
- 1. Vernon, G. , Baranova, A. & Younossi, Z.M. Systematic review: the epidemiology and natural history of non‐alcoholic fatty liver disease and non‐alcoholic steatohepatitis in adults. Aliment. Pharmacol. Ther. 34, 274–285 (2011). [DOI] [PubMed] [Google Scholar]
- 2. Zhang, Q.Q. & Lu, L.G. Nonalcoholic fatty liver disease: dyslipidemia, risk for cardiovascular complications, and treatment strategy. J. Clin. Transl. Hepatol. 3, 78–84 (2015). [DOI] [PMC free article] [PubMed] [Google Scholar]
- 3. Chalasani, N. et al The diagnosis and management of non‐alcoholic fatty liver disease: practice guideline by the American Association for the Study of Liver Diseases, American College of Gastroenterology, and the American Gastroenterological Association. Am. J. Gastroenterol. 107, 811–826 (2012). [DOI] [PubMed] [Google Scholar]
- 4. Matteoni, C.A. et al Nonalcoholic fatty liver disease: a spectrum of clinical and pathological severity. Gastroenterology 116, 1413–1419 (1999). [DOI] [PubMed] [Google Scholar]
- 5. Mittal, S. et al Hepatocellular carcinoma in the absence of cirrhosis in United States veterans is associated with nonalcoholic fatty liver disease. Clin. Gastroenterol. Hepatol. 14, 124–131 (2016). [DOI] [PMC free article] [PubMed] [Google Scholar]
- 6. Wong, R.J. et al Nonalcoholic steatohepatitis is the second leading etiology of liver disease among adults awaiting liver transplantation in the United States. Gastroenterology 148, 547–555 (2015). [DOI] [PubMed] [Google Scholar]
- 7. Wree, A. , Broderick, L. , Canbay, A. , Hoffman, H.M. & Feldstein, A.E. From NAFLD to NASH to cirrhosis—new insights into disease mechanisms. Nat. Rev. Gastroenterol. Hepatol. 10, 627–636 (2013). [DOI] [PubMed] [Google Scholar]
- 8. Ratziu, V. , Goodman, Z. & Sanyal, A. Current efforts and trends in the treatment of NASH. J. Hepatol. 62, S65–S75 (2015). [DOI] [PubMed] [Google Scholar]
- 9. Seki, E. et al CCR1 and CCR5 promote hepatic fibrosis in mice. J. Clin. Invest. 119, 1858–1870 (2009). [DOI] [PMC free article] [PubMed] [Google Scholar]
- 10. Seki, E. et al CCR2 promotes hepatic fibrosis in mice. Hepatology 50, 185–197 (2009). [DOI] [PMC free article] [PubMed] [Google Scholar]
- 11. Karlmark, K.R. et al Hepatic recruitment of the inflammatory Gr1+ monocyte subset upon liver injury promotes hepatic fibrosis. Hepatology 50, 261–274 (2009). [DOI] [PubMed] [Google Scholar]
- 12. Miura, K. , Yang, L. , van Rooijen, N. , Ohnishi, H. & Seki, E. Hepatic recruitment of macrophages promotes nonalcoholic steatohepatitis through CCR2. Am. J. Physiol. Gastrointest. Liver Physiol. 302, G1310–G1321 (2012). [DOI] [PMC free article] [PubMed] [Google Scholar]
- 13. Pradere, J.P. et al Hepatic macrophages but not dendritic cells contribute to liver fibrosis by promoting the survival of activated hepatic stellate cells in mice. Hepatology 58, 1461–1473 (2013). [DOI] [PMC free article] [PubMed] [Google Scholar]
- 14. Rivera, C.A. et al Attenuation of CCl(4)‐induced hepatic fibrosis by GdCl(3) treatment or dietary glycine. Am. J. Physiol. Gastrointest. Liver Physiol. 281, G200–G207 (2001). [DOI] [PubMed] [Google Scholar]
- 15. Duffield, J.S. et al Selective depletion of macrophages reveals distinct, opposing roles during liver injury and repair. J. Clin. Invest. 115, 56–65 (2005). [DOI] [PMC free article] [PubMed] [Google Scholar]
- 16. Bataller, R. & Brenner, D.A. Liver fibrosis. J. Clin. Invest. 115, 209–218 (2005). [DOI] [PMC free article] [PubMed] [Google Scholar]
- 17. De Minicis, S. et al Gene expression profiles during hepatic stellate cell activation in culture and in vivo. Gastroenterology 132, 1937–1946 (2007). [DOI] [PubMed] [Google Scholar]
- 18. Seki, E. et al TLR4 enhances TGF‐beta signaling and hepatic fibrosis. Nat. Med. 13, 1324–1332 (2007). [DOI] [PubMed] [Google Scholar]
- 19. Xiao, Y. et al Over‐activation of TLR5 signaling by high‐dose flagellin induces liver injury in mice. Cell Mol. Immunol. 12, 729–742 (2015). [DOI] [PMC free article] [PubMed] [Google Scholar]
- 20. Brichacek, B. et al Contrasting roles for TLR ligands in HIV‐1 pathogenesis. PLoS One 5, e12831 (2010). [DOI] [PMC free article] [PubMed] [Google Scholar]
- 21. Friedman, S.L. et al Anti‐fibrotic activity of oral, dual CCR2 and CCR5 antagonist cenicriviroc in a mouse model of NASH and a rat model of TAA‐induced liver fibrosis. Presented at HEP DART 2013, Frontiers in Drug Development for Viral Hepatitis, Hawaii, USA (2013).
- 22. Hong, F. , Chou, H. & Friedman, S.L. Significant anti‐fibrotic activity of cenicriviroc, a dual CCR2/CCR5 antagonist, in a rat model of thioacetamide‐induced liver fibrosis and cirrhosis. Hepatology 58, 1381A–1382A (2013). [Google Scholar]
- 23. Lefebvre, E. et al Anti‐fibrotic and anti‐inflammatory activity of the dual CCR2 and CCR5 antagonist cenicriviroc in a mouse model of NASH. Hepatology 58, 221A–222A (2013). [Google Scholar]
- 24. Moyle, G. et al Antifibrotic activity of dual CCR5/CCR2 antagonist cenicriviroc in a mouse model of renal fibrosis. Presented at 20th International AIDS Conference (AIDS 2014), Melbourne, Australia (2014).
- 25. Tacke, F. , Poulin, D. , Jenkins, H. , Wolfgang, G. & Lefebvre, E . Oral, dual CCR2/CCR5 antagonist, cenicriviroc, leads to dose‐dependent decreases in monocyte recruitment in a thioglycollate‐induced model of peritonitis. Presented at AASLD and Industry Colloquium: Novel Targets and Therapies in Liver Disease, Durham, NC, USA (2015).
- 26. Krenkel, O. et al CCR2+ infiltrating monocytes promote acetaminophen‐induced acute liver injury ‐ therapeutic implications of inhibiting CCR2 and CCL2. J. Hepatol. 62, S206 (2015). [Google Scholar]
- 27. Thompson, M. et al A 48‐week randomized Phase 2b study evaluating cenicriviroc vs. efavirenz in treatment‐naive HIV‐infected adults with CCR5‐tropic virus. AIDS 30, 869–878 (2016). [DOI] [PMC free article] [PubMed] [Google Scholar]
- 28. Thompson, M. et al Improvements in APRI and FIB‐4 fibrosis scores correlate with decreases in sCD14 in HIV‐1 infected adults receiving cenicriviroc over 48 weeks. Hepatology 60, 424A (2014). [Google Scholar]
- 29. Sherman, K.E. , Abdel‐Hameed, E. & Rouster, S.D. CCR2/CCR5 antagonism with cenicriviroc decreases fibrosis scores in HIV‐infected patients. Presented at HEP DART 2015, Frontiers in Drug Development for Viral Hepatitis, Hawaii, USA (2015).
- 30. Friedman, S.L. et al Efficacy and safety study of cenicriviroc for the treatment of non‐alcoholic steatohepatitis in adult subjects with liver fibrosis: CENTAUR Phase 2b study design. Contemp. Clin. Trials 40, 356–365 (2016). [DOI] [PubMed] [Google Scholar]
- 31. Kolwankar, D. et al Association between nonalcoholic hepatic steatosis and hepatic cytochrome P‐450 3A activity. Clin. Gastroenterol. Hepatol. 5, 388–393 (2007). [DOI] [PubMed] [Google Scholar]
- 32. Verbeeck, R.K. Pharmacokinetics and dosage adjustment in patients with hepatic dysfunction. Eur. J. Clin. Pharmacol. 64, 1147–1161 (2008). [DOI] [PubMed] [Google Scholar]
- 33. U.S. Food and Drug Administration (FDA) , Center for Drug Evaluation and Research (CDER), and Center for Biologics Evaluation and Research (CBER). Guidance for Industry. Pharmacokinetics in patients with impaired hepatic function: Study design, data analysis, and impact on dosing and labeling. http://www.fda.gov/downloads/drugs/guidancecomplianceregulatoryinformation/guidances/ucm072123.pdf (2003).
- 34. Tobira Therapeutics, Inc. Data on file. Study 652‐2‐202. Clinical Study Report Week 48 Final Analysis. (2013).
- 35. Siedner, M.J. et al Persistent Immune Activation and Carotid Atherosclerosis in HIV‐Infected Ugandans Receiving Antiretroviral Therapy. J. Infect. Dis. 213, 370–378 (2016). [DOI] [PMC free article] [PubMed] [Google Scholar]
- 36. Wiest, R. , Lawson, M. & Geuking, M. Pathological bacterial translocation in liver cirrhosis. J. Hepatol. 60, 197–209 (2014). [DOI] [PubMed] [Google Scholar]
- 37. Angulo, P. et al Liver Fibrosis, but No Other Histologic Features, Is Associated With Long‐term Outcomes of Patients With Nonalcoholic Fatty Liver Disease. Gastroenterology 149, 389–397 (2015). [DOI] [PMC free article] [PubMed] [Google Scholar]
- 38. Wong, R.J. , Cheung, R. & Ahmed, A. Nonalcoholic steatohepatitis is the most rapidly growing indication for liver transplantation in patients with hepatocellular carcinoma in the U.S. Hepatology 59, 2188–2195 (2014). [DOI] [PubMed] [Google Scholar]
Associated Data
This section collects any data citations, data availability statements, or supplementary materials included in this article.
Supplementary Materials
Disclaimer: Supplementary materials have been peer‐reviewed but not copyedited.
Supplementary Table 1 Summary of PK parameters on Day 1 following administration of cenicriviroc 150 mga
Supplementary Figure S1 Median levels of (A) IL‐6; (B) TGF‐β; (C) IL‐1β; (D) TNF‐α, on Days 1 (predose), 7, and 14. aOne participant withdrew from the mild hepatic impairment group due to vomiting on Day 1 and was not included in the analysis; bParticipants with mild hepatic impairment, matched controls (mild) and matched controls (moderate) had the same levels of IL‐1β at Days 1 (predose), 7, and 14.*P < 0.05 (moderate hepatic impairment vs. matched controls (moderate)); **P < 0.01 (moderate hepatic impairment vs. matched controls (moderate)); † P < 0.01 (moderate hepatic impairment group, Day 1 vs. Day 14). IL, interleukin; IQR, interquartile range; TGF, tumor growth factor; TNF, tumor necrosis factor.
Supplementary Figure S2 Median levels of (A) flagellin; (B) LBP; (C) I‐FABP; (D) sCD14, on Days 1 (predose), 7, and 14. aOne participant withdrew from the mild hepatic impairment group due to vomiting on Day 1 and was not included in the analysis. *P < 0.05 (moderate hepatic impairment vs. matched controls (moderate)). I‐FABP, intestinal fatty acid binding protein; IQR, interquartile range; LBP, lipopolysaccharide binding protein; N, number of participants; sCD14, soluble CD14.