

Abstract
Vitamin A, via retinoic acid (RA), is a critical micronutrient. Normally, plasma concentrations are tightly regulated. Concentrations of vitamin A metabolites (13cis‐RA, atRA) and relationships between RBP4 and retinoids have never been fully evaluated in adult patients with CKD. We measured retinoid and RBP4 concentrations in plasma and urine from 55 adult patients with CKD and 21 matched healthy subjects. RBP4 and retinol levels were increased approximately twofold in patients with CKD, with a negative correlation between plasma retinol and eGFR (p = 0.006) and plasma RBP4 and eGFR (p = 0.0007). RBP4 renal clearance was higher in patients with CKD than healthy subjects but not associated with eGFR. Circulating concentrations of atRA increased and concentrations of 13cis‐RA decreased in subjects with CKD with no change in RA‐to‐retinol ratio. Increases in circulating retinol, RBP4, and atRA may be due to increased hepatic RBP4 synthesis, retinyl ester hydrolysis, and/or hepatic secretion of RBP4‐retinol.
Study Highlights
WHAT IS THE CURRENT KNOWLEDGE ON THE TOPIC?
✓ Vitamin A, via RA, is a critical micronutrient. In healthy individuals, plasma concentrations are tightly regulated. Elevated vitamin A and carrier protein RBP4 levels have been observed in CKD and related complications.
WHAT QUESTION DID THIS STUDY ADDRESS?
✓ We measured retinoid and RBP4 concentrations in plasma and urine from patients and matched healthy subjects in order to assess the concentrations of vitamin A metabolites (13cis‐RA, atRA), and the relationships between RBP4 and retinoids in adults with CKD.
WHAT THIS STUDY ADDS TO OUR KNOWLEDGE?
✓ We have shown that increases in circulating retinol, RBP4, and atRA may be due to increased hepatic RBP4 synthesis, retinyl ester hydrolysis, and/or hepatic secretion of RBP4‐retinol.
HOW THIS MIGHT CHANGE CLINICAL PHARMACOLOGY OR TRANSLATIONAL SCIENCE?
✓ This study highlights the necessity to redefine CKD not as an isolated disease, but as a global condition that affects many organ systems.
Chronic kidney disease (CKD) is associated with a higher incidence of cardiovascular disease and diabetes, and lower bone mineral density.1 Inability to biologically access critical micronutrients may play a role in the development and progression of these comorbid conditions in patients with CKD. This association has been well‐established for vitamin D, a fat‐soluble micronutrient that requires bioactivation by the kidney in order to regulate circulating levels of calcium and phosphorous.2 Circulating concentrations of vitamin A (which includes retinol and retinyl esters) and vitamin A metabolites, particularly bioactive all‐trans retinoic acid (atRA), essential for cellular maintenance, gene regulation, lipid metabolism, and inflammatory response, also seem to be altered in patients with CKD.3, 4, 5 The inability to regulate the bioactivation or transport of vitamin A to target tissues has been associated with fracture risk,6 atherosclerosis/cardiovascular disease,7 and diabetes,8 and may contribute to development of these comorbidities in patients with CKD.
In healthy individuals, circulating concentrations of retinol, atRA, and retinol binding protein 4 (RBP4) are tightly regulated with plasma concentrations varying less than 20%, 23%, and 3%, respectively, in the healthy population.9, 10 Vitamin A is obtained from the diet either as provitamin A carotenoids or as preformed vitamin A (Figure 1), the plasma concentrations of retinol and retinoic acids (RAs) are regulated by a complement of enzymes that are responsible for storing and remobilizing vitamin A in the liver and synthesizing RA from the retinol precursor in a tightly controlled manner. In adults with CKD, serum concentrations of RBP4 and retinol have been reported to be elevated but it is unclear whether kidney disease itself or CKD‐related comorbidities cause altered vitamin A homeostasis.3, 4, 11, 12 In pediatric subjects with CKD, but without commonly occurring adult comorbidities (e.g., diabetes and hypertension), circulating concentrations of retinol, its metabolites, and carrier proteins are dysregulated, suggesting that decreased kidney function, and not the presence of other medical conditions, is the primary driver of altered vitamin A homeostasis.5 Despite this, the role of the kidneys in regulating vitamin A homeostasis is uncharacterized and, therefore, in contrast to the well understood mechanisms of how CKD decreases the active metabolite of vitamin D, the mechanisms by which decreased kidney function alters vitamin A homeostasis, and the concentrations of these tightly regulated compounds are completely unknown. The observed accumulation of circulating RBP4 and retinol in patients with CKD might be explained by the impaired ability of the kidneys to excrete RBP4 and retinol by decreased metabolism of retinol to its active metabolite, atRA, or by activation of a yet uncharacterized renal‐hepatic signaling pathway resulting in increased hepatic synthesis and secretion of RBP4 with accompanying mobilization of retinol from hepatic stores. We hypothesize that circulating concentrations of RBP4, retinol, and atRA are elevated in subjects with CKD due to alterations in hepatic mechanisms of retinoid regulation. Thus, the objectives of this study were to evaluate circulating vitamin A, atRA, and RBP4 in individuals with CKD in comparison with matched healthy adults and to differentiate the role of altered renal clearance and hepatic metabolic processes in driving altered vitamin A homeostasis in CKD.
Figure 1.
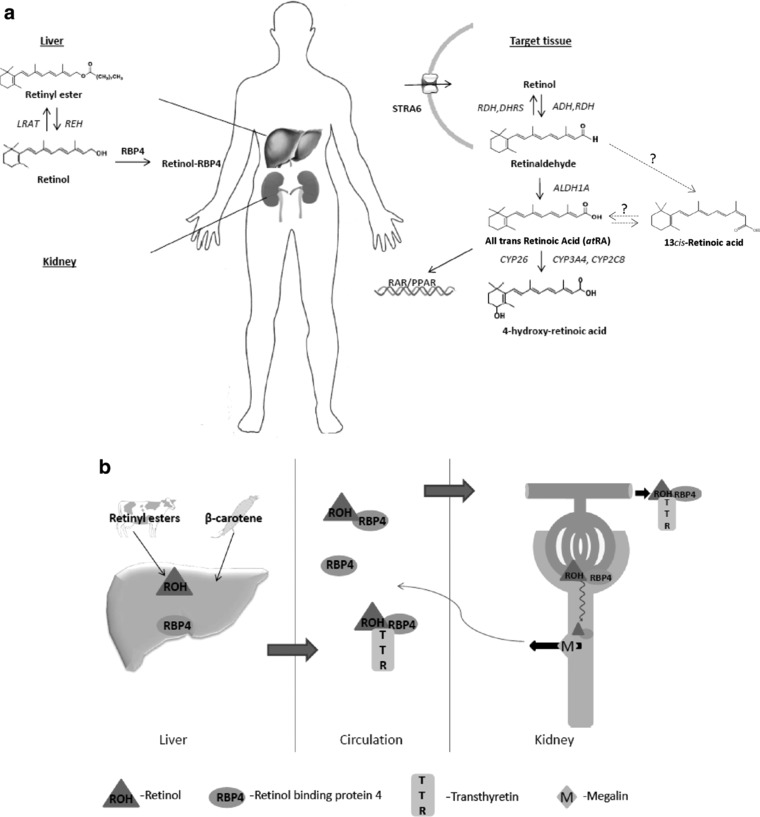
(a) In the liver, the esterification of retinol and the hydrolysis of the stored esters are regulated by lecithin retinol acyltransferase (LRAT) and retinyl ester hydrolase (REH), respectively. Circulating retinol is delivered to target tissues by retinol binding protein 4 (RBP4) and transthyretin (TTR, not shown) and retinol is taken up into target cells by uptake transporter STRA6. In target tissues, retinol is oxidized to retinaldehyde (retinal) by alcohol dehydrogenase (ADH) or retinol dehydrogenase (RDH); retinaldehyde can be reduced back to retinol by RDH and dehydrogenase reductase (DHRS). The formation of all‐trans retinoic acid (atRA) requires irreversible oxidation of retinaldehyde to atRA by aldehyde dehydrogenase 1A (ALDH1A). The clearance of retinoic acid (RA) is mediated predominantly by cytochrome P450 family 26 enzymes (CYP26). The 13cis‐RA is likely formed from retinaldehyde via an unknown intermediate or via isomerization from atRA. (b) The retinol‐RBP4 complex is filtered by the kidneys; the retinol‐RBP4‐TTR complex is too large for filtration. The filtered retinol‐RBP4 complex is reabsorbed in the proximal tubule cells by megalin.
METHODS
Study population
The study population comprising of 55 patients with CKD and 21 matched healthy subjects was obtained from the Seattle Kidney Study or Healthy Kidney Study.13 The Seattle Kidney Study is a nephrology clinic‐based prospective cohort study of patients with CKD based in Seattle, WA, USA, designed to evaluate long‐term complications of CKD. Healthy subjects were matched to these subjects based on gender, age, and body mass index (BMI; ±10%). Institutional review boards at the University of Washington and Veterans Affairs Puget Sound Health Care System approved the Seattle Kidney Study and Healthy Kidney Study and all participants provided written informed consent.
Dietary vitamin a intake
Food diaries were administered to the participants in this study. These subjects received approximately 1 h of training from a dietician on how to record all dietary intake, including specific ingredients and brand names, snacks, fruits, coffee, and tea. Participants were instructed to complete the prospective diary every other day for 5 days to include at least one weekend day. Diaries were returned to the dietician who entered all recorded items into the Nutrition Data Recall System for Research software system (Minneapolis, MN, USA). Plasma and urine sample collections were obtained concurrently with the participants’ diet records.
Analytical measures
Clinical data including age, gender, race, BMI, estimated glomerular filtration rate (eGFR), urine albumin, history of diabetes mellitus, and history of dialysis were collected from the Seattle Kidney Study and Healthy Kidney Study data repository. The eGFR was determined using the serum creatinine based CKD‐EPI equation.14 Urine albumin‐to‐creatinine ratio was determined from a 12‐h urine collection. RBP4 renal clearance was calculated using the equation:
| (1) |
where is the amount of RBP4 excreted in urine in a given time t, and C is the RBP4 plasma concentration.
Bioanalytical methods
Blood and urine samples were stored at −80°C. All sample processing, preparation, and extraction were conducted on ice under red light to minimize degradation of retinoids. For retinoid measurement, 80 μl acetonitrile was added to 40 μl plasma and urine with 20 μM retinyl acetate (for retinol measurement) or 40 nM 13cis‐RA‐d5 as internal standard, and the samples were centrifuged at 3,010 × g at 4°C for 40 min. The supernatant was collected for analysis. Plasma retinol was measured with an Agilent 1200 Series HPLC System, equipped with an Agilent extend‐C18 column (5μm, 2.1 × 150 mm; Agilent Technologies), mobile phase consisting of acetonitrile/H2O/glacial acetic acid‐90/10/2 at a flow rate of 0.4 mL/min for 7.5 min. Retinol was detected at a wavelength of 325 nm. A retinol standard curve for quantification was constructed in DC MASS SPECT GOLD human serum (Golden West Biologicals, Temecula, CA, USA) at concentrations of 0.25–16 μM and detection was linear for this range. Retinal, atRA, and 13cis‐RA were measured by LC‐MS/MS, as described previously,15 using an AB Sciex 5500 qTrap Q‐LIT mass spectrometer (AB Sciex, Foster City, CA, USA) equipped with an Agilent 1290 UHPLC (Agilent, Santa Clara, CA, USA) and an Ascentis Express RP‐Amide column (2.7 μm, 15 cm ×2.1 mm; Sigma). Compound‐dependent mass spectrometer parameters used for detection of retinal were collision energy ‐13, collision cell exit potential ‐4, declustering potential ‐66, and entrance potential ‐10. Gradient elution with a flow rate of 0.5 mL/min using (A) H2O (B) acetonitrile with 40% methanol and 0.1% formic acid in A and B was used. The gradient was from an initial 60% A for 2 min to 5% A over 13 min and then to 60% A for 2 min. Analytes were detected using positive ion APCI mode. MS/MS transitions for retinal, atRA, 13cis‐RA, and 13cis‐RA‐d5 were m/z 285 > 161, m/z 301 > 205, m/z 301 > 205, and m/z 306 > 116. Plasma and urine RBP4 and transthyretin (TTR) were measured by enzyme‐linked immunosorbent assay kits according to the manufacturer's protocol (R&D Systems, Minneapolis, MN, USA, and Abnova, Taipei, Taiwan, respectively). RBP4 and TTR standard curves were constructed at concentrations of 0–100 ng/mL and 0–31.25 ng/mL, respectively.
Statistical analyses
Baseline characteristics were tabulated according to four categories of kidney function: CKD stages 1–2 (eGFR ≥60 mL/min/1.73 m2), CKD stages 3–5 (eGFR <60 mL/min/1.73 m2, not yet on dialysis), participants who had initiated dialysis, and healthy subjects. Descriptive statistics are presented as mean and SD or median (interquartile range [IQR]) for continuous variables and number and proportion for categorical variables. Retinoid and binding protein concentrations were reported as medians (25th and 75th percentile).
Linear regression was used to evaluate associations of kidney function and retinol and RBP4 and to estimate p values. The P for trend statistics were obtained using the Wald test for the four ordinal categories of kidney function, among all participants. Vitamin A metabolite concentrations were log‐transformed in order to examine linear associations of eGFR with the metabolites. Secondarily, analyses were stratified by diabetes status.
All p values were two‐tailed (α = 0.05). Analyses were performed using STATA (release 13.1; StataCorp, College Station, TX, USA) or Prism software (GraphPad, La Jolla, CA, USA).
RESULTS
Among participants with CKD, the mean (SD) eGFR was 44.18 (20.86) mL/min/1.73m2, mean age was 54.73 years, and mean BMI was 32.54 kg/m2. Similar demographics were observed in matched healthy control subjects (Table 1).
Table 1.
Demographic and clinical features of the study population
| Healthy subjects n = 21 | CKD 1–2 n = 15 | CKD 3–5 n = 30 | Dialysis n = 10 | |
|---|---|---|---|---|
| Male | 15 (72) | 9 (60) | 13 (43) | 6 (60) |
| Female | 6 (28) | 6 (40) | 17 (57) | 4 (40) |
| BMI | 28 (7) | 30 (6) | 34 (11) | 31 (6) |
| Age, y | 57 (14) | 50 (11) | 57 (8) | 54 (15) |
| White | 15 (71) | 9 (60) | 16 (53) | 2 (20) |
| African American | 4 (19) | 5 (33) | 11 (37) | 5 (50) |
| Diabetes | 6 (19) | 5 (33) | 15 (50) | 6 (60) |
| UACR median (IQR) | N/A | 25 (4–107) | 71 (12–371) | 853 (217–1,848) |
| eGFR | N/A | 71 (5) | 36 (11) | N/A |
BMI, body mass index; CKD, chronic kidney disease; eGFR, estimated glomerular filtration rate; IQR, interquartile range; N/A, not available; UACR, urine albumin‐to‐creatinine ratio.
Descriptive statistics are presented as means (SD) for continuous variables and N (%) for categorical variables except where specified.
Plasma concentrations of RBP4 (Figure 2 a,b) and retinol (Figure 2 c,d) were significantly higher as eGFR (categorized by CKD stage and as a continuous variable) declined. There was greater variability in subjects with CKD than healthy subjects; variability was highest among patients on dialysis (Table 2). In healthy subjects, the median plasma retinol binding protein (RBP) concentration was 1.3 (25th and 75th percentile 1.1, 1.5) μM (15% difference between the median and 75th percentile), whereas in patients receiving dialysis, the median RBP concentration was significantly higher, 2.9 (2.3, 5.9) μM (103% difference between median value and 75th percentile).
Figure 2.
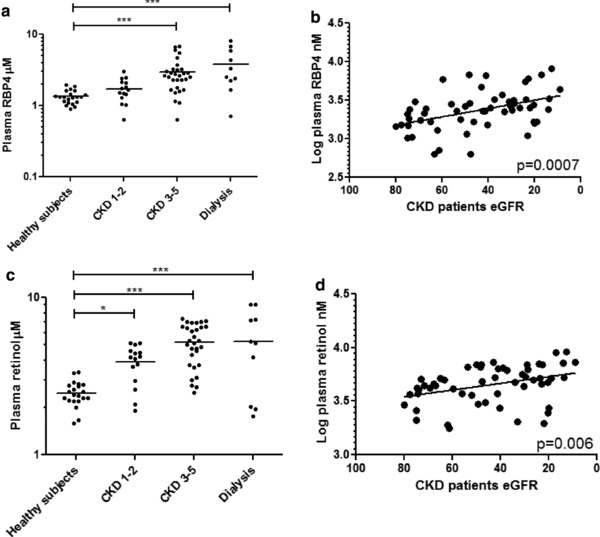
Patients with chronic kidney disease (CKD) exhibit elevated (a, b) plasma retinol binding protein 4 (RBP4) concentrations and (c, d) plasma retinol concentrations analyzed categorically by CKD stage and as continuous variables. *p ≤ 0.05; ***p ≤ 0.001.
Table 2.
Plasma retinoid and retinol binding protein concentrations (median [25th and75th percentile])
| Plasma retinol (μM) | Plasma retinal (nM) | Plasma atRA (nM) | Plasma 13 cis‐RA (nM) | Plasma total RA (nM) | Plasma RBP4 (μM) | Plasma TTR (μM) | Plasma ratio retinol:RBP4 | Plasma ratio RBP4:TTR | |
|---|---|---|---|---|---|---|---|---|---|
| Healthy subjects, n = 21 | 2.4 (2.2–2.8) | 8.2 (6.8–9.5) | 1.7 (1.4–2.1) | 4.4 (3.3–5.5) | 5.9 (5.0–7.6) | 1.3 (1.1–1.5) | 3.7 (2.9–4.6) | 1.8 (1.7–1.9) | 0.4 (0.3–0.5) |
| CKD 1–2, n = 15 | 4.2 (3.0–4.6) | 6.2 (4.9–6.7) | 4.0 (3.2–4.4) | 2.0 (1.5–2.6) | 5.8 (4.9–7.3) | 1.6 (1.3–2.1) | 3.2 (2.6–5.1) | 2.1 (1.7–2.8) | 0.5 (0.4–0.6) |
| CKD 3–5, n = 30 | 5.2 (3.7–6.6) | 6.9 (5.6–8.2) | 3.3 (2.6–3.8) | 2.0 (1.1–2.5) | 5.2 (4.1–6.5) | 2.6 (1.8–3.2) | 3.0 (2.5–5.1) | 1.9 (1.6–2.4) | 0.8 (0.5–1.0) |
| Dialysis, n = 10 | 5.2 (2.0–7.2) | 7.3 (4.1–8.5) | 3.0 (2.1–4.1) | 0.9 (0.3–1.1) | 4.6 (3.2–5.7) | 2.9 (2.2–5.9) | 2.8 (2.3–3.8) | 1.5 (0.9–2.5) | 0.8 (0.6–1.1) |
| P‐for trend | < 0.0001 | 0.013 | 0.001 | < 0.0001 | 0.006 | < 0.0001 | 0.562 | 0.776 | < 0.0001 |
| Percent difference in analyte concentration per 10 mg/mL/1.73m2 lower eGFR (beta, 95% CI), among participants with non‐dialysis CKD,a n = 45 | 6.09 (0.83–11.35) 0.024 | – | −4.28 (−9.73, 1.17) 0.121 | −0.08 (−9.70, 8.16) 0.863 | −2.21 (‐5.14, 0.71) 0.136 | 11.10 (3.20, 19.00) 0.007 | 2.57 (−6.01, 11.16) 0.548 | −5.01 (−12.15, 2.14) 0.165 | 8.29 (1.42, 15.17) 0.019 |
| Percent difference in analyte concentration per 10 mg/mL/1.73m2 lower eGFR (beta, 95% CI)a adjusted for diabetes among participants with non‐dialysis CKD,a n = 45 | 6.10 (0.79–11.42) 0.025 | – | −4.27 (−9.40, 0.86) 0.100 | −0.07 (−9.74, 8.25) 0.868 | −2.53 (−5.44, 0.38) 0.088 | 11.15 (3.30, 19.00) 0.006 | 2.68 (−5.77, 11.13) 0.525 | −5.04 (−12.17, 2.07) 0.160 | 8.25 (1.32, 15.18) 0.021 |
atRA, all‐trans retinoic acid; CI, confidence interval; CKD, chronic kidney disease; eGFR, estimated glomerular filtration rate; RA, retinoic acid; RBP4, retinol binding protein 4; TTR, transthyretin.
Linear regression was used to evaluate associations of kidney function and retinol and RBP4 and to estimate p values. Analyte concentrations were log‐transformed in order to examine linear associations with eGFR. Values indicate the slope of the regression line per 10 units of eGFR. P‐for trend statistics were obtained using the Wald test for the four ordinal categories of kidney function among all participants.
Plasma retinol concentrations were higher in patients with CKD at all stages, compared with healthy subjects (Figure 2 c). The highest retinol levels were observed in patients with CKD at stages 3–5 and dialyzed patients (Table 2). Among patients with CKD, lower eGFR was associated with higher plasma retinol (p = 0.006; Figure 2 d) and this association was unaffected by diabetes status. A significant difference in plasma retinol concentration (β = 6.09; 95% confidence interval = 0.83–11.35 µM per 10 mg/mL/1.73m2 decrease in eGFR) was observed. This association was not altered when adjusted for the presence of diabetes (β = 6.10; 95% confidence interval = 0.79–11.42 μM per 10 mg/mL/1.73m2 decrease in eGFR; Table 2). Circulating retinol concentrations were less variable in healthy subjects (IQR = 0.53) than in patients with CKD (IQR = 2.65). CKD was not associated with molar ratios for retinol:RBP4 (Table 2). Plasma retinol concentrations were correlated with RBP4 in healthy subjects and in those with CKD (Supplementary Figure S1).
The atRA concentrations were higher in CKD and dialysis patients compared with healthy subjects (p < 0.001; Figure 3 a), the atRA/retinol ratio was not significantly different from controls in any of the groups with CKD (Figure 3 b). The 13cis‐RA concentrations and the 13cis‐RA/atRA ratio (Figure 3 c,d) were lower in patients with CKD at all stages and on dialysis (p < 0.001) compared with healthy subjects.
Figure 3.
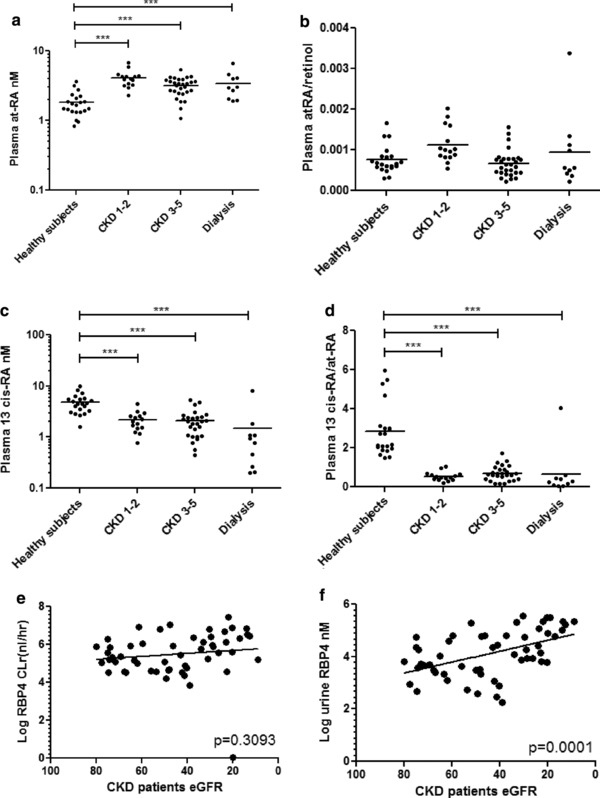
(a) All‐trans retinoic acid (atRA) concentrations are higher in patients with chronic kidney disease (CKD) and undergoing dialysis compared with healthy subjects, but the (b) atRA/retinol ratio does not change in patient with CKD. (c) The 13cis‐RA concentrations are lower in patients with CKD at all stages and on dialysis compared with healthy subjects and the (d) 13cis‐RA/atRA ratio was lower in all patients with CKD compared with healthy controls. (e) Retinol binding protein 4 (RBP4) renal clearance does not change in patients with declining estimated glomerular filtration rate (eGFR) despite (f) higher urine RBP4 concentrations among patients with CKD. ***p ≤ 0.001.
RBP4 renal clearance (p = 0.3093; Figure 3 e) was not associated with eGFR despite higher urine RBP4 concentrations among patients with CKD (p = 0.0001; Figure 3 f). Similarly, among CKD participants, macroalbuminura (urine albumin‐to‐creatinine ratio >300 mg/g) was associated with higher urine RBP4 levels, relative to normoalbuminuric participants (Supplementary Figure S2). In a random subset of 14 patients with CKD, we were able to detect retinol in the urine of the subjects at concentrations ranging from 50 nM to 800 nM (data not shown). These concentrations were extremely low in comparison to the RBP4 concentrations measured (1–400 uM). We were unable to detect RBP4 in the urine of healthy subjects.
Plasma concentrations of TTR were unaltered in patients with CKD (Figure 4 a) with an increased plasma RBP4/TTR ratio with increasing CKD stage (Figure 4 b). Among patients with CKD, mean (IQR) vitamin A intake based on total vitamin A activity was 6,649 (5,575) IU or 766 (372) μg retinol activity equivalents. Mean (IQR) retinol intake was 520 (304) μg and the intake of provitamin A carotenoid derived β‐carotene equivalent was 2,949 (2,801) μg. RBP4, retinol (Figure 4 c,d), atRA, and 13cis‐RA (Supplementary Figure S3) concentrations were not associated with vitamin A intake in patients with CKD (all p values > 0.3). Among subjects with CKD, BMI (Figure 4 e) was not associated with higher circulating RBP4 concentrations (p = 0.35). Similarly, when healthy subjects were included in the analysis of the association between BMI and plasma RBP4 concentration, no association between BMI and RBP4 plasma concentration was observed (p = 0.94).
Figure 4.
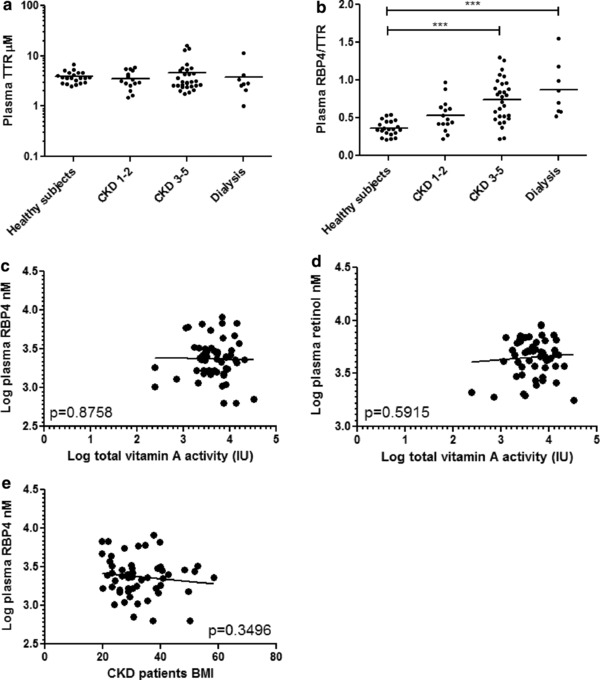
(a) Plasma transthyretin (TTR) concentrations are not associated with stage of chronic kidney disease (CKD) and (b) the retinol binding protein 4 (RBP4)/TTR ratio is higher in subjects with CKD than in healthy subjects and highest among patients on dialysis. (c) RBP4 and (d) retinol are not associated with intake of vitamin A activity units in patients with CKD (p > 0.3). (e) Body mass index (BMI) is also not associated with plasma RPB4 concentration. ***p ≤ 0.001.
DISCUSSION
This study unequivocally demonstrates that vitamin A homeostasis is altered in adults with CKD and that the increased RBP4 and retinol concentrations observed in CKD also result in increased concentrations of the active metabolite of vitamin A, RA. This suggests that in patients with CKD, RA concentrations in retinoid target tissues, such as the immune system, liver, and skin, are also altered as serum RA concentrations have been shown to correlate with tissue concentrations and reflect altered retinoid metabolism in target tissues.16 Increased retinol, RBP4, and RA concentrations may lead to adverse outcomes; chronically elevated plasma retinoid concentrations have been associated with osteoporosis/osteopenia,17 cardiac events,18 and hypertriglyceridemia (and other dyslipidemias),19 which are distressingly common in patients with CKD. Normalizing retinoid homeostasis in this population could play a major role in reducing these coincident conditions. Plasma concentrations of retinol, atRA, 13cis‐RA, RBP4, and TTR, and the retinol:RBP4 and RBP4:TTR ratios were within twofold of the values reported in children with CKD by Manickavasagar et al.5 Additionally, our reported values for RBP4 and RBP4:TTR were also similar to those reported by Henze et al.4 and Frey et al.3 in adult CKD populations (e.g., our reported RBP4 concentration of 2.6 μM in subjects with CKD vs. 3.8 μM and 3.75 μM, respectively).
The findings of increased RBP4 and retinol are in agreement with previous studies that quantified RBP4 and/or retinol concentrations in patients with CKD with renal insufficiency3, 12 and a variety of comorbidities.3, 4, 6, 7, 8, 11 This increase in circulating RBP4 exists despite the inevitable loss of RBP4 due to proteinuria that is common, and is a defining diagnostic feature, in patients with CKD. In previous studies, the underlying mechanisms for the aberrant vitamin A homeostasis in this population were not resolved and it remained unclear whether the altered vitamin A homeostasis was a result of comorbidities associated with CKD (such as diabetes) vs. CKD itself. Most importantly, the relationship among CKD, diabetes, and altered vitamin A homeostasis has not been established. Erikstrup et al.8 and Cho et al.20 reported an elevated RBP‐to‐retinol ratio and RBP4 concentration in subjects with type 2 diabetes mellitus, but neither group controlled for declining kidney function frequently observed in this population. On the other hand, Frey et al.3 showed that RBP4 and retinol were elevated in CKD but did not ascertain the diabetes status of the subjects. Our data show that the differences observed in retinol and RBP4 concentrations are most likely due to CKD and not diabetes, and suggest that the changes in circulating RBP4 concentrations observed in patients with diabetes were mainly due to renal impairment associated with diabetes. This interpretation is in agreement with previous findings that children with CKD (without diabetes) have similar alterations in vitamin A homeostasis5 as observed here in adult patients. Several preclinical models have also suggested that obesity alters RBP4 and retinol secretion as adipose tissue (in addition to the liver) can synthesize RBP4.21, 22 To address this, we demonstrated that, in individuals with CKD, obesity has a minimal effect of RBP4 concentrations. RBP4 is synthesized mainly in the liver and adipose tissue; the liver secretes only RBP4 bound to retinol.23 This was not a factor in our population as plasma RBP4 concentrations were not associated with BMI and, hence, the effects observed are likely predominantly due to CKD itself.
The elevated RBP4 and retinol concentrations in CKD have largely been proposed to be due to decreased renal clearance of RBP‐retinol. Accumulation of circulating RBP4 and retinol in our CKD study population is explainable by either the impaired ability of the kidneys to excrete RBP4 and retinol or increased hepatic synthesis of RBP4 with accompanying release of retinol from hepatic stores. Because the TTR‐RBP4 complex is too large to be filtered, whereas RBP4 is filtered by the glomerulus, an alteration in the TTR to RBP4 ratio could result in altered RBP4 renal clearance. Plasma and urinary RBP4 in patients with CKD may also be affected by impaired megalin‐mediated reabsorption of many proteins in the diseased proximal tubule, despite the fact that filtration is decreased.
Our results show that, in CKD, the RBP4 concentrations in the urine are increased with no change in the renal clearance of RBP4 suggesting altered renal clearance of retinol, and RBP4 and retinol are not responsible for the increased plasma concentrations. In addition, the TTR/RBP4 ratio was unchanged in CKD. Hence, we hypothesized that the increased retinol concentrations may be due to decreased metabolism of retinol to atRA. If metabolism of retinol to atRA by aldehyde dehydrogenase 1A1 (ALDH1A1) and ALDH1A2 was decreased, the atRA/retinol ratio should be decreased in patients with CKD. However, we found that this ratio was unchanged in patients with CKD suggesting that the etiology of increased retinol and RBP4 concentrations is increased synthesis (de‐esterification) of retinol in the liver and not decreased metabolism to atRA.
We detected extremely low concentrations of retinol in the urine in comparison to RBP4 concentrations, with an RBP4‐to‐retinol ratio ranging from 200 to 1,000, confirming that holo‐RBP4 is not excreted in urine. At present, it is impossible to differentiate whether the retinol in urine is a result of approximately 1% of RBP4 in urine being in the holo form or excretion of retinol directly into the urine. Our observation is interesting given that plasma RBP4 is reported to be present as 86% and 67% holoprotein in healthy controls and patients with CKD, respectively.3 Clearly, the kidneys play a role in homeostatic regulation of both the retinoids and associated binding proteins, and the loss of megalin‐mediated reasbortive function in patients with CKD results in the urinary loss of albumin in tandem with other proteins, including RBP4 (Supplementary Figure S2).
The 13cis‐RA is formed in humans either via ALDH1A1 mediated synthesis from 13cis‐retinal16 or via isomerization from atRA via glutathione S‐transferase and glutathione mediated processes. However, the native precursor for 13cis‐RA is not known, therefore, the mechanism for the significantly decreased 13cis‐RA concentration and decreased 13cis‐RA/atRA ratio cannot be determined. Given that 13cis‐RA and atRA can be generated by largely independent pathways, further work is required to evaluate the importance of this observation. Possible mechanisms include altered isomerization from atRA to 13cis‐RA due to increased oxidative stress, or that ALDH1A1, the only ALDH1A enzyme forming 13cis‐RA,16 is downregulated in the liver. Collectively, all the data point to altered liver retinoid handling and homeostasis in CKD.
We propose that altered signaling between the kidneys and liver in CKD affects liver RBP4 and retinol synthesis and results in elevated circulating RBP4 and retinol concentrations. The effect of kidney disease on hepatic function has been well‐described for hepatic cytochrome P450 enzymes and hepatic drug transporters.24 Uremic toxins, which accumulate in patients with CKD, have been shown to both directly inhibit enzyme activity as well as interfere with transcriptional activation, resulting in downregulation of gene expression mediated by proinflammatory cytokines.24 Further research is necessary to determine if uremic toxins can also affect enzymes in the retinoid metabolism pathway, however, we believe that uremia is not solely responsible for the observed changes as altered retinoid metabolism is observed in even stages 1 and 2 CKD when the uremic burden is minimal. As such, it is plausible that CKD directly affects liver RBP synthesis and retinol ester release as retinol, and at the same time decreases 13cis‐RA synthesis by ALDH1A1 or by glutathione mediated mechanisms from retinol and atRA.
This study has several limitations. First, we have used a commercial enzyme‐linked immunosorbent assay kit for quantifying RBP4; some investigators have expressed concern that enzyme‐linked immunosorbent assay is less accurate than conventional Western blotting.25 However, we believe that our methodology, which includes a standard curve that is linear within the relevant range, is sufficient for accurate measurement of RBP4. Second, we measured total RBP4 and did not distinguish between holo‐RBP4 and apo‐RBP4; this may be relevant for future studies as apo‐RPB4 can be regulated by a feedback mechanism that regulates mobilization and release of holo‐RBP4 from hepatic retinoid stores.3 A related source of confounding may be that below some GFR threshold (which has not been determined), the filtered load of apo‐RBP may exceed the maximum transport capacity by the proximal tubule, which would result in a nonlinear relationship between the excretion rate and concentration of plasma apo‐RBP. However, despite these limitations, we believe that our results implicate changes in hepatic synthesis and that secretion of RBP4/retinol is involved in the dysregulation observed in patients with CKD.
Normalizing retinoid homeostasis in patients with CKD could play a major role in reducing coincident osteoporosis/osteopenia,17 cardiac events,18 and hypertriglyceridemia (and other dyslipidemias).19 A clearer understanding of the pathophysiologic mechanism of elevated RBP4 and retinoids is critical in order to develop pharmacologic and dietary interventions to reduce circulating retinoid concentrations and avoid common comorbid conditions.
The observation that retinoid homeostasis is significantly altered even in stages 1 and 2 CKD suggests that altered retinoid status may be an early and sensitive marker of impaired kidney function or may be a predictor of the rate of decline in GFR. Based on this study, further longitudinal study associating retinoid homeostasis with clinical outcomes is warranted.
In summary, we have shown that circulating retinol and its carrier protein levels are elevated in patients with CKD and that this effect is independent of vitamin A dietary intake and diabetes status. This effect is due to increased hepatic synthesis and secretion of RBP4 and retinol mediated by an uncharacterized signaling pathway between the kidneys and liver. Further study is required in order to define the mechanisms by which kidney disease affects hepatic protein expression and activity. This study highlights the necessity to redefine CKD not as an isolated disease, but as a global condition that affects many organ systems.
Author Contributions
C.K.Y., N.I., J.J., C.R.C., and B.R.K. wrote the manuscript. C.K.Y., N.I., J.J., and C.R.C. designed the research. C.K.Y., N.I., J.J., and I.P. performed the research. C.K.Y., J.J., C.R.C., I.P., and B.R.K. analyzed the data. N.I. and B.R.K. contributed new reagents/analytical tools.
Conflict of Interest
The authors declared no conflict of interest.
Supporting information
Disclaimer: Supplementary materials have been peer‐reviewed but not copyedited.
Supporting Informtion
Supporting Informtion
Supporting Informtion
Supporting Informtion
Supporting Informtion
Acknowledgments
These studies were supported by grants from the National Institute of Health NCATS Grant KL2 TR000421 and NIGMS R01GM111772. C.K.Y. would like to acknowledge the Norman S. Coplon Extramural Grant Program by Satellite Healthcare, a not‐for‐profit renal care provider. This research was supported by an unrestricted gift from the Northwest Kidney Centers to the Kidney Research Institute.
References
- 1. US Renal Data System, USRDS 2013. Annual Data Report: Atlas of End‐Stage Renal Disease in the United States, National Institutes of Health, National Institute of Diabetes and Digestive and Kidney Diseases, Bethesda, MD. [Google Scholar]
- 2. Bosworth, C. & de Boer, I.H. Impaired vitamin D metabolism in CKD. Semin. Nephrol. 33, 158–168 (2013). [DOI] [PMC free article] [PubMed] [Google Scholar]
- 3. Frey, S.K. et al Isoforms of retinol binding protein 4 (RBP4) are increased in chronic diseases of the kidney but not of the liver. Lipids Health Dis. 7, 29 (2008). [DOI] [PMC free article] [PubMed] [Google Scholar]
- 4. Henze, A. et al Alterations of retinol‐binding protein 4 species in patients with different stages of chronic kidney disease and their relation to lipid parameters. Biochem. Biophys. Res. Commun. 393, 79–83 (2010). [DOI] [PubMed] [Google Scholar]
- 5. Manickavasagar, B. et al Hypervitaminosis A is prevalent in children with CKD and contributes to hypercalcemia. Pediatr. Nephrol. 30, 317–325 (2015). [DOI] [PMC free article] [PubMed] [Google Scholar]
- 6. Michaëlsson, K. , Lithell, H. , Vessby, B. & Melhus, H. Serum retinol levels and the risk of fracture. N. Engl. J. Med. 348, 287–294 (2003). [DOI] [PubMed] [Google Scholar]
- 7. Lambadiari, V. et al Serum levels of retinol‐binding protein‐4 are associated with the presence and severity of coronary artery disease. Cardiovasc. Diabetol. 13, 121 (2014). [DOI] [PMC free article] [PubMed] [Google Scholar]
- 8. Erikstrup, C. et al RBP‐to‐retinol ratio, but not total RBP, is elevated in patients with type 2 diabetes. Diabetes Obes. Metab. 11, 204–212 (2009). [DOI] [PubMed] [Google Scholar]
- 9. Chen, C. et al Pharmacokinetics of retinoids in women after meal consumption or vitamin A supplementation. J. Clin. Pharmacol. 36, 799–808 (1996). [DOI] [PubMed] [Google Scholar]
- 10. Makimura, H. , Wei, J. , Dolan‐Looby, S.E. , Ricchiuti, V. & Grinspoon, S. Retinol‐binding protein levels are increased in association with gonadotropin levels in healthy women. Metabolism 58, 479–487 (2009). [DOI] [PMC free article] [PubMed] [Google Scholar]
- 11. Barazzoni, R. et al High plasma retinol binding protein 4 (RBP4) is associated with systemic inflammation independently of low RBP4 adipose expression and is normalized by transplantation in nonobese, nondiabetic patients with chronic kidney disease. Clin. Endocrinol. (Oxf). 75, 56–63 (2011). [DOI] [PubMed] [Google Scholar]
- 12. Henze, A. et al Evidence that kidney function but not type 2 diabetes determines retinol‐binding protein 4 serum levels. Diabetes 57, 3323–3326 (2008). [DOI] [PMC free article] [PubMed] [Google Scholar]
- 13. Bosworth, C.R. et al The serum 24,25‐dihydroxyvitamin D concentration, a marker of vitamin D catabolism, is reduced in chronic kidney disease. Kidney Int. 82, 693–700 (2012). [DOI] [PMC free article] [PubMed] [Google Scholar]
- 14. Levey, A.S. et al A new equation to estimate glomerular filtration rate. Ann. Intern. Med. 150, 604–612 (2009). [DOI] [PMC free article] [PubMed] [Google Scholar]
- 15. Arnold, S.L. , Amory, J.K. , Walsh, T.J. & Isoherranen, N. A sensitive and specific method for measurement of multiple retinoids in human serum with UHPLC‐MS/MS. J. Lipid Res. 53, 587–598 (2012). [DOI] [PMC free article] [PubMed] [Google Scholar]
- 16. Arnold, S.L. , Kent, T. , Hogarth, C.A. , Griswold, M.D. , Amory, J.K. & Isoherranen, N. Pharmacological inhibition of ALDH1A in mice decreases all‐trans retinoic acid concentrations in a tissue specific manner. Biochem. Pharmacol. 95, 177–192 (2015). [DOI] [PMC free article] [PubMed] [Google Scholar]
- 17. Penniston, K.L. & Tanumihardjo, S.A. The acute and chronic toxic effects of vitamin A. Am. J. Clin. Nutr. 83, 191–201 (2006). [DOI] [PubMed] [Google Scholar]
- 18. Desai, C.K. , Huang, J. , Lokhandwala, A. , Fernandez, A. , Riaz, I.B. & Alpert, J.S. The role of vitamin supplementation in the prevention of cardiovascular disease events. Clin. Cardiol. 37, 576–581 (2014). [DOI] [PMC free article] [PubMed] [Google Scholar]
- 19. Brelsford, M. & Beute, T.C. Preventing and managing the side effects of isotretinoin. Semin. Cutan. Med. Surg. 27, 197–206 (2008). [DOI] [PubMed] [Google Scholar]
- 20. Cho, Y.M. et al Plasma retinol‐binding protein‐4 concentrations are elevated in human subjects with impaired glucose tolerance and type 2 diabetes. Diabetes Care 29, 2457–2461 (2006). [DOI] [PubMed] [Google Scholar]
- 21. Tsutsumi, C. et al Retinoids and retinoid‐binding protein expression in rat adipocytes. J. Biol. Chem. 267, 1805–1810 (1992). [PubMed] [Google Scholar]
- 22. Yang, Q. et al Serum retinol binding protein 4 contributes to insulin resistance in obesity and type 2 diabetes. Nature 436, 356–362 (2005). [DOI] [PubMed] [Google Scholar]
- 23. Conaway, H.H. , Henning, P. & Lerner, U.H. Vitamin A metabolism, action, and role in skeletal homeostasis. Endocr. Rev. 34, 766–797 (2013). [DOI] [PubMed] [Google Scholar]
- 24. Yeung, C.K. , Shen, D.D. , Thummel, K.E. & Himmelfarb, J. Effects of chronic kidney disease and uremia on hepatic drug metabolism and transport. Kidney Int. 85, 522–528 (2014). [DOI] [PMC free article] [PubMed] [Google Scholar]
- 25. Graham, T.E. , Wason, C.J. , Blüher, M. & Kahn, B.B. Shortcomings in methodology complicate measurements of serum retinol binding protein (RBP4) in insulin‐resistant human subjects. Diabetologia 50, 814–823 (2007). [DOI] [PubMed] [Google Scholar]
Associated Data
This section collects any data citations, data availability statements, or supplementary materials included in this article.
Supplementary Materials
Disclaimer: Supplementary materials have been peer‐reviewed but not copyedited.
Supporting Informtion
Supporting Informtion
Supporting Informtion
Supporting Informtion
Supporting Informtion