Abstract
Aims and Objectives:
Environmental pollens are known to cause exacerbation of symptoms of patients with allergic rhinitis (AR) and asthma. During pollen months, number of patients visiting hospital has been shown to increase in some studies. However, in India, such studies are lacking. Therefore, we aimed to study pollen counts and to find its correlation with number of new patients attending Asthma Bhawan for 2 years.
Materials and Methods:
Aerobiological sampling was done using Burkard 24 h spore trap system. The site selected for the entrapment of the air spore was the building of Asthma Bhawan situated at Vidhyadhar Nagar, Jaipur. New patients coming with problems of respiratory allergy such as AR or asthma were recruited in the study. Skin prick tests (SPTs) were carried out after obtaining consent in these patients. Monthly pollen counts of trees, weeds and grasses were correlated with the number of new patients. Pollen calendar was prepared for 2 years.
Results:
Average annual pollen count during 2011 and 2012 were 14,460.5. In the analysis, 37 types of species or families were identified. Pollen count showed two seasonal peaks during March–April and from August to October. January and June showed the lowest pollen counts in 2 years. Average monthly count of grass pollens showed significant correlation with number of new patients (r = 0.59). However, monthly pollen count of trees and weeds did not correlate. The correlation of the pollen count of individual pollen with the SPT positivity to that pollen showed significant correlation with Chenopodium album only.
Conclusions:
It can be concluded that there were two peaks of pollen count in a year during March–April and August–October. Average monthly pollen counts of grass were significantly correlated with the number of hospital visits of new patients.
KEY WORDS: Pollen calendar, pollen count, skin prick test
INTRODUCTION
Pollens are important allergens which trigger symptoms in patients with allergic diseases such as allergic rhinitis (AR) and asthma. Pollens during pollination period generally trigger asthma. At the time of seasonal peaks, large number of pollen grains are liberated from the trees and remain suspended in the air. In various studies, it was observed that number of patients attending hospital increases with higher pollen count in that period.[1,2,3] Therefore, knowledge about pollen season of the area may prove an important tool for a doctor treating asthmatic patients.
Pollen count varies at different places and is affected by the topographical factors, local vegetation of the area, and meteorological factors.[4,5] Several aerobiological surveys have been conducted to find out pollen type and count.[6,7,8,9,10,11,12,13,14,15,16,17] Pollen calendars are prepared on the basis of monthly pollen counts of various plants. Pollen calendar is a useful tool in the diagnosis and management of allergic disorders. During pollination season, sensitive subjects develop symptoms of the disease, therefore, chances of getting new patients increases. However, we could not find significant Indian data relating pollen counts with clinical symptoms except a Jaipur study carried out in 1957–1958.[18,19]
Therefore, we conducted this study to characterize main types of pollens in Jaipur and to find a correlation with the hospital visit of new patients of asthma and AR.
MATERIALS AND METHODS
The study was carried out at Asthma Bhawan, located in the Western part of Jaipur. Patients of asthma and AR commonly attend Asthma Bhawan. New patients of AR and asthma who were residents of Jaipur were included in the study. Skin prick tests (SPTs) were performed using allergen extracts, saline as negative control and histamine as positive control. These test kits were provided by All Cure Pharma (Haryana, India). SPT was performed at Asthma Bhawan from January 2011 to December 2012. The reactions were evaluated after 20 min of skin prick. It was considered positive when wheal diameter was more than 3 mm of size, or it was with pseudopodia formation.[20]
Pollen sampling was carried out from January 1, 2011, to December 31, 2012. The aerobiological samples of pollens were collected through Burkard 24 h spore trap system, which is a type of suction sampler. It was stationed at only one place. Although sampling collected at multiple places is desirable yet pollen sampling carried at one place is also shown be representative of 30 km radius area.[21] The method of pollen collection, preparation of slide and analysis of sample had been described.[22,23,24,25] Pollens were identified using reference slides. Reference slides of acetolysed pollen were prepared by the method suggested by Erdtman.[22] The counts represent number of pollens per cubic meter of air in 24 h.
Traditionally different species of Poaceae and Cheno-Amaranthaceae family are not described separately. However, we were able to differentiate some of the species from the Poaceae family. These include Cynodon, Hordeum vulgare, Pennisetum glaucum, Saccharum munja, Sorghum vulgare, Triticum aestivum, and Zea mays. Remaining pollens were kept together in the Poaceae family only. Similarly, the identifiable pollens of Cheno-Amaranthaceae family were Amaranthus spinosus, Spinacia oleracea, and Chenopodium album. Most of the pollens of Chenopodiaceae and Amaranthaceae family which could not be differentiated were grouped under the heading of Cheno-Amaranthaceae.
The total number of new patients attending the hospital during 12 months was averaged for 2 years. Similarly, pollen data of 2 years were also averaged for each month. Average monthly pollen data were categorized into trees, weeds, and grasses. Pollen counts of various species were also used in making the pollen calendar of the Jaipur.
Statistical analysis
An average monthly pollen count of trees, weeds, and grasses were correlated with an average number of new patients during that month. Correlation of the SPT with the pollen counts of both years was also done using Pearson Correlation Coefficient.
RESULTS
During 2011 and 2012, the average number of new patients of asthma and AR per year attending Asthma Bhawan outpatient department was 1692.5. During these years, 28,921 pollens were collected. In 2011 and 2012, the numbers of pollen trapped were 13,738 and 15,183 respectively with yearly average of 14,460.5 pollens [Table 1]. Analysis of pollen data of 2 years showed 37 types of pollen species or families. Since many of these pollens were identified only after this study therefore during this period, SPT tests were carried out for only 17 pollens as identified in the earlier study.
Table 1.
Average pollen counts and number of new outpatient department patients during 12 months and their correlation

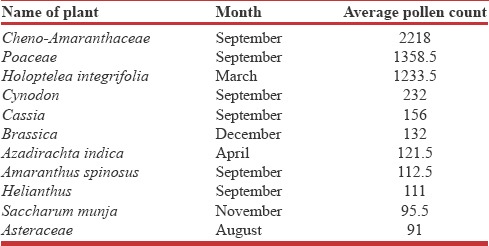
Two seasonal peaks of pollen count were observed. These were March–April and August–October. The first peak was mainly due to trees pollens while the second peak was due to weeds and grasses pollens. Major part of the first peak was in March, and it had Holoptelea (65%) as the major contributor. While major part of the second peak was contributed by grasses family. In the second season, September had the highest number, and the grasses (38%) contributed the most. The main contributors of the total pollen counts for 2 years were Poaceace family (42%) and Cheno-Amaranthaceae family (30%). During January and June months pollen counts were minimal. Cheno-Amaranthaceae, Poaceace, and Holoptelea integrifolia are the highest pollen generating plant family/species [Table 2].
Table 2.
Top ten pollen generating plant families/species during 2 years

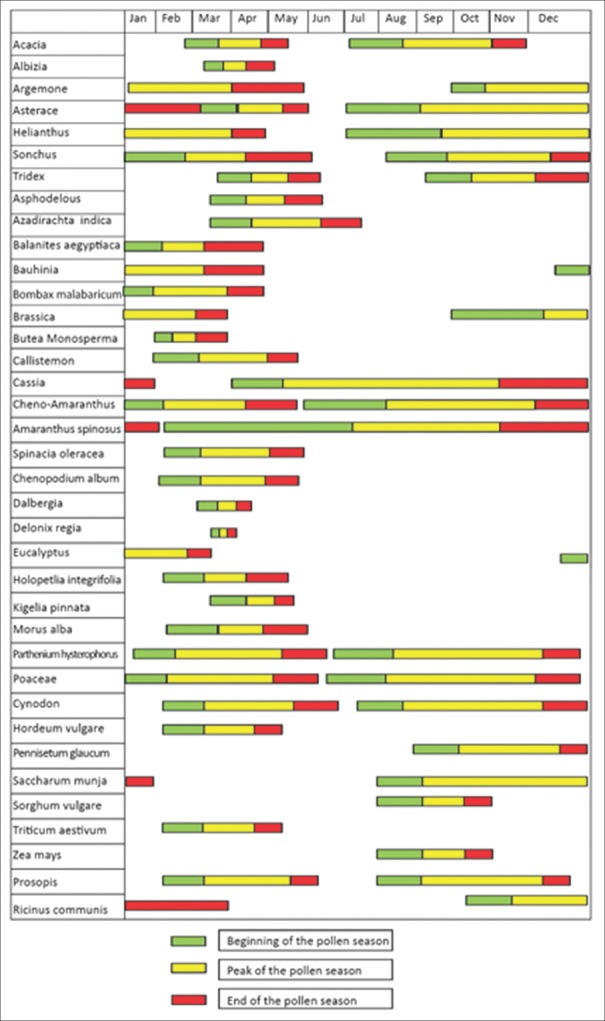
In this study, 37 types of pollen species/families were identified in the 2 years duration. Out of these 25 species/families were having a limited period of pollination in the year and 12 species/families had their pollens in the aerobiology of Jaipur throughout the year. Pollen calendar was prepared based on the presence of different pollens in specific part of the year [Figure 1].
Figure 1.
Pollen calendar of the pollens in Jaipur
When average monthly pollen counts were correlated with the number of new patients during that period, a positive correlation was found with grass pollens. Trees and weeds pollens were not correlated significantly [Table 1]. The correlation of the individual pollen with the SPT of patients gave the correlation in only one of the species that is C. album, a weed.
DISCUSSION
Pollen count peaks were observed during March to April and August to October in both years. Many studies have demonstrated that peak pollen counts were associated with higher number of hospital visits by new asthmatic or AR patients.[1,2,3] In our study also a significant positive correlation was demonstrated between number of monthly new asthmatic and AR patients and grass pollen count. However, correlation was not significant with weeds and trees.
Although in the study done in Kuwait, the number of new patients of AR were significantly correlated with weeds but not to grass and trees.[1] In yet another study, episodes of asthma exacerbations in children were significantly correlated with pollen counts.[2] The cause and effect relationship was further established in a study wherein a cohort of asthmatic patients exacerbations were monitored at monthly interval, and these were significantly correlated with the pollen counts in the environment.[3]
Similarly, an earlier study done in Jaipur in 1957–1958 showed that the number of respiratory allergy patients in allergy clinic were proportional to the fluctuation in the pollen count.[19] All these evidence suggest strong association between the presence of respiratory symptoms and presence of pollens in the environment. It emphasizes the need of proper knowledge of pulmonologists about the environmental pollens and vegetations of the area. A proper pollen calendar may prove a useful tool for clinicians involved in the treatment of patients with respiratory allergy.
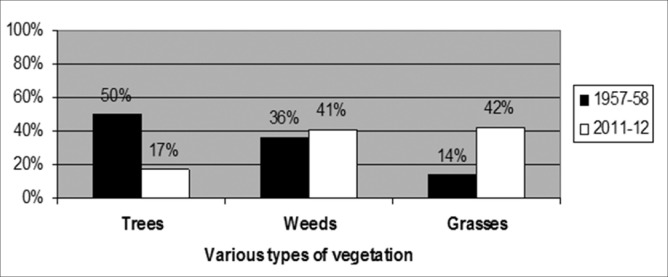
We could not compare data of absolute number of pollen counts of our study with that of earlier study because of variation in the methodology. They used slides exposed to normal environment while we used suction method. However, the proportion of various types of vegetation can be compared which showed interesting differences. Kasliwal et al. have published that in Jaipur tree pollens were 50% while grass pollens were only 14%.[18] In the present study, tree pollens constituted only 17% while proportion of grass is much higher (42%) [Figure 2]. Probably urbanization has replaced trees by concrete jungles thereby causing reduced pollen counts. In our study, grass pollens were present throughout the year and peak was present during postmonsoon period. In earlier Jaipur study grass pollens were limited only during postmonsoon period. Probably with urbanization in Jaipur during last seven decades density of trees is reduced more significantly than the grasses.
Figure 2.
Proportion of pollens of trees, weeds and grasses during 1957–1958 and 2011–2012 in Jaipur
A similar study was conducted in Delhi from September 1990 to August 1997.[26] During the 7-year period, pollen counts showed gradual decrease. This was attributed to the large clearance of vegetation from the city. In their study also they identified two peaks of pollen counts during the same period.
Studies done in different parts of India showed that there is wide variation in number of pollens and most frequent pollen.[27,28,29,30] In Gwalior, pollen grains mainly belonged to families of Poaceae and Amaranth-Chenopodiacae[27] similar to our study, while in Lucknow, grasses and Holoptelea were main pollens.[31] In the majority of places, two peaks of pollen seasons were observed but in North Kashmir peak pollen counts were observed during March–September period.[29]
CONCLUSIONS
Number of new patients of asthma and AR attending hospital were significantly correlated with grass pollen counts. Knowledge of pollen calendar may prove useful in the evaluation of patients with seasonal exacerbation of symptoms of respiratory allergy.
Financial support and sponsorship
Asthma Bhawan.
Conflicts of interest
There are no conflicts of interest.
REFERENCES
- 1.Behbehani N, Arifhodzic N, Al-Mousawi M, Marafie S, Ashkanani L, Moussa M, et al. The seasonal variation in allergic rhinitis and its correlation with outdoor allergens in Kuwait. Int Arch Allergy Immunol. 2004;133:164–7. doi: 10.1159/000076622. [DOI] [PubMed] [Google Scholar]
- 2.Tosca MA, Ruffoni S, Canonica GW, Ciprandi G. Asthma exacerbation in children: Relationship among pollens, weather, and air pollution. Allergol Immunopathol (Madr) 2014;42:362–8. doi: 10.1016/j.aller.2013.02.006. [DOI] [PubMed] [Google Scholar]
- 3.Ordaz VA, Castaneda CB, Campos CL, Rodríguez VM, Saenz JG, Ríos PC. Asthmatic exacerbations and environmental pollen concentration in La Comarca Lagunera (Mexico) Rev Alerg Mex. 1998;45:106–11. [PubMed] [Google Scholar]
- 4.Ziska LH, Epestein PR, Rogers CA. Climate change, aerobiology, and public health in the Northeast United States. Mitig Adapt Strateg Glob Change. 2008;13:607–13. [Google Scholar]
- 5.Khanduri VP. Variation in anthesis and pollen production in plants. Am Eurasian J Agric Environ Sci. 2011;11:834–9. [Google Scholar]
- 6.Frenz DA, Murray LW. An atmospheric pollen survey conducted during the winter in Minneapolis, Minnesota, USA. Grana. 1997;36:245–8. [Google Scholar]
- 7.Dvorin DJ, Lee JJ, Belecanech GA, Goldstein MF, Dunsky EH. A comparative, volumetric survey of airborne pollen in Philadelphia, Pennsylvania (1991-1997) and Cherry Hill, New Jersey (1995-1997) Ann Allergy Asthma Immunol. 2001;87:394–404. doi: 10.1016/S1081-1206(10)62921-3. [DOI] [PubMed] [Google Scholar]
- 8.Alwadie HM. Pollen concentration in the atmosphere of Abha city, Saudi Arabia and its relationship with meteorological parameters. J Appl Sci. 2008;8:842–7. [Google Scholar]
- 9.Liu ZG, Song JJ, Kong XL. A study on pollen allergens in China. Biomed Environ Sci. 2010;23:319–22. doi: 10.1016/S0895-3988(10)60070-0. [DOI] [PubMed] [Google Scholar]
- 10.Murray MG, Galan C, Villamil CB. Airborne pollen in Bahia Blanca, Argentina: Seasonal distribution of pollen types. Aerobiologia. 2010;26:195–207. [Google Scholar]
- 11.Çeter T, Pinar NM, Güney K, Yildiz A, Aşcı B, Smith M, et al. A 2-year aeropalynological survey of allergenic pollen in the atmosphere of Kastamonu, Turkey. Aerobiologia. 2012;28:355–66. [Google Scholar]
- 12.Melgar M, Trigo MM, Recio M, Docampo S, García-Sánchez J, Cabezudo B. Atmospheric pollen dynamics in Münster, north-western Germany: A three-year study (2004–2006) Aerobiologia. 2012;28(4):423–34. [Google Scholar]
- 13.Singh AB, Babu CR. Survey of atmospheric pollen allergens in Delhi: Seasonal periodicity. Ann Allergy. 1982;48:115–22. [PubMed] [Google Scholar]
- 14.Mandal J, Chakraborty P, Roy I, Chatterjee S, Gupta-Bhattacharya S. Prevalence of allergenic pollen grains in the aerosol of the city of Calcutta, India: A two year study. Aerobiologia. 2008;24:151–64. [Google Scholar]
- 15.Sahney M, Chaurasia S. Seasonal variations of airborne pollen in Allahabad, India. Ann Agric Environ Med. 2008;15:287–93. [PubMed] [Google Scholar]
- 16.Shukla S, Shukla RV. A quantitative survey of pollen flora in atmosphere of Korba-Chhattisgarh, India. Int J Bot. 2010;6:449–55. [Google Scholar]
- 17.Nayar TS, Jothish PS. An assessment of the air quality in indoor and outdoor air with reference to fungal spores and pollen grains in four working environments in Kerala, India. Aerobiologia. 2013;29:131–52. [Google Scholar]
- 18.Kasliwal RM, Sethi JP, Sogani IC. Studies in atmospheric pollen: A daily census of pollens at Jaipur 1957-1958. Indian J Med Res. 1959;47:515–21. [PubMed] [Google Scholar]
- 19.Kasliwal RM, Solomon SK. Correlation of respiratory allergy cases with atmosphere pollen concentrations and meteorological factors. J Assoc Phys India. 1958;6:180–95. [Google Scholar]
- 20.Bousquet J, Heinzerling L, Bachert C, Papadopoulos NG, Bousquet PJ, Burney PG, et al. Practical guide to skin prick tests in allergy to aeroallergens. Allergy. 2012;67:18–24. doi: 10.1111/j.1398-9995.2011.02728.x. [DOI] [PubMed] [Google Scholar]
- 21.Katelaris CH, Burke TV, Byth K. Spatial variability in the pollen count in Sydney, Australia: Can one sampling site accurately reflect the pollen count for a region? Ann Allergy Asthma Immunol. 2004;93:131–6. doi: 10.1016/S1081-1206(10)61464-0. [DOI] [PubMed] [Google Scholar]
- 22.Erdtman G. Pollen Morphology and Plant Taxonomy – Angiosperms: An Introduction to Palynology. I. Waltham: Almqvist and Wiksell; 1952. p. 539. [Google Scholar]
- 23.Erdtman G. An Introduction to the Study of Pollen Grains and Spores. Copenhagen: Munksgaard; 1969. Handbook of Palynology. Morphology, Taxonomy, Ecology; p. 486. [Google Scholar]
- 24.Faegri K, Iverson J. Textbook of Modern Pollen Analysis. Copenhagen, Denmark: Munksgaard; 1950. p. 168. [Google Scholar]
- 25.Caulton E, Lacey M. The British Aerobiology Federation. Airborne Pollens and Spores: A Guide to Trapping and Counting. Harpenden: The British Aerobiology Federation; 1995. p. 59. [Google Scholar]
- 26.Singh AB, Pandit T, Dahiya P. Changes in airborne pollen concentrations in Delhi, India. Grana. 2003;42:168–77. [Google Scholar]
- 27.Chauhan SV, Goyal R. Pollen calendar of Agra city with special reference to allergenic significance. J Environ Biol. 2006;27:275–81. [Google Scholar]
- 28.Gupta M, Jain AK. Incidence of pollen grains at an urban site at Gwalior (M.P.) Biol Forum Int J. 2010;2:11–4. [Google Scholar]
- 29.Mir MA, Albaradie RS. Hypersensitive allergic reactions are caused by Pollen abundantly found in air during the spring and autumn seasons. Int J Pure Appl Biosci. 2013;1:68–80. [Google Scholar]
- 30.Ahlawat M, Dahiya P. Risk of pollen allergy in Rohtak city (Haryana), India: A pollen calendar. Plant Arch. 2014;14:177–84. [Google Scholar]
- 31.Datta K, Chatterjee A, Nigam D, Singh SP, Verma PC. Recent scenario of airborne pollens of Lucknow, India with special reference to intra- and interannual, diurnal, and vertical variation. Res Rep Biodivers Stud. 2012;2:1–22. [Google Scholar]


