
Figure 6. Methylation status of the IG-DMR and Gtl2-DMR domain in myostatin-deficient skeletal muscle.
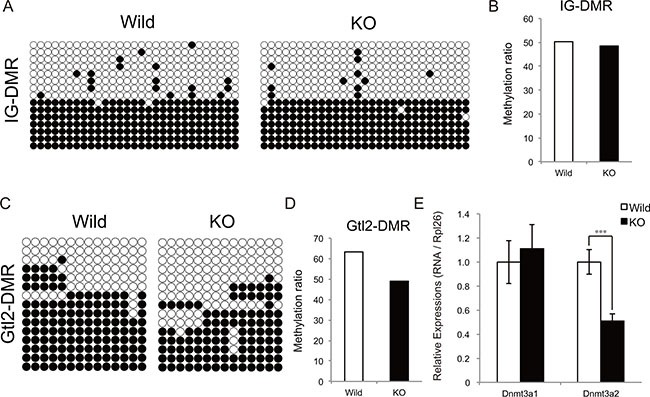
Bisulfite sequencing analysis shows the methylation maps around the IG-DMR (A) and Gtl2-DMR (C) domain. The CpG sites are indicated by circles (black circles indicate methylated and white circles indicate unmethylated cytosine sites, respectively) and each row represents an individual clone. The methylation ratio of the IG-DMR (B) and Gtl2-DMR (D) domain in the myostatin knockout mice is shown as the percentage of that in wild-type mice. (E) Quantitative RT-PCR showing decreased Dnmt3a2 expression in myostatin-deficient skeletal muscle. The wild-type mice are the same age as the myostatin knockout mice. The results were normalized to the expression of Rpl26. Data are the mean ± SD (n = 5). ***P < 0.001.