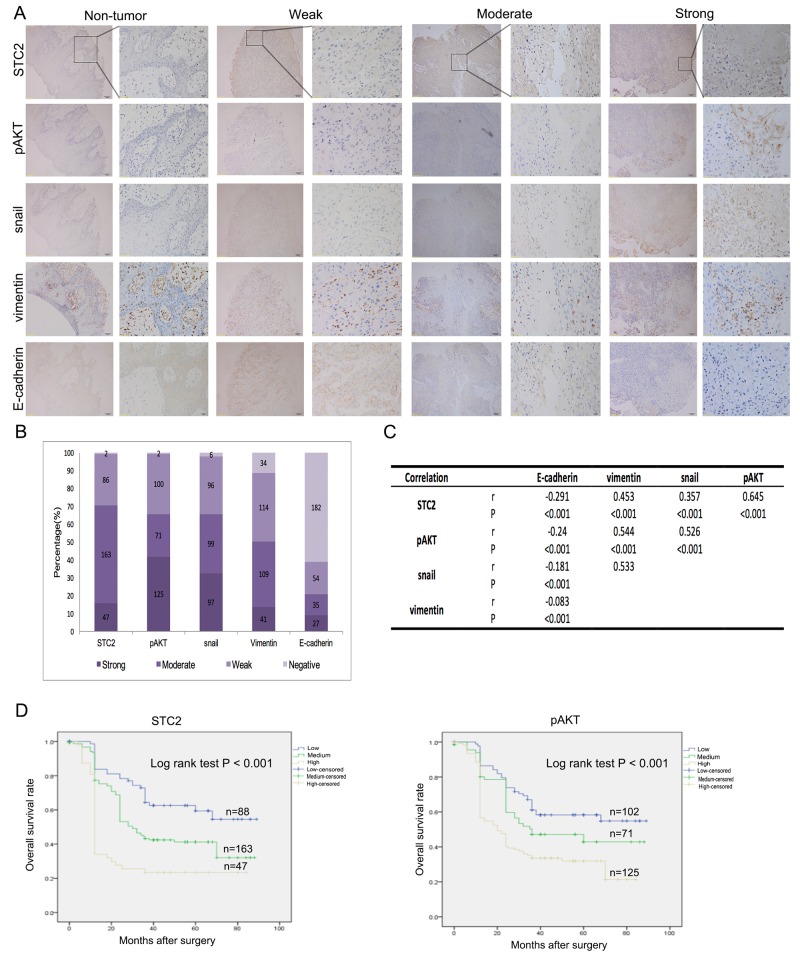
Figure 6. Clinical correlations with expression of STC2, pAKT, Snail, Vimentin and E-cadherin.
A. Representative immunostaining images showing strong, moderate and weak expression of STC2, pAKT, Snail, Vimentin and E-cadherin, respectively. Consecutive slides were stained. Magnification, × 100 and × 400. B. Bar graph shows the statistics for the staining intensity of STC2, pAKT, Snail, Vimentin and E-cadherin in tissue arrays containing 289 HNSCC patients. C. Statistical correlation of the PI3K/AKT/Snail pathway components in 298 HNSCC patients D. Overall survival analysis based on the expression levels of STC2 and pAKT.

